We have published a more recent review of this organization. See our most recent report on Against Malaria Foundation.
The Against Malaria Foundation (AMF) is one of our top-rated charities and we believe that it offers donors an outstanding opportunity to accomplish good with their donations.
More information: What is our evaluation process?
Published: November 2021; Last Updated: November 2022
Summary
What do they do? AMF (againstmalaria.com) provides funding for long-lasting insecticide-treated net (LLIN) distributions (for protection against malaria) in developing countries. (More)
Does it work? There is strong evidence that distributing LLINs reduces child mortality and malaria cases. AMF conducts post-distribution surveys of completed distributions to determine whether LLINs have reached their intended destinations and how long they remain in good condition. AMF's post-distribution surveys have generally found positive results but have some methodological limitations. (More)
What do you get for your dollar? We estimate that the cost to purchase and distribute an AMF-funded net is $5.19, or $4.89 excluding in-kind contributions from governments. The numbers of deaths averted and other benefits of distributing LLINs are a function of a number of difficult-to-estimate factors, which we discuss in detail below. (More)
Is there room for more funding? Our most recent analysis finds that AMF currently has $33.2 million in room for more funding—prior to receiving any grants that GiveWell specifically makes or recommends—to support its LLINs portfolio in 2023. (More)
AMF is recommended because of its:
- Focus on a program with excellent evidence of effectiveness and cost-effectiveness.
- Processes for ensuring that nets reach their intended recipients and monitoring whether they remain in homes and in good condition over the long-term.
- Room for more funding – we believe AMF will be able to use additional funds to deliver additional nets.
- Transparency – AMF shares significant information about its work with us and we are able to closely follow and understand its work.
Major open questions:
- The best evidence for nets was collected before they were widely used, and there is some evidence that mosquitoes have since adapted to the insecticide used in nets, possibly making them less effective. It seems that insecticide resistance is a growing concern, but it remains difficult to quantify the impact of resistance. We will continue to follow several ongoing studies that may help to quantify the impact of resistance. We discuss this issue in more detail in our page on this topic.
Table of Contents
- Summary
- Our review process
- What do they do?
-
Does it work?
- Are LLINs an effective intervention?
- Are AMF's distributions targeted such that they are likely to be effective?
- How do AMF's distributions impact LLIN ownership and usage over time? Do those LLINs remain effective over time?
- Do AMF's distributions increase the total number of LLINs distributed, or would mass distributions of LLINs have taken place in AMF's absence?
- Are there any negative or offsetting impacts?
- What do you get for your dollar?
- Is there room for more funding?
- AMF as an organization
- Sources
Our review process
We began reviewing AMF in 2009. Our review process has consisted of:
- Reviewing documents AMF made available on its website or shared with us directly.
- Extensive communication, including several meetings at AMF's London headquarters, with AMF Founder Rob Mather and board member Peter Sherratt.
- A visit to AMF's distribution partner organization, United Purpose (formerly Concern Universal), in Malawi in October 2011 (notes and photos from this visit). We also spoke with United Purpose by phone in April 2016.
- A visit to Greater Accra, Ghana in August 2016 to meet with representatives of AMF, AMF's distribution partners Episcopal Relief & Development and Anglican Diocesan Development and Relief Organization (ADDRO), Ghana's National Malaria Control Program, and other non-profit and government organizations involved in the AMF-funded LLIN distributions in Ghana in 2016. Notes and photos from our site visit are available here.
- Conversations with Peter Sherratt, AMF's Executive Chairman; Don de Savigny, a member of AMF's Malaria Advisory Group; and other individuals (who requested to remain anonymous) familiar with AMF's work.
- Conversations with Melanie Renshaw of the African Leaders Malaria Alliance, Marcy Erskine of the International Federation of the Red Cross, and Scott Filler of the Global Fund to Fight AIDS, Tuberculosis, and Malaria about funding needs for nets.
- Conversations with AMF's partner organizations that implement follow-up surveys of AMF distributions.
All content on AMF, including past reviews, updates, blog posts and conversation notes, is available here. We have also published a page with additional, detailed information on AMF to supplement some of the sections below.
What do they do?
AMF provides long-lasting insecticide-treated nets (for protection against malaria) in bulk to other non-profit organizations or government agencies, which then distribute the nets in developing countries. Through 2020, AMF had supported large-scale distributions in eight countries (DRC, Ghana, Guinea, Malawi, Papua New Guinea, Togo, Uganda, and Zambia), for a total of 78 million LLINs distributed.1 A summary of AMF's distributions can be found in this spreadsheet.
The role of AMF and its partners in LLIN distributions
AMF's role in LLIN distributions is to:2
- Identify countries with funding gaps for LLINs.
- Identify distribution partners (in-country non-profit organizations or government agencies) to carry out LLIN distributions. AMF and its partners agree on expectations for the distribution, including who pays for costs other than the purchase price of LLINs (which are always covered by AMF), the process that will be used to carry out the distribution, and what information will be collected and shared with AMF.
- Identify which net types to use based on malaria prevalence, insecticide resistance, and price data.3
- Purchase LLINs and have them shipped to the distribution partners.
- Work with distribution and independent monitoring partners to ensure that the agreed-upon process for the distribution is implemented, collect reports on the distribution, and conduct follow-up surveys.
Distribution partners implement on-the-ground activities, including registering residents in targeted areas and distributing LLINs. Independent monitors funded by AMF monitor the registration and distribution processes and conduct follow-up surveys.4
Details follow.
Selecting locations for distributions
Historically, when selecting locations for distributions, AMF consulted various sources, including the Alliance for Malaria Prevention's (AMP's) list of countries with significant net gaps, other malaria control funders, in-country technical advisors, the relevant national malaria control program (NMCP), implementing organizations, and the African Leaders Malaria Alliance.5 In recent years, it has increasingly been receiving inbound funding requests from countries with net gaps6 or renewing support to countries it supported in prior distributions.7
For an example of the process AMF went through to establish the funding gap in Guinea for its 2019 distribution, see @Rob Mather, AMF CEO, email to GiveWell explaining Guinea process, October 14, 2018@.
Registration and distribution
- Registration: During the registration process, national health system staff or volunteers8 travel door-to-door in targeted areas to collect the information used to determine the number of LLINs to allocate to each household (e.g., the number of sleeping spaces and/or the number of household members), as well as the information used to identify the household for the distribution and post-distribution surveys (e.g., the name of the head of the household and/or household location). The specifics of the registration process and LLIN allocation strategy have differed by country (process details and registration data sources on a separate page with additional details about AMF; this information may be outdated).
- Distribution: Distribution partners manage the logistics of in-country shipping and storage of LLINs prior to the distribution. To distribute LLINs to recipients, AMF's distribution partners have primarily used a "point" distribution procedure (LLIN recipients pick up their nets from a specified point in or near their community); they have also occasionally used a "hang-up" distribution procedure (staff or volunteers travel door-to-door to deliver and hang up LLINs). The specifics of distribution processes have varied in the different countries AMF has worked in (details on a separate page with additional details about AMF; this information may be outdated).
Monitoring
AMF's distribution partners also implement a set of monitoring activities to produce evidence on whether the registration and distribution processes operated as intended and on the long-term impact of the LLIN distribution. Monitoring activities have varied somewhat for different distributions, and AMF has added additional components over time.9 In general, AMF asks partners to conduct two types of monitoring: 1) process monitoring, whereby an independent partner funded by AMF monitors campaign planning and field activities to ensure they comply with processes required by AMF, and 2) post-distribution monitoring, whereby an independent partner funded by AMF surveys households after distribution.10 We have focused on reviewing the monitoring AMF has completed after distributions to understand what proportion of distributed LLINs reach their intended recipients, are used by those recipients, and remain effective while they are in use. See our discussion of AMF's post-distribution monitoring below. In addition, in 2017, GiveWell commissioned a project with IDinsight to better understand the survey methods used in several countries and to provide suggestions for AMF for the future. IDinsight's report with recommendations for the implementation of AMF's post-distribution monitoring is available here; AMF notes that its current monitoring procedures implement the majority of these recommendations.11
Research on insecticide resistance
AMF funded research on the effectiveness of PBO LLINs in conjunction with its Uganda 2017 distribution. PBO LLINs are a newer type of net incorporating piperonyl butoxide (PBO) alongside the pyrethroid insecticide used in other LLINs. These nets may be more effective than other LLINs in areas where mosquitoes have developed insecticide resistance. See more details about this research in this blog post. Published results can be found here.
Spending breakdown
The following table shows AMF's total expenditure, categorized into LLIN purchases, other non-net costs (e.g. costs related to distributing nets or conducting post-distribution monitoring), insecticide resistance research costs, and operational costs. We include spending since FY 2012 (July 2011 to June 2012) because this is when AMF shifted to its current model of larger-scale distributions.
| Category | July 2011 to June 2021 spending | Percentage of total spending, FY 2012 to 2021 |
|---|---|---|
| LLIN purchases | $268 million | 94% |
| Costs of distributing nets and monitoring ("non-net costs") | $9 million | 3% |
| Insecticide resistance research | $3 million | 1% |
| Salaries and other organizational costs | $3 million | 1% |
| Total spending | $284 million | - |
For most distributions, AMF pays for nets and monitoring activities; it partners with organizations—often the Global Fund to Fight AIDS, Tuberculosis, and Malaria or the U.S. President's Malaria Initiative—to pay for the other costs of the distribution.13 In the past, AMF also paid for electronic data entry for some paper-based distributions.14
Does it work?
This section was last updated in November 2020. The information that AMF has provided since that date is not yet reflected in this section.
We base our expectation of the impact of AMF's LLIN distributions on:
- the evidence of effectiveness of LLINs,
- characteristics of the populations targeted by AMF's distributions (including malaria incidence and mortality rates and pre-existing LLIN ownership), and
- evidence that AMF's LLINs reach their intended recipients, those recipients use the LLINs, and the LLINs remain effective while they are in use.
This expectation relies on the assumption that AMF's distributions increase the total number of LLINs distributed. To test whether this assumption holds up, we consider evidence about whether LLIN distributions would have occurred in AMF's absence.
Finally, we consider whether there are factors that are not accounted for in the above evidence that would offset or increase the impact of AMF's LLIN distributions, either through reducing their effectiveness or contributing to negative outcomes.
Are LLINs an effective intervention?
In a separate intervention report, we discuss the evidence for the impact of mass distributions of LLINs. We conclude that there is strong evidence from randomized controlled trials (RCTs) that these distributions can be expected to reduce malaria incidence and child mortality. We incorporate the effects measured by these RCTs into our cost-effectiveness model.15
Are AMF's distributions targeted such that they are likely to be effective?
Are LLINs targeted at areas with high rates of malaria?
The impact of LLINs is moderated by rates of malaria incidence and mortality where they are distributed; distributions that target populations affected by higher malaria rates are expected to have higher impact.
AMF appears to exclusively target countries with known malaria risk.16 Going forward, AMF told us that it plans to direct over two thirds of its funding to DRC, the country with the second highest number of malaria cases in the world,17 and where malaria is the leading cause of death.18
We use data on malaria incidence and mortality in the countries where AMF works in our cost-effectiveness model.19 We compare these data to malaria rates in the populations targeted in RCTs, then account for differences in these populations by adjusting the effects measured in RCTs to estimate the impact of LLINs on malaria rates in the countries where AMF works.
Are LLINs targeted at people who do not already have them?
Our expectation of AMF's impact relies on the assumption that AMF's distributions increase the number of people who own usable LLINs. We believe it is likely that AMF's distributions primarily result in people who would not otherwise have usable LLINs receiving them, though it may lead in some cases to households that already own nets receiving more nets than are needed. In our cost-effectiveness model, we make a downward adjustment to our estimate of AMF's impact to account for the possibility of pre-existing nets in recipients' homes.20 Key factors in this assessment include:
- The amount of time elapsed between distributions, as compared to our expectation of how quickly nets become worn out. Distributions are generally scheduled for every three years. Our best guess is that LLINs last, on average, between 2 and 2.5 years.21
- Data collected by AMF during post-distribution monitoring that includes a tally of AMF nets and non-AMF nets found during monitoring. The proportion of AMF nets found in households is often above 95% and is above 85% in all the data we have reviewed.22
- Whether people targeted by AMF's distributions would obtain nets from other sources in the absence of AMF's work. We do not have data on whether people targeted by AMF's distributions obtain nets from other sources; our impression is that mass distributions like those supported by AMF are the primary means by which people obtain nets.23
- AMF's process for allocating nets to households, which involves AMF's distribution partners visiting households and recording how many nets are needed based on the number of people or number of sleeping spaces in each house.24
AMF notes that it interprets the data from PDMs as indicating that LLINs should be replaced at least every three years, and that subtracting usable nets that a household already owns from the calculation of total net need (unless the nets have never been used) increases the period in which a household has to rely on old, ineffective nets until the next LLIN campaign.25 In past distributions in Malawi and DRC, AMF has allocated nets based on the number required per household minus the number of nets already owned by that household. As of June 2018, AMF no longer takes previously-owned nets into account.26
How do AMF's distributions impact LLIN ownership and usage over time? Do those LLINs remain effective over time?
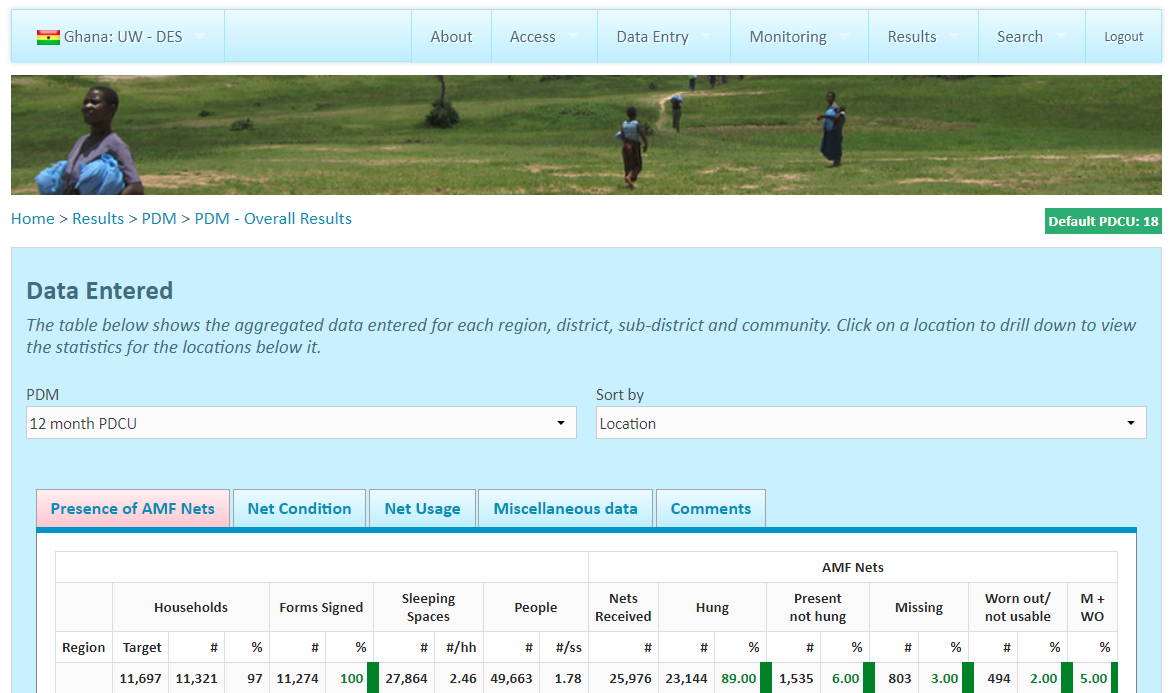
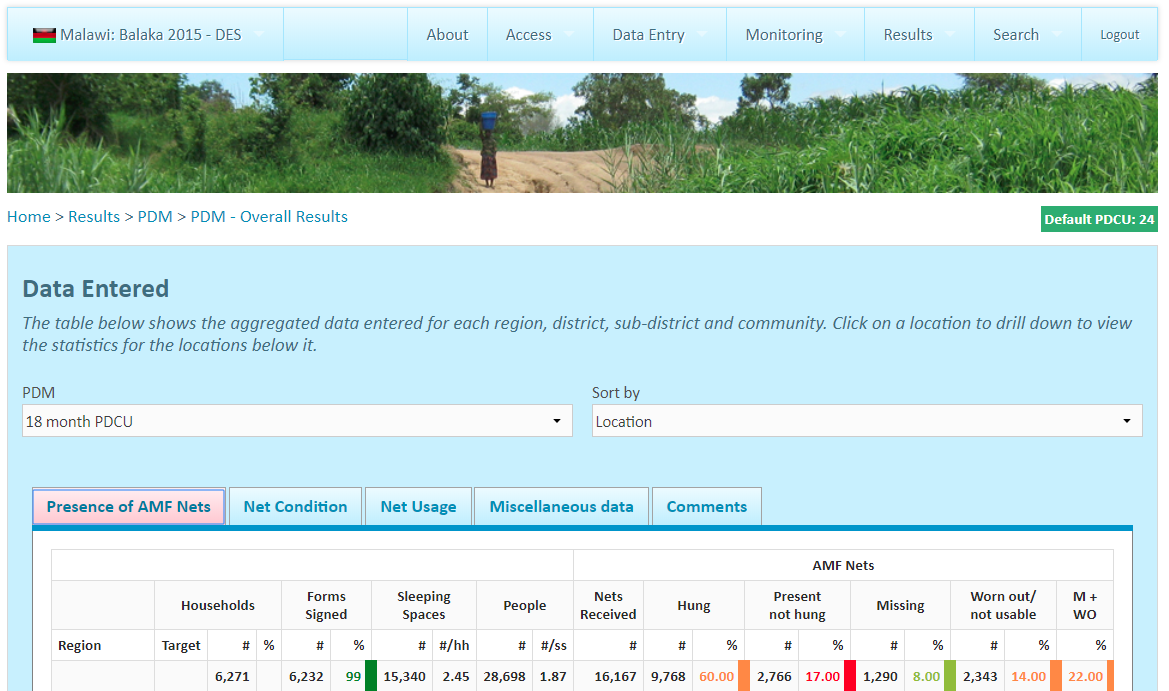
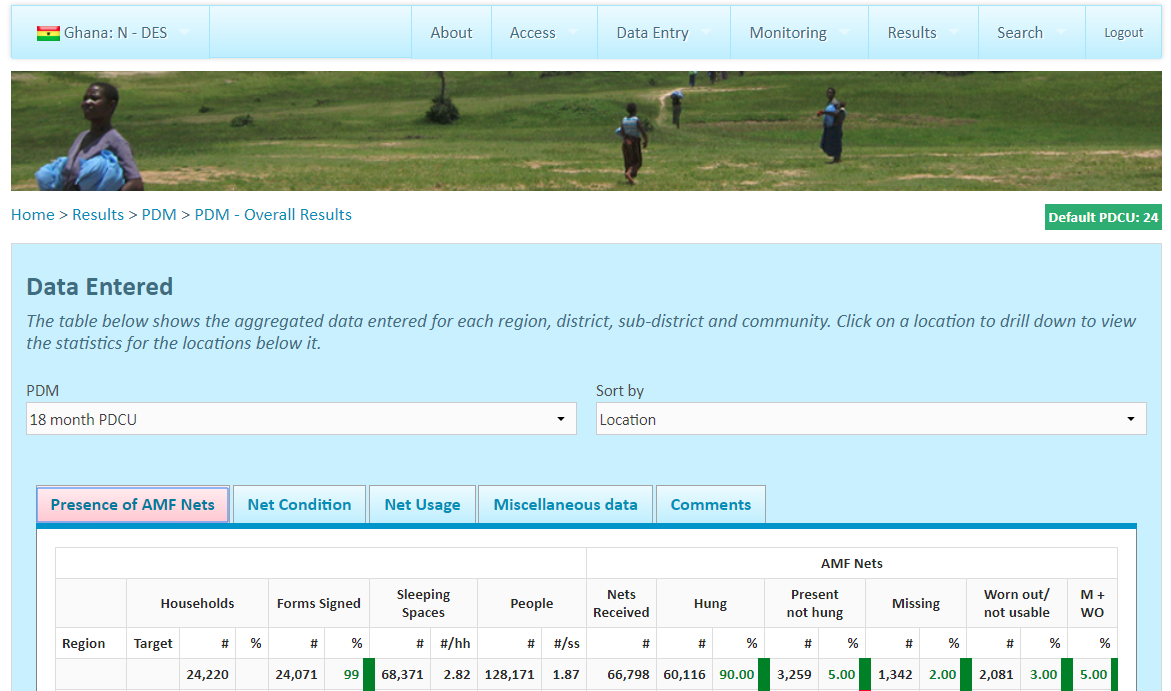
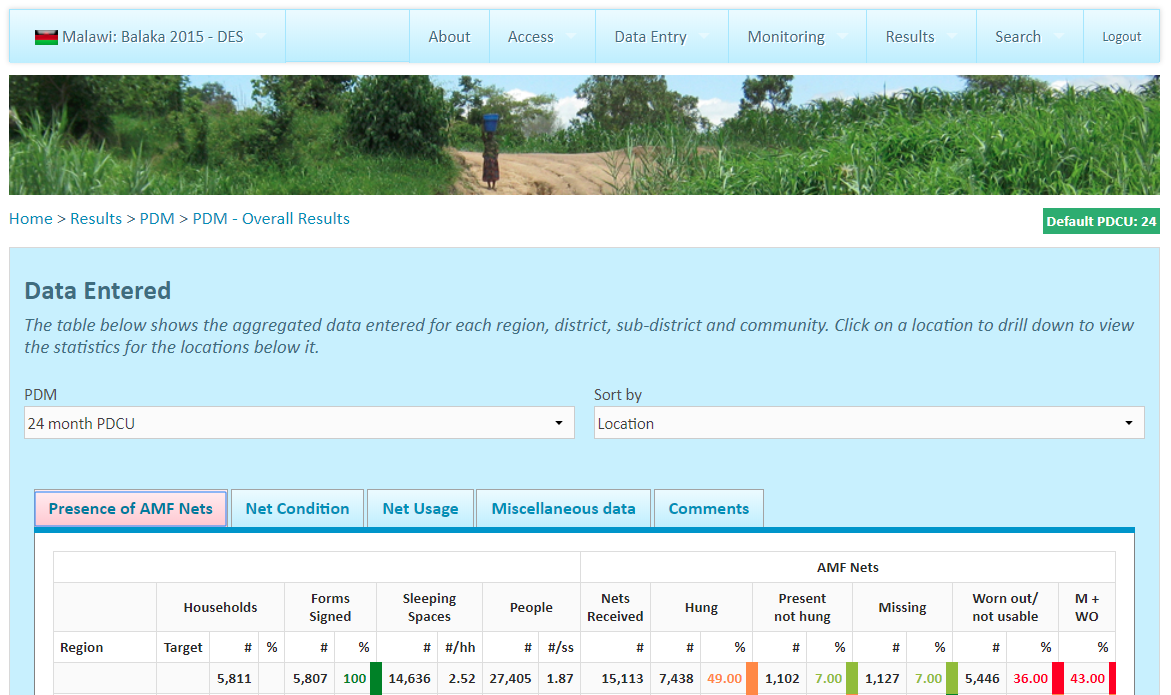
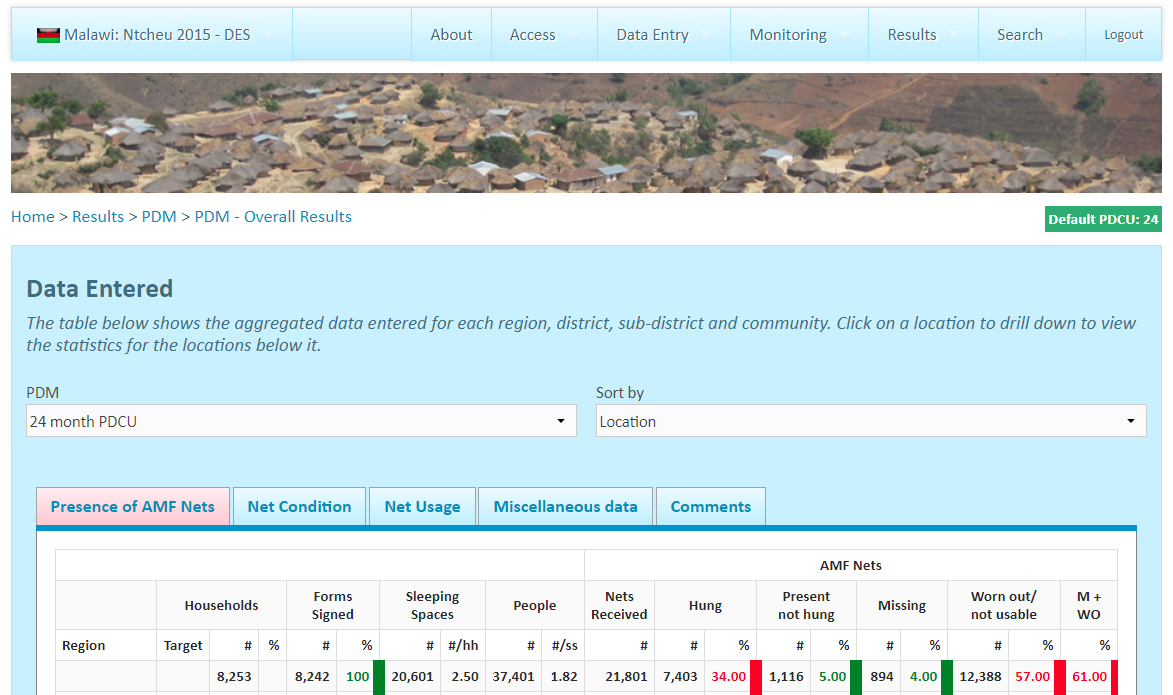
Through its PDMs, AMF collects data at several points in time after a distribution to understand what proportion of distributed LLINs reach their intended recipients, are used by those recipients, and remain effective while they are in use. We rely on results from past distributions to understand the impact we should expect future distributions to have. Our interpretation of these results is informed by their comprehensiveness and the methodology used to collect them. Overall, we believe that these results provide meaningful evidence that a reasonably high proportion of LLINs reach and are used by their intended recipients.
Comprehensiveness
See this spreadsheet for an overview of which PDMs have been completed since 2017. In short, we have seen results from 19 of the 22 large-scale distributions that occurred from 2017-202127 though some PDM rounds have been delayed by a few months.28 We are thus reasonably confident that we have seen a thorough picture of the impact of AMF's work; we incorporate this assessment into our cost-effectiveness model.29
Though AMF supported distributions prior to 2017,30 we focus our review on results from PDMs conducted for distributions from 2017 onward, as we believe they are more likely to be indicative of what we can expect from future distributions. These include distributions in DRC (2019, 2020, and 2021), Guinea (2019), Ghana (2018), Malawi (2018), Togo (2017 and 2020), Uganda (2017 and 2020), and Zambia (2017).31 PDMs have also been conducted for the 2017, 2018, and 201932 distributions in Papua New Guinea, but we have not reviewed them in depth.33 We have not seen PDMs for the other distributions AMF supported in 2021, where, as of this writing, distributions occurred too recently for results to be available.34
Methodology
AMF's PDMs survey households in the areas targeted by a distribution to assess the presence, usage, and condition of LLINs in those households. Typically, PDMs survey a 1.5% sample of households and occur every 9 months for a period of 27 months. We have focused on understanding the methodology used in the PDMs of AMF's recent distributions in DRC (Équateur province, 2019), Guinea (2019), Ghana (2018), Malawi (2018), Togo (2017), Uganda (2017), and Zambia (2017). Full details of those PDMs are in the "Methods" sheets of this spreadsheet.
We have not reviewed the methodology used for more recent distributions in DRC (2020 and 2021), Togo (2020), and Uganda (2020). The discussion that follows therefore does not apply to those distributions, though AMF has informed us that the methodology used for those more recent distributions has been largely similar.35
Below, we summarize AMF's general PDM methodology and discuss methodological strengths and weaknesses. Overall, we believe that AMF's PDMs are designed to measure the key indicators of the success of a distribution, and the fact that respondents are selected randomly and LLINs can be directly observed increases the credibility of the results. However, our confidence in the accuracy of these results is reduced by moderate to high sample attrition in several cases, the potential for respondent bias on self-reported measures, and only moderate correspondence in results found by AMF's auditing procedure.
- Respondent selection: AMF selects households to be surveyed during PDMs from the household-level data collected during registration. AMF randomly selects villages and households from all regions or districts that were covered by the distribution of AMF-funded nets. AMF also randomly selects "spare" households that can be visited if households on the original list are unavailable.36
AMF's inclusion of all regions or districts and its random sampling of villages and households increase the likelihood that the sample of households it selects is representative of the population that received LLINs. However, AMF's sampling procedure results in households from smaller villages being overrepresented in the sample because, in almost all cases, AMF selects the same number of households per village.37 Because AMF has data from registration on the total number of households per village, it is possible to correct for this overrepresentation. AMF has shared results from some PDMs that are weighted by village size; we have not reviewed these results in depth. Weighted results show slightly higher (1-5% across PDMs) proportions of LLINs found present and hanging in households compared with unweighted results.38 This suggests that AMF's sampling procedure results in a slight downward bias in results, at least for this outcome.
Another concern is that sample attrition (i.e. households randomly selected to be interviewed not being interviewed) may bias results upward, as households that cannot be interviewed during PDMs may also have been less likely to be reached by the distribution; see footnote for AMF's response to this concern.39 In PDMs in Malawi and Zambia, ~60-65% of households selected to be interviewed were interviewed, and in the Équateur province of DRC, 67% were interviewed; we believe these figures suggest a high risk of bias in results from those countries.40 In Guinea, Togo, and Uganda, these figures are ~75-85% of households selected to be interviewed, which we believe suggest a moderate risk of bias.41
- Survey design: AMF contracts with other organizations to implement PDMs ("PDM implementers"). AMF provides PDM implementers with a standard questionnaire,42
which AMF may adapt for each context. Data collectors are instructed to directly assess LLIN presence, hang-up, and condition by observing LLINs in respondents' homes. They also ask respondents to report the number of LLINs received by the household during the distribution, to report nets that are taken down during the day but hung at night, and to answer additional questions about LLIN usage during the previous night.
We believe that some of the responses collected through this survey are at relatively low risk of bias. The presence and condition of LLINs (both those found hanging and reported as taken down during the day but hung at night) are objective measures that data collectors can directly assess.43 However, self-reported responses are at greater risk of bias. Responses about LLIN hang-up and usage during the previous night may be at risk of social desirability bias that leads respondents to overreport usage, though validation of these responses is possible through comparison with objective measures.44 Responses about the number of LLINs received by the household report on an event that occurred at least 9 months prior and thus may be at risk of recall bias. AMF has shared results from some PDMs that replace self-reported responses with data on the number of nets that households were registered to receive; we have not reviewed these results in depth. Results using registered LLINs show slightly lower (2-8% across PDMs) proportions of LLINs found present and hanging in households compared with results using self-reported LLINs.45 The direction of these differences is consistent with our expectation that more LLINs are registered than are actually received by households, as net need at times outstrips the number of nets procured, leading to rationing in the distribution.46 The magnitude of this difference suggests that recall bias is not a major concern.
- Survey implementation: The PDM implementer recruits data collectors and supervisors to conduct and oversee data collection. With one exception,47
PDM implementer organizations were not involved in the distribution, which suggests that they are unlikely to have a personal interest in survey outcomes. In multiple cases, however, data collectors and/or supervisors hired by the PDM implementer to conduct the survey were involved in the distribution, though in the PDMs they are typically assigned to survey different areas than those in which they supported the distribution.48
These individuals may have a personal interest in survey outcomes reflecting favorably on the distribution, such that results are biased upward; we have not seen evidence that this incentive influenced data collection and note it only as a possibility.
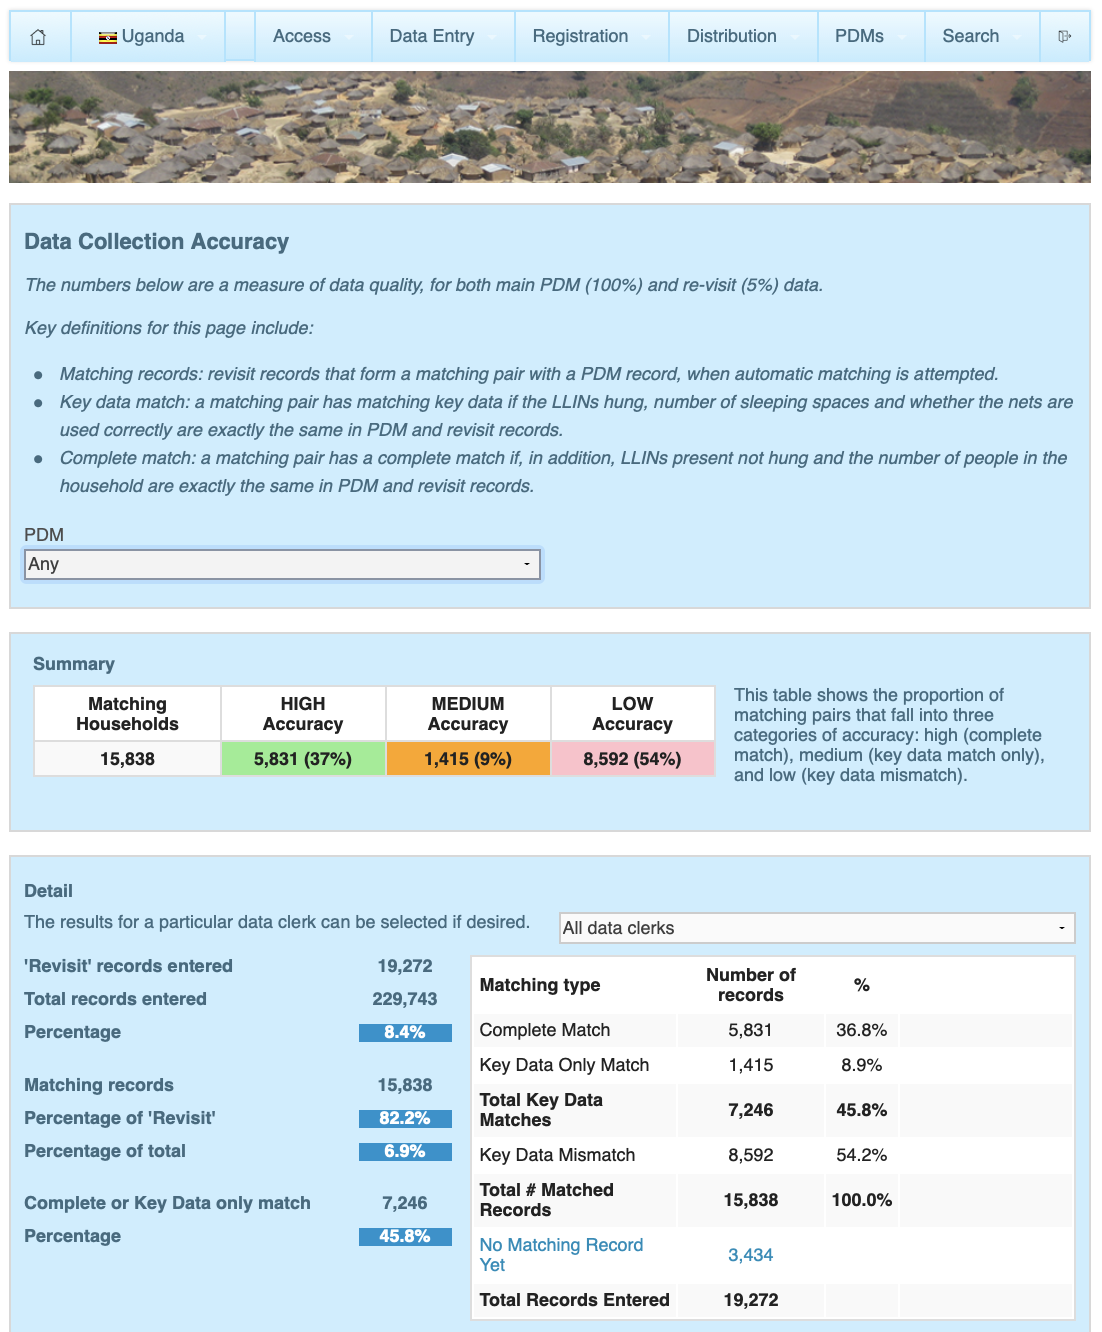
AMF selects 5% of surveyed households to be re-surveyed within one to seven days by a different data collector or supervisor who is blinded to the original results. Because data collectors are aware that their work will be audited, this procedure may encourage accurate data collection. It also provides a check on the accuracy of results. The first step in analyzing this data is to pair re-survey records with records from the original data collection using household identification numbers. Overall, AMF has paired around 85% of re-survey records with original records across all PDMs.49 AMF told us that records may not be paired for several reasons — most notably, because households that were unavailable for the original data collection may still be re-surveyed if their availability changes;50 we find this explanation reasonable.
The next step in analyzing this data is to check for correspondence between re-survey records and original records along several data points. We are particularly interested in correspondence levels for the number of LLINs that are present and hanging, which includes both LLINs found hanging by data collectors and LLINs that households report as being taken down during the day but hung at night. Across PDMs, exact correspondence on this number has ranged from 44%-85%. Correspondence within +/- 1 (meaning re-survey records find either the exact same number of nets hanging, one more, or one fewer) has ranged from 78%-92%.51 These correspondence rates are lower than we would have expected, given the seeming objectivity of this measure; they suggest that different data collectors may be assessing this measure differently, that households may be reporting differently on different days, or that these figures reflect a true change in net usage in a matter of days. Regardless of the explanation, these correspondence rates decrease our confidence in the accuracy of the original results. AMF notes that it considers these results acceptable according to its criteria.52
- Data capture: Data collection has been conducted on paper for PDMs for the Uganda (2017) and Zambia (2017) campaigns and conducted electronically for the other PDMs reviewed here.53 We do not know what proportion of data is eventually entered or uploaded into AMF's database, and it seems possible that some data may be lost or discarded;54 because we have data on the proportion of selected households that were actually interviewed, we do not see this as a significant additional concern.55 5-6% of paper-based data is re-entered by a different data entry clerk to check accuracy: the comparison of second entries with original entries has found rates of matching data above 95% in both Uganda and Zambia.56
In the following two sections, we summarize results from the PDMs we have reviewed. Note that these sections include results from PDMs whose methodology we have summarized here, along with results from DRC (2020 and 2021), Papua New Guinea (2017, 2018, and 2019), Togo (2020), and Uganda (2020). Overall, we believe that these results provide meaningful evidence that a reasonably high proportion of LLINs reach and are used by their intended recipients. We incorporate our assessment of the quality of AMF's monitoring methodology into our cost-effectiveness model57 and into our qualitative assessment of AMF's organizational strength.
What proportion of targeted recipients use LLINs over time?
We define LLIN coverage as the proportion of people living in households that were targeted by an AMF distribution who subsequently sleep under LLINs, thereby benefiting from the protective effect against malaria. To understand the coverage achieved by AMF's distributions, we use two types of PDM data: self-reported data from respondents about their usage of all LLINs found hanging in households, and data about the presence of AMF-distributed LLINs in households, from which we can infer usage.
During household interviews, PDM data collectors ask respondents to report their LLIN usage during the previous night by specifying how many people slept under each LLIN found hanging in the household, including AMF-distributed LLINs and LLINs from other sources.58
This data provides a "reported" coverage rate, defined as the proportion of people sleeping in the household the previous night who slept under any hanging net. See reported coverage rates for different countries and time points in this spreadsheet, sheet "Results: Summary." In short:
- Reported coverage is generally high 6-11 months post-distribution (i.e. as measured by that distribution's first PDM), varying from 72% (Malawi 2018) to 94% (DRC Kongo Central 2020).
- Reported coverage decreases over time. Across PDMs, average reported coverage is 83% between 6-11 months post-distribution and 60% between 24-30 months post-distribution. This matches our expectation that ownership of usable LLINs decreases over time from the point of distribution, as LLINs wear out.
- PDMs conducted after Zambia's 2017 campaign found relatively low coverage compared to other PDMs.59
During household interviews, PDM data collectors also ask respondents how many LLINs their household received from the relevant AMF distribution, then classify each reported AMF LLIN as either present and hanging (which includes both LLINs found hanging by data collectors and LLINs that households report as being taken down during the day but hung at night), present and not hanging, missing, or worn out.60 We use this data to calculate an "inferred" coverage rate representing the coverage provided by AMF-distributed LLINs found hanging. This measure captures a different outcome (coverage from all LLINs versus coverage from AMF-distributed LLINs). See inferred coverage rates for different countries and time points in this spreadsheet, sheet "Results: Summary." In short:
- Inferred coverage 6-11 months post-distribution (i.e. as measured by that distribution's first PDM) varies from 57% (DRC Haut Lomami 2020) to 83% (Uganda 2017).
- Like reported coverage, inferred coverage decreases over time, from an average of 68% between 6-11 months post-distribution to an average of 56% between 24-30 months post-distribution.
- In almost all cases, reported coverage from all LLINs is higher than inferred coverage from AMF-distributed LLINs, suggesting that households use LLINs from other sources in addition to AMF-distributed LLINs. The difference between reported coverage and inferred coverage remains fairly consistent across PDMs for the same distributions.
These two measures are subject to different potential sources of bias. On the one hand, reported coverage is a more direct measure that explicitly asks households how they use LLINs, but it may be subject to social desirability bias that leads respondents to overreport usage. On the other hand, inferred coverage is an indirect measure that relies on our assumptions about how households use LLINs, but it uses data that is at somewhat lower risk of bias. We see these data as providing cumulative evidence that, in general, a reasonably high proportion of targeted recipients sleep under LLINs over time.
How long after the distribution do AMF's LLINs remain effective?
Our expectation that LLIN coverage confers a protective effect against malaria requires that LLINs remain effective over time. To understand the effectiveness of AMF-distributed LLINs over time, we review LLIN condition data from AMF's PDMs. AMF reports on whether each net found in a household is either in "very good," "good," "viable," or "worn out" condition.61 See the proportion of hanging nets in at least "viable" condition for different countries and time points in this spreadsheet, sheet "Results: Summary." In short:
- Across countries, PDMs conducted between 6-11 months found an average of 89% of nets in at least "viable" condition. Uganda (2017) had the highest rate of viability at 99%, and DRC (Tanganyika province, 2020) had the lowest at 62% for the 6-11 month range.
- For the distributions that occurred between 2017 and 2021, we have seen results from eight PDMs conducted at 24-30 months post-distribution, which found lower rates of hanging nets in at least "viable" condition (an average of 65%).
- Across time, the average proportion of nets in at least "viable" condition decreases from 89% at 6-11 months to 82% at 12-17 months, 80% at 18-23 months, and 65% at 24-30 months. This matches our expectation that LLIN condition decreases over time from the point of distribution.
Do AMF's distributions increase the total number of LLINs distributed, or would mass distributions of LLINs have taken place in AMF's absence?
Our expectation of AMF's impact relies on the assumption that AMF's distributions increase the total number of LLINs distributed, compared to what would have happened in AMF's absence. The evidence we have seen suggests that donations to AMF increase the total number of LLINs distributed, but that a portion of the impact is offset by displacing funding from other sources. In our cost-effectiveness model, we make adjustments in our estimate of AMF's impact to account for the likelihood that AMF's funding is displacing funding from other sources.62 Key factors in this assessment include:
- On a separate page, we discuss some cases where AMF was in discussions to fund a distribution, but ultimately did not. In most of these cases, the LLIN funding gap AMF was in discussions to fill persisted for six or more months after AMF's discussions closed, and, in two out of the five cases we looked at, gaps persisted for long periods (18 months and ~3 years, respectively). In most cases, the gap was eventually filled by another funder. As far as we can tell, during the time between AMF withdrawing from discussions and another funder stepping in, the populations targeted for distributions did not receive nets and likely were inadequately protected from malaria.
- We also discuss, on a separate page, what we have been told about what would have happened in the absence of AMF funding in two distributions that AMF did fund. In summary, in both cases our best guess is that there were no other funders who could have closed the gaps, and nets would have been at least partially targeted at higher-risk populations while others would have been left uncovered.
- Across Africa, there are substantial funding gaps for LLINs (more below), and our impression from following AMF's progress over time is that, due to AMF's more limited funding and, perhaps, greater data requirements, governments often seek funding first from larger funders (particularly the Global Fund to Fight AIDS, Tuberculosis, and Malaria) and then may ask AMF to fill gaps. However, we note that this dynamic may change if AMF has significant resources in the future and that countries are able to choose how they allocate Global Fund grants among malaria interventions (including LLINs, treatment, and diagnosis), so the availability of funding for LLINs from AMF could cause countries to allocate fewer Global Fund resources to LLINs.63
Are there any negative or offsetting impacts?
In this section, we consider factors that are not accounted for in the above evidence that could offset the impact of AMF's LLIN distributions, either through reducing their effectiveness or contributing to negative outcomes.
- Will insecticide-treated nets continue to be effective? As discussed in our report on insecticide-treated nets, there is strong evidence for the effectiveness of this intervention; however, the best evidence for the intervention was collected before LLINs were widely used and there is some evidence that mosquitoes have since adapted to the insecticide used in LLINs, possibly making them less effective. We have reviewed the evidence on the state of insecticide resistance. We concluded, "Broadly, it seems that insecticide resistance is a larger concern now than it was when we last thoroughly evaluated the evidence in 2012, but it remains difficult to quantify the impact of resistance. Our very rough best guess (methodology described in more detail below) is that insecticide-treated nets (ITNs) are roughly one-third less effective on average across sub-Saharan Africa than they would be in the absence of insecticide resistance. ITNs remain a highly cost-effective intervention after incorporating this discount." We wrote here about recent evidence suggesting that piperonyl butoxide (PBO) nets give additional protection over standard LLINs in areas with insecticide resistance; we also use this recent evidence to inform our estimate of the effects of insecticide resistance in distributions of standard LLINs. AMF expects that a portion of the nets it funds in the future will be PBO nets.64 In our cost-effectiveness model, we make a downward adjustment in our estimate of AMF's impact to account for reduced LLIN efficacy due to insecticide resistance.65
- Do free LLIN distributions distort incentives for recipients or distort local markets for nets? As discussed in our report on insecticide-treated nets, we feel that there is a reasonably strong case for distributing LLINs freely rather than selling them at market (or even below-market) prices. We also think that the benefits of distributing LLINs freely to a population likely outweigh the negative consequences of distortion in local net markets, though we have not factored these potentially negative consequences into our cost-effectiveness analysis of AMF.
- Could distribution of LLINs be inequitable and unfair, causing problems in the targeted communities? We feel that AMF's processes for determining needs for LLINs at the household level are fairly well-suited to ensuring that LLINs are distributed equitably. We have some concerns about whether AMF's process succeeds at identifying all villages or households located outside of villages.
- Does AMF divert skilled labor from other areas? In Malawi, net distributions have been conducted by low-level government health staff in partnership with the staff of AMF's partner NGO.66 AMF's partner in Malawi told us in 2012 that government health staff are normally involved in activities such as disseminating health-related information, reporting on levels of stunting and disease, carrying out immunization campaigns, and providing nutrition support.67 We do not know the extent to which net distribution reduces their ability to complete other duties, though we note that net distributions are generally completed within a few days in each local area, and we would guess that LLIN distributions are likely among the most cost-effective work they engage in.68 Diversion of skilled labor may be more of a concern in DRC, where 22 senior district health staff were employed as Field Supervisors for the Kasaï-Occidental distribution.69 AMF's distributions in Ghana in 2016 were planned by high-level staff from a government health agency and implemented by local government staff and volunteers; monitoring of the distribution was largely implemented by a Ghanaian non-profit organization.70 We have not investigated what other activities the government and non-profit staff and volunteers engage in, or whether the LLIN distribution interferes with their ability to perform other duties.
What do you get for your dollar?
Cost per LLIN distributed
We estimate that on average the total cost to purchase, distribute, and follow up on the distribution of an AMF-funded LLIN is $5.19, based on information from AMF's programs between 2012 and 2020. Excluding in-kind government contributions, we estimate the cost is $4.89. Country-level cost per LLIN estimates are available in our cost-effectiveness analysis. These estimates rely on a number of uncertain assumptions.
In 2019, 2020, and 2022, we updated our analysis of AMF's cost per LLIN but did not publish updated versions of the spreadsheet with the data we used and our calculations because we have not received permission to publish country-specific cost estimates we received from the Global Fund to Fight AIDS, Tuberculosis, and Malaria, which our calculations rely on. We hope to receive permission to publish information on the Global Fund's costs in 2022. Our 2018 cost per LLIN spreadsheet is available here. In 2019, 2020, and 2022, we updated the data but used the same assumptions and analysis methods as in 2018.
Below, we also discuss how we estimate the cost per death averted in AMF distributions.
Our approach
To get the total costs of the program, we attempt to include all partners such that our cost per LLIN represents everything required to deliver the nets. In particular, in our cost per treatment analysis for AMF, we have included these categories in our overall estimate:
- The costs paid by AMF to purchase LLINs. This accounts for 43% of the total cost per LLIN.
- Costs of shipping and delivering nets, monitoring the distribution, and conducting PDMs. In most cases, the Global Fund or another partner pays for most of these costs; in almost every case, AMF has paid for the PDMs. These costs account for 49% of the total.
- Resources contributed by governments, such as staff time, office space, etc. We roughly estimate these costs as a proportion of the total cost (excluding LLIN purchase costs) based on an analysis of a distribution in Malawi in 2012. These costs account for 6% of the total.
- Other AMF costs: staff salaries and other organizational costs, a rough estimate of the value of the CEO's donated time and estimated value of other pro bono support, research AMF has funded on insecticide resistance, and costs of the Malaria Unit in Malawi. These costs account for 2% of the total.
We start with this total cost figure and apply adjustments in our cost-effectiveness analysis to account for cases where we believe the charity's funds have caused other actors to shift funds from a less cost-effective use to a more cost-effective use ("leverage") or from a more cost-effective use to a less cost-effective use ("funging").
We used data and estimates from completed distributions, ongoing distributions, and distributions that AMF has committed to funding in the future.
Shortcomings of our analysis
There are several ways in which our analysis of AMF's cost per LLIN is uncertain:
- LLIN prices have been falling over time, and in our estimate we have used a projected price per LLIN, rather than an average of the prices AMF has paid in the past. Based on what AMF told us it expects to pay in the future, we have used an estimate of $2.24 per LLIN in our 2022 cost per net analysis.
- For distribution costs not paid by AMF, we have generally used rough estimates.71
Cost per death averted
See our most recent cost-effectiveness model for estimates of the cost per death averted through AMF-funded LLIN distributions.
Note that our cost-effectiveness analyses are simplified models that do not take into account a number of factors. For example, our model does not include the short-term impact of non-fatal cases of malaria prevented on health or productivity, prevention of other mosquito-borne diseases, or reductions in health care costs due to LLINs reducing the number of cases of malaria. It also does not include possible offsetting impacts or other harms. We do include possible developmental impacts on children who sleep under an LLIN.72
There are limitations to this kind of cost-effectiveness analysis, and we believe that cost-effectiveness estimates such as these should not be taken literally, due to the significant uncertainty around them. We provide these estimates (a) for comparative purposes and (b) because working on them helps us ensure that we are thinking through as many of the relevant issues as possible.
The full details of our cost-effectiveness analysis are in our report on mass distribution of LLINs.
Is there room for more funding?
We conduct "room for more funding" analysis to understand what portion of AMF's ideal future budget it will be unable to support with the funding it has or should expect to have available. We may then choose to either make or recommend grants to support those unfunded activities. Our most recent analysis finds that AMF currently has $33.2 million in room for more funding—prior to receiving any grants that GiveWell specifically makes or recommends—to support its LLINs portfolio in 2023.
Room for more funding analysis
In general, we assess top charities' funding needs over a three-year period.73 We ask top charities to report their ideal budgets over the next three years, along with information about their current available funding and funding pipeline. The difference between a charity's three-year budget and the funding we project that it will have available to support that budget is the charity's "room for more funding."
The main components of our room for more funding analyses are:
- Available funding. We ask top charities to report how much funding they currently hold in the bank, including in reserves,74 and how much of this funding is committed or expected to be spent on specific future activities. The difference between these figures is the amount available to allocate to the charity's unfunded spending opportunities.
- Expected funding. We project the amount of additional funding that top charities will receive to support their work over the next three years. These projections represent our best guesses based on top charities' past revenue and our understanding of their funding pipelines. They typically include funding currently held by GiveWell to be granted to the top charity, projected funding due to being a GiveWell top charity,75 and, if the top charity is part of a larger organization, projected unrestricted funding from that parent organization. They exclude any funding we may specifically recommend to the top charity subsequent to the analysis. We add this projected funding to the amount available to allocate to the charity's unfunded spending opportunities.
- Spending opportunities. We ask top charities to report their ideal budgets in each of the next three years and to provide details on the specific spending opportunities included in these budgets. These opportunities are typically presented as one program year in a specific implementation geography (for example, an LLIN campaign in Nigeria in 2023), and they can represent either an extension of the top charity's previous support to a geography or an expansion of support to a new geography. We ask top charities to report the order in which they would prioritize funding these opportunities, which helps us to understand how available and expected funding will be allocated and what the marginal impact of additional funding beyond that amount would be.
A charity's room for more funding represents the total budget for the charity's spending opportunities, less its available and expected funding. For example, if a charity proposes spending $50 million over the next three years and holds $10 million in uncommitted funding, and we project that it will receive an additional $15 million in revenue over the next three years, that charity's room for more funding is $25 million. (Note that a charity's total room for more funding figure includes funding gaps at all levels of cost-effectiveness—see below.) Our most recent analysis of AMF's room for more funding can be found in this spreadsheet.
Grant investigation process
Room for more funding analysis is a key part of our grant investigation process. We periodically request the information described above from top charities and update our room for more funding analyses. Our default is to update each top charity's room for more funding analysis annually, though we may choose to do so more or less frequently. The cadence on which we conduct updates depends largely on how often we grant funding to a top charity76 and how much we expect that charity's funding and budgets to have changed since our most recent funding decision.77 We have typically updated our analysis of AMF's room for more funding on a quarterly basis, and have completed additional ad hoc updates prior to large grant decisions. Our most recent analysis of AMF's room for more funding can be found in this spreadsheet.
After completing such an update, we may then choose to investigate potential grants to support the spending opportunities that we do not expect to be funded with the charity's available and expected funding, which we refer to as "funding gaps." The principles we follow in deciding whether or not to fill a funding gap are described on this page.
The first of those principles is to put significant weight on our cost-effectiveness estimates. We use GiveDirectly's unconditional cash transfers as a benchmark for comparing the cost-effectiveness of different funding gaps, which we describe in multiples of "cash." Thus, if we estimate that a funding gap is "10x cash," this means we estimate it to be ten times as cost-effective as unconditional cash transfers. As of November 2021, we have typically funded opportunities that meet or exceed a relatively high bar: 8x cash, or eight (or more) times as cost-effective as GiveDirectly's unconditional cash transfers. (Note that a charity's total room for more funding figure includes funding gaps at all levels of cost-effectiveness.)
If we decide to fill a funding gap, we either make a grant from our Top Charities Fund78 or recommend that another funder—typically Open Philanthropy79 —makes a grant. This page lists all grants made or recommended by GiveWell. Typically, when GiveWell donors make a donation to a top charity,80 we don't expect that donation to be directed to a specific funding gap, but rather to contribute to supporting the overall portfolio of opportunities included within a charity's room for more funding.
AMF's room for more funding
Our most recent analysis of AMF's room for more funding can be found in this spreadsheet. In that analysis, we estimate that AMF has $33.2 million in room for more funding—prior to receiving any grants that GiveWell specifically makes or recommends—to support its LLINs portfolio in 2023. In sheet "RFMF projections," we present this figure broken down by funding gap.
We will consider making or recommending grants to fill each of these funding gaps. As of November 2021, we expect to have sufficient funding at our discretion to fill all funding gaps we identify among our top charities that meet our current cost-effectiveness bar of 8x cash or better; we also expect to fill some funding gaps in the 5-8x cash range (for more details, see this blog post). For GiveWell donors who want to support the highest-priority funding needs among our top charities, we recommend donating to the Top Charities Fund. (We updated the name of this fund in September 2022; more information here.)
AMF as an organization
We use qualitative assessments of our top charities to inform our funding recommendations. See this page for more information about this process and for our qualitative assessment of AMF as an organization.
Sources
- 1
See our Summary of AMF Distributions spreadsheet, sheet "Summary", section “AMF distributions by country."
- 2
This understanding is based on many conversations with AMF, and from following AMF's progress over time.
- 3
Rob Mather, AMF CEO, comment on a draft of this review, October 31, 2019.
- 4
This understanding is based on many conversations with AMF and its distribution partners, and from following AMF's progress over time.
- 5
- "This is a list of the countries with known gaps and where there are significant contiguous areas without nets, or a significant percentage required, and for which the estimate of need is believed to be reasonably accurate. It does not include countries where there are gaps, typically up to 40% of what the nation needs, but they are spread more uniformly across the country and would therefore require an ‘in-fill campaign’. An in-fill campaign is different from a so-called ‘universal coverage campaign’ because the percentage installed base of nets is higher in the former case and so a pre-distribution registration survey (PDRS) is an absolute requirement to ensure an efficient allocation of nets. Our methodology would lend itself to these campaigns if the relevant National Malaria Control Programme (NMCP) were to embrace a detailed PDRS. The list does not include, in our view, other countries where the need has not yet been quantified. Given there are many countries with needs estimated, we have not chosen to seek out other countries in need of nets. Our assumption is groups like AMP will be a source of reporting on additional countries as quantified needs emerge." Rob Mather, AMF Founder, email to GiveWell, August 8, 2012.
- In September 2015, we checked in with AMF about its process for determining in which countries it works. Rob Mather noted that AMF continues to review malaria prevalence data (where that data exists), although maintains a level of skepticism about that data given that it can be unreliable. Even so, AMF feels comfortable drawing conclusions about which countries have high malaria mortality burdens based on the data it sees and the conversations that it engages in. AMF checks the following sources to keep up-to-date on which countries have a significant malaria burden:
- The Alliance for Malaria Prevention, which sends out a weekly email with malaria-related data and information.
- The African Leaders Malaria Alliance (ALMA), which AMF has conversations with on a quarterly basis.
- In-country partners, who frequently attend malaria task force meetings and have recent news
- Members of malaria advisory groups
- Other connections
Before AMF decides to approach a country to offer funding for nets, it has many conversations to confirm the level of need that country has with the other actors that are working on malaria in the country. Rob Mather and Peter Sherratt, conversation with GiveWell, September 9, 2015
- In early 2016, AMF described a location-selection process similar to that described previously: "AMF learns about net gaps and receives funding requests through its network in the malaria control community, particularly through the Alliance for Malaria Prevention and the African Leaders Malaria Alliance." GiveWell's non-verbatim summary of a conversation with Rob Mather and Peter Sherratt, February 28, 2016
- 6
"As it becomes involved in larger distributions, AMF is receiving a growing number of funding requests. As its funding increases, AMF aims to make more strategic investments by engaging in the planning cycles of countries where it has strong connections and experience." GiveWell's non-verbatim summary of a conversation with Rob Mather and Peter Sherratt, February 28, 2016
- 7
For example, AMF supported distributions in Papua New Guinea in each year from 2017-2020 and in both Togo and Uganda in 2017 and 2020. See this spreadsheet, sheet "Detailed overview."
- 8
AMF told us that registration was previously carried out by AMF's distribution partners, but is now increasingly carried out by national health system staff. AMF's distribution partners continue to carry out monitoring of the registration process.
Rob Mather, AMF CEO, comment on a draft of this review, November 12, 2018.
- 9
We describe these processes (as of 2016) in more detail on our page with additional information on AMF.
- 10
AMF, comments on a draft of this page, October 2020.
- 11
AMF, comments on a draft of this page, October 2020.
- 12
For calculations, see this spreadsheet.
- 13
- Rob Mather, AMF CEO, comment on a draft of this review, October 31, 2019.
- "There was an exception to this between 2013 and 2015 in Malawi where AMF funded the $1.1 million costs of the distribution of 1.4 million nets in order not to miss a window of opportunity to distribute nets given no other funder could be found for the no-net costs and the rainy season was arriving that would make a net distribution difficult." Rob Mather, AMF CEO, comment on a draft of this review, October 31, 2019.
- See this spreadsheet, “(Added by GW) Detailed Overview” sheet, for details on what costs AMF has paid for each distribution.
- "The Ghana distribution is now going ahead: AMF is funding the costs of the nets and AMF’s additional monitoring costs, and the Global Fund will fund other non-net costs." Rob Mather and Peter Sherratt, conversation with GiveWell, February 11, 2016, pg. 2.
- "The non-net costs will be funded by the Ghana Malaria Global Fund Grant. These costs include those for shipping to Ghana, clearance, in-country transport, pre-distribution, distribution." AMF Ghana 2016 distribution agreement, pg. 1.
- "The non-net costs will be funded by the Uganda Ministry of Health which may use funding from its Roll Back Malaria Partners. These costs include those for shipping to Uganda, clearance, in-country transport, pre-distribution, and distribution." AMF Uganda 2016 distribution agreement, pg 2.
- "Post-Distribution Check-Ups… AMF will fund an NGO to run the process." AMF Uganda 2016 distribution agreement, pg 5.
- AMF Togo 2017 distribution agreement Redacted:
- "1) AMF will fund 2,413,250 LLINs.
2) The non-net costs will be funded by the MSPS which may use funding from The Global Fund or other sources." Pg 7. - "Post-Distribution Check-Ups (PDCUs) will take place across all of the districts to monitor net use and condition. The results will be owned by Togo and shared with AMF. AMF will fund an NGO to run the process in full consultation with the MSPS. The MSPS will facilitate the check-ups." Pg 10.
- "1) AMF will fund 2,413,250 LLINs.
- AMF Papua New Guinea 2017 distribution agreement Redacted:
- "1) AMF will fund 1,159,400 extra-large LLINs for distribution in 2017.
2) The costs, with the exception of the purchase of the LLINs, will be borne by RCPM which may use dedicated funding from The Global Fund and other sources." Pg 1. - "Post-Distribution Check-Ups (PDCUs) to assess correct net distribution, net use and condition of LLINs will take place across all of the districts to monitor net use and condition. The results will be owned by PNG but will be shared with AMF. AMF will fund a yet-to-be-decided NGO to run the process in full consultation with the NDoH and RCPM. RCPM will facilitate the check-ups." Pg 4.
- "1) AMF will fund 1,159,400 extra-large LLINs for distribution in 2017.
- 14
AMF, comments on a draft of this page, October 2020.
- 15
See the most recent version of the model here.
- 16
AMF lists the countries it has provided nets to at AMF Distribution by country. The Malaria Atlas Project has compiled data on malaria risk by location at Malaria Atlas Project, Explorer.
- 17
"Over 50% of all cases globally were accounted for by Nigeria (25%), followed by the Democratic Republic of the Congo (12%), Uganda (5%), and Côte d'Ivoire, Mozambique and Niger (4% each)." Pg. 6 of this report.
- 18
See section "What causes the most deaths?" of this page.
- 19
See the most recent version of the model here.
- 20
See the most recent version of the model here, "AMF" sheet, line "Pre-existing net adjustment."
- 21
- See this spreadsheet for an overview of the distributions AMF has supported.
- We estimate that an LLIN lasts on average 2.11 years. See this page for details.
- 22
See the "AMF vs. non-AMF nets" tab of this spreadsheet.
- 23
- We discuss the evidence for whether households purchase LLINs in the private market on this page. Note that this evidence is largely from before donors scaled up mass LLIN distributions, and it is possible that there is now more willingness to pay for LLINs given greater experience with the benefits of LLINs and/or, perhaps, lower cost of LLINs or higher incomes from economic growth. Our guess is that mass campaigns generally create the expectation of free LLINs and decrease households' willingness to purchase them.
- In the notes from our site visit to Ghana in 2016, we noted, "Everyone we talked to had previously owned bed nets before this distribution. Most had been procured through the area's last mass distribution four years ago, but some had been purchased or received from a clinic more recently." Pg 17.
- 24
Discussion of the registration process used in each country is on our page with additional, detailed information on AMF.
- 25
Comment provided in response to a draft of this page in November 2017.
- 26
Rob Mather, CEO, AMF, conversation with GiveWell, June 18, 2018.
- 27
- There were 22 large-scale distributions from 2017-2021; see here.
- We have seen results for 19 of these distributions: see this spreadsheet.
- We have not seen PDMs for the distribution in Papua New Guinea in 2020. We haven't asked AMF about this because we have chosen not to review PDMs from PNG in depth. See below for our reasoning.
- As of this writing in September 2022, the 9-month PDMs for the 2021 distributions in Ituri and Tshopo provinces of DRC were completed, but we have not yet seen results. See here.
- 28
Delays are noted in cell notes in this spreadsheet, sheet "Results: net presence," column "Survey period (months post-distribution)."
- 29
See the most recent version of the model here, "AMF" sheet, line "Misappropriation without monitoring results."
- 30
See this spreadsheet, sheet "Detailed overview," for a list of AMF-supported distributions from 2012-2021.
- 31
As of September 2022, we have seen the following results from each country:
- DRC (2019, 2020, and 2021). In DRC, distributions, and therefore PDMs, are conducted at the province level. Most scheduled PDMs have been completed. For 2019 campaigns, we have seen results from the 9- and 18-month PDMs in Équateur, and 9-month PDMs in Haut Katanga and Sud Ubangi. For 2020, we have seen results from the 9-month PDMs in Kongo-Central, Haut Lomani, Kinshasa, and Tanganyika. For 2021, we have seen the 9-month PDM from Haut Uele. As of this writing in September 2022, we have not yet seen results from the 9-month PDMs for the 2021 distributions in Ituri and Tshopo provinces of DRC that were completed in March and April 2022. See here.
- Guinea (2019): Scheduled PDMs have been completed. We have seen results from the 9-month, 18-month, and 27-month PDMs.
- Ghana (2018): Scheduled PDMs have been completed. We have seen results from the 9-month, 18-month, and 27-month PDMs.
- Malawi (2018): Scheduled PDMs have been completed. We have seen results from the 9-month, 18-month, and 27-month PDMs.
- Togo (2017 and 2020): In 2017, PDMs were delayed and were not conducted until 18 months post-distribution. See here. We have seen results from the 18-month and 24-month PDMs. For 2020, we have seen results from the 9-month PDM.
- Uganda (2017 and 2020): Scheduled PDMs have been completed. For 2017, we have seen results from the 6-month, 9-month, 12-month, 18-month, 24-month, and 30-month PDMs. For 2020, we have seen results from the 9-month PDM, but have not yet seen results from the remaining PDMs. See here for the status of the 18-month PDMs..
- Zambia (2017): We have seen results from the 12-month, 18-month, and 27-month PDMs.
- See here for a list of the PDMs we have seen, and see the cell notes for details on delays in scheduled PDMs.
- 32
As of August 2022, results from the 2019 Papua New Guinea PDM were still in progress; we have not followed up with AMF about this.
- 33
For the following reasons, we expect PDMs from Papua New Guinea to be less indicative of what we can expect from future distributions and have chosen not to review them in depth:
- The distributions AMF has supported in Papua New Guinea are relatively small compared to its other distributions. See this spreadsheet, sheet "Detailed overview," column "Number of nets."
- AMF did not support a distribution in Papua New Guinea in 2021. AMF, "Net distributions - Papua New Guinea," 2021
We include results from these PDMs in this spreadsheet but exclude their methodology.
- 34
See this spreadsheet, sheet "Detailed overview," for a list of the distributions AMF supported in 2021. We have not seen results for the distributions in Ituri and Tshopo provinces of DRC that occurred in June/July 2021.
- 35
AMF, Comments on a draft of this page, June 2022 (unpublished).
- 36 AMF noted that these spare households are selected randomly. AMF, Comments on a draft of this page, June 2022 (unpublished).
- 37
See cell C4 on each of the "Methods" sheets in this spreadsheet. While smaller villages are overrepresented, the smallest villages are excluded from the sample: AMF excludes from selection any villages with fewer than a threshold number of households. In practice, this has led ~5% or less of households to be excluded from the sample in all countries except Togo, where 9.8% of households were excluded from the sample.
- 38
See this spreadsheet, sheet "Source: Allocated vs Distributed + Weightings," cells K10-19. We have not yet incorporated this analysis into this review, which reports unweighted results.
- 39
"Below we have shared a summary of our thinking about why households may not be interviewed, and how that relates to the likelihood that the household received nets at a distribution point.
Households not available for PDMs for the following reasons would not be systematically more or less likely to have been reached by the distribution:
- Those that have moved or cannot be located in the village
- Those that are away visiting family
- Those at the market/ making social visits
Households not available for PDMs for the following reasons may be less likely to have been reached, with caveats:
- Those where HH members were at work during the day. If all HH members work every day, it may be that nobody was able to go to the distribution point to collect nets. However, NMCDs usually ensure that distribution points are open for multiple days, and early/late, to mitigate against this risk.
- Those where the only HH member has passed away. If the sole household member was elderly, it is possible that s/he was less likely to have travelled to the distribution point to collect a net.
If for any reason a particular village was less likely to be reached by the distribution (e.g. too far from the distribution point, or did not receive word about the date), then we would expect to see evidence of this in the households that we were able to survey." AMF, comments on a draft of this page, October 2020.
- 40
- See cell D6 on each of the "Methods" sheets in this spreadsheet.
- An Ebola outbreak occurred at the time of the PDM in the Équateur province of DRC, which lowered the completion rate of surveys:
"AMF’s partners worked closely with the provincial health teams to identify which villages needed to be excluded from the survey so as to not put field staff at risk. 40 villages were excluded due to Ebola. Removing these villages, the completion rate was 79% (5,612 HHs reached out of smaller sample of 7,140, with 5.8% of household interviewed were spares, resulting in 74% of selected households in non excluded villages interviewed." AMF, comments on a draft of this page, June 2022 (unpublished).
- 41See cell D6 on each of the "Methods" sheets in this spreadsheet.
- 42
See example here: AMF, PDM data collection form, Uganda.
- 43
AMF told us that data collectors are instructed to directly observe and assess the condition of all LLINs that are present and hanging, which includes both LLINs found hanging by data collectors and LLINs that households report as being taken down during the day but hung at night. Against Malaria Foundation, conversation with GiveWell, August 6, 2020 (unpublished).
- 44
"For our recent PDMs where data is collected electronically we have put in place data validation to mitigate against this. We ask partners to validate the information in Question 4 (self-reported responses about hang-up) with the objective measures from Question 3 (LLINs found hanging and or in use at night)." AMF, comments on a draft of this page, October 2020.
- 45
For example: "This difference occurs as households report fewer nets received than registered (e.g. 20 nets hung divided by 25 self-reported nets = 80%, versus 20 nets hung divided by 26 registered nets = 77%." AMF, comments on a draft of this page, October 2020.
AMF uses self-reported nets received as the denominator in its net presence results (see this spreadsheet, sheet "Results: Net presence"). Because AMF has data on the number of nets that households were registered to receive, it is possible to replace the self-reported figures with registration data. See this spreadsheet, sheet "Source: Allocated vs Distributed + Weightings," cells D10-D19. We have not yet incorporated this analysis into this review, which reports results that use self-reported nets as their denominator.
Separately, AMF has compared distribution data on LLINs received and self-reported PDM data on LLINs received. It found that across countries, the proportion of household records that agreed on this figure was 48% at 6 months and decreased to 37% at 30 months. Other findings included: "1. The % of households that report a number of nets within +/-1 of the number recorded during distribution is >70% at all time points. 2. The % of households that report the same number of nets as recorded in the distribution data reduces over time. 3. The % of households that report fewer nets received than the distribution data indicates increases over time." Against Malaria Foundation, responses to GiveWell questions, May 15, 2020 (unpublished).
- 46
AMF, comments on a draft of this page, October 2020 (unpublished).
- 47
For the 2017 distribution in Togo, the PDM implementer was a branch of Togo's Ministry of Health and was involved in the distribution. See this spreadsheet, sheet "Methods: Togo (2017)," cell C10 for the PDM implementer, and this spreadsheet, sheet "Detailed overview," column "Distribution Partner," for the distribution partner. NMCP (National Malaria Control Program) and PNLP (Programme National de Lutte contre le Paludisme) are both acronyms referring to countries' national malaria control programs.
- 48
The cases are Malawi 2018, Uganda 2017, and Zambia 2017. See cell C10 on each of the "Methods" sheets for those countries in this spreadsheet.
- 49
See cell C9 on each of the "Methods" sheets in this spreadsheet. About 80% of records were paired for DRC (Équateur), Zambia, Uganda, Togo, and Malawi, and 90-95% were paired for Ghana and Guinea. We have summarized this as roughly 85% overall.
- 50
"The most common reason, accounting for ~2/3 of instances where we cannot match a re-visit record, is that the household was on the list for both main and re-visit surveys but was only surveyed for the re-visit.
This can occur if a household is unavailable on the day of the main data collection, prompting the use of a spare, but available during the re-visit. In this scenario, there is a re-visit record but no main record to match.
To maximise the number of matching pairs, we could select the re-visit households from the main households surveyed, rather than the main households selected for the household lists. However, to do this we would have to receive, import and select re-visit households in a narrow window of time between main and re-visit data collection. Given the AMF time that would be required and the importance of prompt re-visit data collection, we decided that it would not be practical to make this part of our methodology." Against Malaria Foundation, responses to GiveWell questions, June 23, 2020 (unpublished).
AMF has also provided other reasons that records may not be paired: "Other reasons that account for the remaining ~1/3 of re-visit records that cannot be matched are:
- Household ID recorded incorrectly: Where IDs are entered by data collectors/ clerks, an element of human error will mean there are instances where the main or re-visit ID is incorrect and therefore cannot be matched.
- Duplicate household IDs: Errors can have knock-on effects if they lead to multiple main households with the same ID within a village. Any re-visit record with this ID will remain unmatched, as there is no way to automatically determine which main household should be used for a matching pair.
- Data entered and imported to the wrong part of the DES: As mentioned in our discussions about registration data and matching, our standard code only matches households within a village, so any main or re-visit data entered/imported into the wrong part of the DES will inhibit matching. However, this situation is less likely during PDMs as the locations are exported initially from the DES.
- Data erroneously entered and imported as re-visit records: For Malawi PDM-09, main records were erroneously entered and imported as re-visit records, and as these households were only visited once, the code could not find a matching pair in the main data. These data have are being reimported and the error corrected. See next question for more details.
For electronic data collection, household lists are uploaded directly to the data collection tool, minimising the chance of reasons 3 and 4 occurring." Against Malaria Foundation, responses to GiveWell questions, June 23, 2020 (unpublished).
- 51
See cell C9 on each of the "Methods" sheets in this spreadsheet.
- 52
AMF, Comments on a draft of this page, June 2022 (unpublished). - 53
See cell C13 on each of the "Methods" sheets in this spreadsheet.
- 54
In 2017, GiveWell supported an assessment of AMF's monitoring by IDinsight. In the course of this assessment, IDinsight observed "Incomplete or inconsistent forms were being discarded in Ghana during data entry with no clear record of why" and recommended "AMF should require country partners to mandate that supervisors frequently collect all PDM forms, regardless of completion. All complete forms should be entered into the DES." IDinsight, Recommendations for Post Distribution Monitoring Implementation, pg. 7.
AMF told us that since this assessment, it has started to require that supervisors collect PDM forms or electronic data collection devices at least twice a week: "Requirement to collect all PDM forms daily or twice a week added to SO...For electronic data collection, supervisors collect the devices in order to submit the data." AMF, Implementation of IDinsight recommendations, 2020, pg. 1. Our understanding is that in general, supervisors review data for errors and may correct smaller errors or instruct data collectors to re-do household interviews if major errors are found. We do not know the details of these procedures or how often errors are found. Our understanding is that household interviews are re-done very rarely. See cell C13 on each of the "Methods" sheets in this spreadsheet.
- 55
In other words, we expect both 1) households randomly selected to be interviewed but not interviewed and 2) households that were interviewed but whose data was lost or discarded to be captured in the sample attrition data we report above.
- 56
See cell C14 on the "Methods" sheets for Uganda and Zambia in this spreadsheet.
- 57
See the most recent version of the model here, line "False monitoring results."
- 58
- "Please complete the following table for all nets found hanging in the household...How many slept under this net last night?" AMF, PDM data collection form, Uganda.
- "Households will also have other nets, for example received through routine distribution, which may be used to cover people at night but will not be counted in the presence tables...Information about these nets is captured in Question 3 on our PDM form and is used to calculate our reported sleeping space coverage and people coverage." Against Malaria Foundation, responses to GiveWell questions, June 23, 2020 (unpublished).
- Since sharing AMF, PDM data collection form, Uganda, AMF has updated its method for calculating coverage rates. It now removes data abnormalities and uses as a denominator the number of people who slept in the household the previous night, rather than regular household members. AMF, Email to GiveWell, April 22, 2022 (unpublished).
- 59
See here. AMF told us that the Zambia distribution had insufficient LLINs, and thus the number of LLINs that could be distributed to households was capped (Against Malaria Foundation, conversation with GiveWell, November 20, 2019 [unpublished]). If households did not receive enough LLINs to cover all sleeping spaces, this may have contributed to the relatively low coverage rate measured in Zambia.
- 60
- See question 4 in AMF, PDM data collection form, Uganda.
- See full results in this spreadsheet, sheet "Results: Net presence."
- Other potential sources of evidence for LLIN presence are AMF's household-level registration and distribution data. As described above, registration data shows the number of LLINs that were allocated to each household during a pre-distribution household census, while distribution data shows the number of LLINs actually distributed to each household during the distribution. AMF has collected both types of data for all large-scale distributions it has supported. To date, we have preferred to use PDM evidence to understand AMF's impact, as we believe that the informativeness of AMF's registration and distribution data is limited. This is because:
- Registration data captures LLINs allocated, rather than LLINs received. It thus provides only indirect evidence for LLIN ownership.
- Distribution data provides direct evidence for LLIN ownership, but unlike PDMs, it captures only one point in time. Additionally, AMF told us that it has fewer procedures in place to ensure high quality in distribution data than it does for registration data and PDM data (Against Malaria Foundation, conversation with GiveWell, June 4, 2020 [unpublished]). We are thus less confident in the reliability of this data.
- 61
See this spreadsheet, sheet "Results: Net condition."
- 62
See the most recent version of the model here, section "Leverage/Funging adjustment."
- 63
This is an understanding formed over many conversations.
- 64
Rob Mather and Peter Sherratt, AMF Founder and Executive Chairman, conversation with GiveWell, June 18, 2018
- 65
See the most recent version of the model here, line "Efficacy reduction due to insecticide resistance."
- 66
"Health Surveillance Assistants (HSAs) are Government extension workers- they are the lowest tier of government presence in the decentralized health system." Robin Todd, Concern Universal Malawi Director, email to GiveWell, April 27, 2012.
- 67
"As such they are the first line of response to any public health issues in communities. Their job involves disseminating health related information (such as encouraging people to make use of sanitary facilities, go for immunizations, sleep under mosquito nets etc.), carrying out sanitation and hygiene campaigns and sending data on take-up of facilities to the District Council, conducting basic nutrition support, weighing children and reporting levels of stunting and wasting, detecting common communicable diseases and reporting these to clinicians and other health providers, implementing immunization campaigns etc. As you can see being involved in universal net distribution fits very well with their core public health responsibilities. HSAs need to have a primary school completion certificate as a minimum but the majority of them will have O-Levels (exams sat by pupils aged 16 if they have completed the school system at the recommended pace). Once they have been selected as HSAs they are sent on an initial 9 months intensive training course where they will be trained in many aspects of public health including how to recognize common diseases, how to administer immunizations etc." Robin Todd, Concern Universal Malawi Director, email to GiveWell, April 27, 2012.
- 68
- Pre-distribution registration surveys appear to be completed relatively quickly: "Approximately 480 personnel will be involved in the PDRS, with the majority, some 460, involved for 5-7 days over the data collection period." Concern Universal, Dowa 2015 planning document, pg. 4.
- In the Ntcheu 2012 distribution, the verification of PDRS data took several weeks: "The verification process took the verification team of 10 members 18 days to complete and in a day 20 clusters were verified with 10 verification sites in the morning and 10 verification sites in the afternoon." Concern Universal Ntcheu 2012 distribution report, pg. 7.
- In the Ntcheu 2012 distribution, distributions were scheduled for several weeks, but covered approximately 10 "clusters" per day: "The distributions were scheduled to have been concluded within 28 days with the team distributing at 10 clusters per day covering five weeks." Concern Universal Ntcheu 2012 distribution report, pgs. 7-8.
- United Purpose has recently started to use fewer staff for post-distribution check ups, which causes them to take somewhat longer: "However, in collaboration with the District Environmental Health Office (DEHO) and Malaria Coordinator (MC) and lessons lea[r]nt from 24 month Ntcheu PDCU, it was recommended to have a focused team of 10 data collectors rather than have the HSAs as data collectors from each HCA. This was based on the following reasons. First, this would reduce the number of data collectors that would need to be monitored and trained. Second, we would be able to select reliable individuals whom we could trust to do a diligent and accurate job of collecting the data. Third, it would leave the majority of HSAs to carry on with the normal health tasks and duties. Fourth, by having the same people covering the whole exercise they will get acquainted to the task and reduce errors on data collection. This meant the data collectors would spend thirty seven days collecting data rather than the one or several days if many more data collectors were to be used. This was judged the preferable way of organising and managing the data collection phase." Concern Universal Ntcheu 2012 33-month post-distribution check-up report, Pg 5. Other recent post-distribution monitoring reports have similar language.
- 69
"i) Field Supervisors (FSs)
22 FSs were selected from permanent and senior health staff in Tshikapa Health District.
ii) Community Health Workers (CHWs) – data collectors
Each of the 22 FSs had the responsibility of recruiting, in each HA they were designated, enough CHWs to gather household data and hang nets. Two primary recruitment criteria were literacy and familiarity with using a mobile phone. The number of CHWs recruited depended on the size of the HA and the number of households to be visited. The aim was to recruit enough CHWs to carry out the entire registration and hang‐up, once it commenced, in a five day period. Between 20 and 40 CHWs were recruited by each FS for a total of 4,000 CHWs across the 8 HZs (8 HZs x 20 HAs x 25 CHWs per HA = 4,000 CHWs)." IMA World Health, Kasaï-Occidental 2014 distribution report, pg. 13. - 70
- "In the present distribution, core responsibilities of Episcopal Relief & Development and ADDRO include:
- Monitoring the NMCP-led pre-distribution and distribution activities, and providing feedback to the NMCP. NMCP also does its own monitoring.
- Post-distribution monitoring." Pg. 4.
- "Phase 1 – Planning and registration
The registration phase was implemented by the government and is now complete in all three regions.
Step 1 – Informative Meetings with Ghana Health Service Regional Health Directorates
At these meetings, stakeholders discuss the LLIN distribution implementation model, the schedule of activities, and budgets. Stakeholders also agree on a date for the regional planning workshop.
Step 2 – Regional planning workshops
At these workshops, stakeholders discuss the registration and distribution processes, budgets, rules, and responsibilities for different groups. In the Greater Accra regional planning workshop, the stakeholders also discussed which households to target (in other regions, all households were targeted)." Pg. 4. - "GHS volunteers carry out the registration process, which takes place more than one month before the distribution. Volunteers are organized by the Ministry of Health (MoH) and participate in a number of government health programs, such as vaccination campaigns (immunization days)." Pg. 5.
- " Steps in the distribution process
1. Beneficiaries walk a short distance to their distribution point. One staff member employed by GHS and at least one GHS volunteer are stationed at each distribution point; there are never just two GHS volunteers." Pg. 8.
- "In the present distribution, core responsibilities of Episcopal Relief & Development and ADDRO include:
- 71
- Our estimate of the value of in-kind government contributions for all AMF distributions is based on an analysis of a single distribution in Malawi in 2012. See cell B34 on the "Summary" sheet of our 2018 cost per net analysis here.
- Our estimate of the Global Fund and other philanthropic funders’ non-net costs per net relies on a variety of different sources which we have not received permission to publish:
- In our 2018 cost per net analysis, we published a weighted average of the Global Fund and other philanthropic funders’ non-net costs per net (without publishing information on country-level costs). See cell B33 on the "Summary" sheet of our 2018 cost per net analysis here.
- In 2019, 2020, and 2022 we decided to prioritize publishing country-level cost per net estimates in our cost-effectiveness analysis (CEA) over publishing an updated version of our cost per net spreadsheet. We made this decision in order to be able to report country-level cost-effectiveness estimates in our public CEA without revealing information from the Global Fund which we do not have permission to publish.
- 72
See our most recent model, "AMF" and "Results" sheets.
- 73
For a discussion of why we consider funding a charity's work up to three years in the future, see this blog post.
- 74
Some of our top charities have a policy of holding funding reserves. In our room for more funding analyses, we typically include reserved funding as funding available to support program activities. We do this both to ensure consistency across top charities (as not all top charities hold reserves) and to understand the true effect of granting additional funding (i.e. whether additional funding would support undertaking additional program activities versus building or maintaining reserves).
- 75
GiveWell maintains a list of all charities that meet our criteria, along with a recommendation to donate to our Top Charities Fund (we updated the name of this fund in September 2022; more information here). Some donors give based on our top charity list but do not follow our donation recommendation. In our projections of future funding, we typically count only one year of funding that an organization receives as a result of being on our list of top charities in order to retain the flexibility to change our recommendations in future years.
- 76
We update a top charity's room for more funding analysis more frequently if we grant funding to it more frequently.
- 77
We update a top charity's room for more funding analysis more frequently if we have reason to believe that its funding and budgets have changed substantially.
- 78
For a list of grants we have made from our Top Charities Fund, see this page, section "Past recipients of the Top Charities Fund." (We updated the name of this fund in September 2022; more information here.)
- 79
Open Philanthropy, a philanthropic organization with which we work closely, is the largest single funder of our top charities. The vast majority of Open Philanthropy's current giving comes from Good Ventures. We make recommendations to Open Philanthropy each year for how much funding to provide to our top charities and how to allocate that funding among them. An example of these recommendations from November 2020 can be found on this page.
- 80
This includes donations made to charities on our checkout page, donations made directly to the organizations, and donations through other third-party organizations that share GiveWell’s recommendations (e.g., One for the World).