We have published a more recent review of this organization. See our most recent report on the Against Malaria Foundation.
The Against Malaria Foundation (AMF) is one of our top-rated charities and we believe that it offers donors an outstanding opportunity to accomplish good with their donations.
More information: What is our evaluation process?
Published: November 2018
Summary
What do they do? AMF (againstmalaria.com) provides funding for long-lasting insecticide-treated net (LLIN) distributions (for protection against malaria) in developing countries.
Does it work? There is strong evidence that distributing LLINs reduces child mortality and malaria cases. AMF conducts post-distribution surveys of completed distributions to determine whether LLINs have reached their intended destinations and how long they remain in good condition. AMF's post-distribution surveys have generally found positive results, with some exceptions, but have some methodological limitations and surveys in several recent distributions have been delayed.
What do you get for your dollar? We estimate that the cost to purchase and distribute an AMF-funded net is $4.53, or $4.29 excluding in-kind contributions from governments. The numbers of deaths averted and other benefits of distributing LLINs are a function of a number of difficult-to-estimate factors, which we discuss in detail below.
Is there room for more funding? We believe that AMF is likely to be constrained by funding. There is a high degree of uncertainty in the maximum amount that AMF could use productively, but given a) its track record of finding and filling funding gaps for LLINs (spending on the order of $20-30 million per year over the past few years), b) our expectation that it will receive approximately $10.9 million over the next three years, and c) the large size of the global funding gap for LLINs (estimated to be in the hundreds of millions of dollars over three years), we expect the maximum that AMF could absorb to be significantly greater than what AMF is likely to receive. Update: In November 2018, we recommended that Good Ventures grant $2.5 million to AMF; due to the large amount of uncertainty regarding our estimate of AMF's room for more funding, this grant recommendation does not significantly impact our estimate.
AMF is recommended because of its:
- Focus on a program with excellent evidence of effectiveness and cost-effectiveness.
- Processes for ensuring that nets reach their intended recipients and monitoring whether they remain in homes and in good condition over the long-term.
- Room for more funding – we believe AMF will be able to use additional funds to deliver additional nets.
- Transparency – AMF shares significant information about its work with us and we are able to closely follow and understand its work.
Major open questions:
- We have seen detailed data from before and during distributions. AMF also collects follow-up data after distributions. These follow-up surveys are conducted by AMF's various partner organizations and there has been variation in quality across locations. We also have not yet seen follow-up surveys from AMF's newer countries of operation. GiveWell has commissioned an ongoing project with IDinsight to better understand the survey methods used in several countries and to provide suggestions for AMF for the future. IDinsight's report with recommendations for the implementation of AMF's post-distribution monitoring is available here.
- The best evidence for nets was collected before they were widely used, and there is some evidence that mosquitoes have since adapted to the insecticide used in nets, possibly making them less effective. It seems that insecticide resistance is a growing concern, but it remains difficult to quantify the impact of resistance. We will continue to follow several ongoing studies that may help to quantify the impact of resistance. We discuss this issue in more detail in our page on this topic.
Table of Contents
- Summary
- Our review process
- What do they do?
-
Does it work?
- Are LLINs targeted at people who do not already have them?
- Do LLINs reach their intended destinations?
- Are LLINs targeted at areas with high rates of malaria?
- Do those who receive the LLINs install them in their homes properly? Do those who receive the LLINs utilize them consistently over the long term?
- Do AMF's LLINs increase the total number of LLINs distributed, or would the recipients have received LLINs from other sources if not for AMF?
- Are there any negative or offsetting impacts?
- What do you get for your dollar?
- Is there room for more funding?
- AMF as an organization
- Sources
Our review process
We began reviewing AMF in 2009. Our review process has consisted of:
- Reviewing documents AMF made available on its website or shared with us directly.
- Extensive communication, including several meetings at AMF's London headquarters, with AMF Founder Rob Mather and board member Peter Sherratt.
- A visit to AMF's distribution partner organization, United Purpose (formerly Concern Universal), in Malawi in October 2011 (notes and photos from this visit). We also spoke with United Purpose by phone in April 2016.
- A visit to Greater Accra, Ghana in August 2016 to meet with representatives of AMF, AMF's distribution partners Episcopal Relief & Development and Anglican Diocesan Development and Relief Organization (ADDRO), Ghana's National Malaria Control Program, and other non-profit and government organizations involved in the AMF-funded LLIN distributions in Ghana in 2016. Notes and photos from our site visit are available here.
- Conversations with Peter Sherratt, AMF's Executive Chairman; Don de Savigny, a member of AMF's Malaria Advisory Group; and other individuals (who requested to remain anonymous) familiar with AMF's work.
- Conversations with Melanie Renshaw of the African Leaders Malaria Alliance, Marcy Erskine of the International Federation of the Red Cross, and Scott Filler of the Global Fund to Fight AIDS, Tuberculosis, and Malaria about funding needs for nets.
All content on AMF, including past reviews, updates, blog posts and conversation notes, is available here. We have also published a page with additional, detailed information on AMF to supplement some of the sections below.
What do they do?
AMF provides long-lasting insecticide-treated nets (for protection against malaria) in bulk to other non-profit organizations or government agencies, which then distribute the nets in developing countries.
As of September 2018, AMF has supported large-scale distributions in seven countries (Malawi, DRC, Ghana, Uganda, Togo, Papua New Guinea, and Zambia), for a total of 25 million LLINs distributed.1 AMF has also committed funding to upcoming distributions in Malawi, Papua New Guinea, Guinea, and Ghana totaling 15 million LLINs that are expected to take place in 2018-2020.2
A summary of AMF's distributions can be found in this spreadsheet.
The role of AMF and its partners in LLIN distributions
AMF's role in LLIN distributions is to:3
- Identify countries with funding gaps for LLINs.
- Find distribution partners (in-country non-profit organizations or government agencies) to carry out LLIN distributions. AMF and its partners agree on expectations for the distribution, including who pays for costs other than the purchase price of LLINs (which are always covered by AMF), the process that will be used to carry out the distribution, and what information will be collected and shared with AMF.
- Purchase LLINs and have them shipped to the distribution partners.
- Work with distribution partners to collect reports on the distribution and conduct follow-up surveys.
Distribution partners implement on-the-ground activities, including registering residents in targeted areas, distributing LLINs, monitoring the registration and distribution processes, and conducting follow-up surveys.4
Details follow.
Selecting locations for distributions and finding distribution partners
When selecting locations for future distributions, AMF told us it consults a series of sources, as it believes there is no single reliable resource with up-to-date information about where there are funding gaps for LLINs. Sources it consults include the Alliance for Malaria Prevention's (AMP's) list of countries with significant net gaps, other malaria control funders, in-country technical advisors, the relevant National Malaria Control Program (NMCP), implementing organizations, and the African Leaders Malaria Alliance.5 AMF told us that it has been receiving more funding requests since it started funding larger distributions,6 and notes that its largest commitment so far—12.8 million LLINs in Uganda in 2017—was made in response to an in-bound request.7
As AMF investigates countries with existing net gaps, it also looks into organizations working within those countries that could serve as distribution partners.8 AMF looks for distribution partners that have the capacity and willingness to implement registration, distribution, and monitoring processes that meet agreed-upon requirements.9 So far, AMF has worked with United Purpose (formerly Concern Universal) in Malawi, IMA World Health in the Democratic Republic of the Congo, Episcopal Relief & Development in Ghana, National Malaria Control Programs (NMCPs) in Ghana, Togo, Uganda, Zambia, and Malawi, and the Rotary Club of Port Moresby in Papua New Guinea on large-scale LLIN distributions.10
For an example of the process AMF went through to establish the funding gap in Guinea for its 2019 distribution, see Rob Mather, AMF CEO, email to GiveWell explaining Guinea process, October 14, 2018.
Registration and distribution
- Registration: During the registration process, national health system staff or volunteers11 travel door-to-door in targeted areas to collect the information used to determine the number of LLINs to allocate to each household (e.g., the number of sleeping spaces and/or the number of household members), as well as the information used to identify the household for the distribution and post-distribution surveys (e.g., the name of the head of the household and/or household location). AMF has shared full or sample registration data from each completed large-scale distribution prior to 2017 with us; we have not seen this data for some of AMF's more recent distributions. The specifics of the registration process and LLIN allocation strategy have differed by country (process details and registration data sources on a separate page with additional details about AMF).
- Distribution: To distribute LLINs to recipients, AMF and its distribution partners have primarily used "point distribution" (LLIN recipients pick up their nets from a specified point in or near their community), but have also used "hang-up distribution" (staff or volunteers travel door-to-door to deliver and hang up LLINs) in one distribution in Kasaï-Occidental, DRC.12 Distribution partners manage the logistics of in-country shipping and storage of LLINs prior to the distribution. The specifics of distribution processes have varied in the different countries AMF has worked in (details on a separate page with additional details about AMF).
Monitoring
AMF's distribution partners also implement a set of monitoring activities to produce evidence on whether the registration and distribution processes operated as intended and on the long-term impact of the LLIN distribution. Monitoring activities have varied somewhat for different distributions. We describe these processes in more detail on our page with additional information on AMF. In short:
- Process monitoring (i.e., the activities used to assess whether the registration and distribution processes operated as intended):
- Data validation: This includes various processes, which have varied considerably in different distributions, to check the accuracy of registration and distribution data. It has generally involved looking for and following up on outliers or implausible data, and has sometimes involved re-entering a sample of data or reading registration lists out loud at community meetings and asking community members for corrections.
- "Embedded" monitoring: (Ghana only) Staff of AMF's local NGO partner organization attended district-level planning meetings to ensure that they were operating as intended, observed the registration of households by volunteers organized by the government, and observed selected distribution points.13
- Distribution reports: Distribution reports provide narrative summaries of activities implemented and challenges encountered by distribution partners.
- Post-distribution validation tracing: (Ghana only) After distributions were complete, AMF's distribution partners in Ghana checked that a random sample of households (100 households per district) had actually received the number of LLINs they were allocated by calling or visiting the households.14
- Impact monitoring (i.e., the activities used to assess the impact of the distribution):
- Post-distribution monitoring (PDMs): Distribution partners conduct follow-up surveys (called post-distribution monitoring, or PDMs; formerly known as post-distribution check-ups, or PDCUs) by visiting between 1.5% and 5% of households at regular intervals (previously every 6 months, now every 6 or 9 months) for 2.5 years after a distribution.15
PDMs collect data on whether nets are present, whether they are hung, and what condition they are in.
We summarize which PDMs have been completed in this spreadsheet (see "PDMs" sheet) and summarize the results and methods of PDMs we have seen in this spreadsheet.
Most scheduled PDMs have been completed in Malawi, and the Ghana PDMs are on schedule. AMF has also shared data and reports from its first three PDMs from Kasaï-Occidental, DRC and two PDMS in Nord Ubangi, DRC. We have not seen PDMs from AMF's newer countries of operation: Uganda, Togo, Papua New Guinea, and Zambia. We believe the Kasaï-Occidental PDMs were poorly implemented and provide limited evidence on the proportion of AMF's LLINs that reached their intended destinations or the impact of AMF's distribution on LLIN usage over time in Kasaï-Occidental (see this blog post for details). The 6-month PDM in Nord Ubangi, DRC was not completed due to security concerns. We have now seen 12- and 18-month PDMs from Nord Ubangi.
In June and July 2017, as part of its partnership with GiveWell, IDinsight conducted site visits to observe post-distribution surveys and learn about AMF's monitoring of its programs. The surveys were conducted by United Purpose (formerly Concern Universal) in Malawi and by Episcopal Relief and Development and the Anglican Diocesan Development and Relief Organization (ADDRO) in Ghana. IDinsight's notes from these two visits are here: Malawi site visit notes (June 2017) and Ghana site visit notes (July 2017). IDinsight is planning similar visits to Uganda, Togo, and Zambia in 2019.16 IDinsight has compiled a report on its findings so far, including the sources of potential bias in post-distribution surveys and recommendations for improvements to AMF's monitoring processes.17
- Post-distribution monitoring (PDMs): Distribution partners conduct follow-up surveys (called post-distribution monitoring, or PDMs; formerly known as post-distribution check-ups, or PDCUs) by visiting between 1.5% and 5% of households at regular intervals (previously every 6 months, now every 6 or 9 months) for 2.5 years after a distribution.15
PDMs collect data on whether nets are present, whether they are hung, and what condition they are in.
Other activities
AMF occasionally supports malaria control activities beyond the direct distribution of LLINs. For example:
- AMF has begun funding research on insecticide resistance that will be carried out in conjunction with AMF distributions. AMF is funding research on the effectiveness of PBO LLINs in conjunction with its Uganda 2017 distribution. PBO LLINs are a newer type of net incorporating piperonyl butoxide (PBO) alongside pyrethroid insecticide used in other LLINs. These nets may be more effective than other LLINs in areas where mosquitoes have developed insecticide resistance. The work is projected to cost $2.5 million.18
AMF also funded the first phase of a study (which cost around $100,000) on insecticide resistance in Nord Ubangi, DRC; in November 2016, AMF told us that it no longer planned to fund the completion of this study (which would have cost around an additional $700,000) because it was funding the PBO study in Uganda.19
- AMF is co-funding a "Malaria Unit" in Malawi with United Purpose.20 The Malaria Unit will consist of up to 14 permanent staff members who will work on a variety of malaria control projects: conducting post-distribution surveys, improving malaria case rate data collection practices, monitoring the levels of malaria prevention and treatment supplies at local health centers, developing efficient methods to keep net coverage rates high in between mass distribution campaigns, and more.21 The Malaria Unit is also intended to assist with AMF and United Purpose's distributions in Malawi.22 AMF has committed approximately $736,000 over three years to this project.23
- Starting in 2015, AMF encouraged United Purpose staff to attend national malaria control strategy meetings in Malawi to share AMF's processes and results in other districts. AMF anticipated that this would result in some of its monitoring practices (e.g. using sleeping spaces data rather than population data to determine the number of nets needed; conducting "105%" registration data collection; and putting summary village-level or health facility-level data into electronic form) being adopted in distributions supported by other funders.24
Our understanding as of early 2018 is that these practices have not yet been adopted.25
Spending breakdown
The following table shows AMF's total expenditure, categorized into purchases of LLINs, spending on running the organization, and spending on other non-net costs (such as providing funding to other organizations to conduct post-distribution monitoring, which is described above). We include spending since FY 2012 (July 2011 to June 2012) because this is when AMF shifted to its current model of larger-scale distributions.
AMF expenditure by category26 Category July 2011 to June 2018 spending Percentage of total spending, FY 2012 to 2018 LLIN purchases $85.6 million 87.5% Costs of distributing nets and monitoring ("non-net costs") $9.1 million 9.3% Insecticide resistance research $1.6 million 1.7% Salaries and other organizational costs $1.3 million 1.4% Total spending $127.3 million - Prior to 2013, AMF asked all distribution partners to use their own funds or to find another funder for all non-net costs of the distribution.27 More recently, it has paid for some of these costs in certain distributions. AMF told us that it considers funding non-net costs in cases where (a) non-net costs are not covered by other partners, and (b) AMF feels confident that its distribution partners will manage and report on spending well.28
Does it work?
On a separate page, we discuss the general evidence behind distributions of LLINs. We conclude that there is strong evidence that these distributions can be expected to reduce child mortality and malaria cases.
When evaluating the effectiveness of an LLIN distribution organization, we seek to answer the following questions:
- Are LLINs targeted at people who do not already have them? In general, we believe enough time has passed between LLIN distributions in the regions in which AMF operates that most previously-owned nets have worn out by the time that AMF's distributions take place. We do not have data on the extent to which households receive nets from other sources (e.g. on the private market, during clinic visits), but our impression is that LLIN mass campaigns are the main source of nets in the locations where AMF works.
- Do the LLINs reach the intended destinations? The main evidence that LLINs reached their intended destinations at a high rate are (a) post-distribution surveys, where surveyors visit a sample of households that registered for nets six or nine months after the distribution, and (b) data collected from households during registration and, for some distributions, data collected at the time of the distribution about which households are reported to have received their nets. We have seen (a) and/or (b) from all of AMF's distributions prior to 2017; we have not seen this information for some of AMF's more recent distributions. We discuss some limitations of the post-distribution surveys below.
- Are LLINs targeted at areas with high rates of malaria? AMF seeks out distribution partners in countries that are known to have high rates of malaria, or where malaria rates are likely to increase significantly if LLIN distribution programs are not sustained. We note that Papua New Guinea (where AMF funded LLIN distributions beginning in 2017) has lower (but still significant) rates of malaria than other countries where AMF has worked or plans to work.
- Do those who receive the LLINs install them in their homes properly? Do they utilize them consistently over the long term? AMF requires partners to conduct follow-up surveys at 6- or 9-month intervals for a period of 2.5 years. In most cases, the results from Malawi and Ghana seem consistent with moderate to high usage of nets for at least a year or two after distribution; the limited results we have seen from DRC have been somewhat less positive.29 We discuss some methodological limitations of the surveys below.
- Do AMF's LLINs increase the total number of LLINs distributed, or would the recipients have received LLINs from other sources if not for AMF? The evidence we have seen suggests that donations to AMF increase the total number of LLINs distributed, but that a portion of the impact is offset by displacing funding from other sources.
Details follow.
Are LLINs targeted at people who do not already have them?
We believe it is likely that AMF's distributions primarily result in people who would not otherwise have viable LLINs receiving them, though it may lead in some cases to households that already own nets receiving more nets than are needed. Key factors in this assessment include:
- The amount of time elapsed between distributions, as compared to our expectation of how quickly nets become worn out. Distributions are generally scheduled for every three years. Our best guess is that LLINs last, on average, between 2 and 2.5 years.30
- Whether people targeted by AMF's distributions would obtain nets from other sources in the absence of AMF's work. We do not have data on whether people targeted by AMF's distributions obtain nets from other sources; our impression is that mass distributions like those supported by AMF are the primary means by which people obtain nets.31
- AMF's process for allocating nets to households, which involves AMF's distribution partners visiting households and recording how many nets are needed based on the number of people or number of sleeping spaces in each house.32
AMF notes that it interprets the data from PDMs as indicating that LLINs should be replaced at least every three years, and that subtracting usable nets that a household already owns from the calculation of total net need (unless the nets have never been used) increases the period where a household has to rely on old, ineffective nets until the next LLIN campaign.33 In past distributions in Malawi and DRC, AMF has allocated nets based on the number required per household minus the number of nets already owned by that household. Going forward, AMF will not be taking previously-owned nets into account.34
Do LLINs reach their intended destinations?
We have seen reasonable evidence that a large proportion of AMF's LLINs have reached their intended destinations in AMF's past distributions, excluding its most recent distributions. The strongest evidence we have seen on this question from Malawi and Ghana is from post-distribution surveys, and the strongest evidence from DRC and Papua New Guinea is from household-level data on nets received. We have not yet seen evidence on this for recent distributions in Togo, Uganda, and Zambia. (We had expected to see at least some of this information from Togo, Uganda, and Zambia by this point in time.)
The main sources of evidence that LLINs reached their intended destinations at a high rate are (a) post-distribution monitoring, where monitors visit a sample of households that registered for nets generally six or nine months after the distribution, and (b) data collected at the time of distributions on which households are reported to have received their nets. We have also seen narrative distribution reports for most of AMF's distributions and a few other minor sources of evidence that LLINs reached their intended destinations.
Post-distribution monitoring
AMF's distribution partners conduct post-distribution monitoring, discussed in detail below, about six to nine months after each distribution (and regularly after that up to 2.5 years after the distribution) to determine whether nets are in place, being used, and in good condition.35 The first post-distribution surveys that have been completed to date for each large-scale distribution in Malawi have generally found somewhat mixed results: the first four found rates above 80% (90%, 87%, 93%, and 81%) of LLINs from the recent AMF distributions hung over sleeping spaces, while the more recent distributions have had worse results (69% and 60%; the latter was followed by a rate of 77% at 12 months). Most nets that were not hung were present in the household; the highest rate of missing nets was 5% (see this summary of results for details).36 Hang-up rates at 6 months post-distribution in Ghana were relatively high: 80%, 84%, and 90% in the three regions.
We believe that the results of the first post-distribution surveys from distributions in Malawi and Ghana provide reasonable evidence that nets reached their intended locations at a high rate, though we note some methodological limitations of these surveys below.
We believe that the 8-, 12-, and 18-month surveys in Kasaï-Occidental were poorly implemented, and that the results of the surveys provide limited evidence on the proportion of AMF's LLINs that reached intended destinations (details in this blog post).37 The 6-month survey in Nord Ubangi was canceled due to violence; the 12-month survey found a hang-up rate of 64%.38
For more recent distributions, AMF plans to conduct PDMs starting at nine months rather than six months.39
Four "waves" of distributions in Uganda had been completed by July 2017.40 Our understanding is that the first PDMs have yet to occur in those regions. We believe that PDMs conducted more than a year after a distribution are less helpful for determining whether nets reached their intended destinations than PDMs conducted six months after the distribution.
Household-level data on nets received
In addition to recording data on the number of LLINs allocated to each household during the registration process, AMF's distribution partners also record data on the number of LLINs actually distributed to each household during the distribution process.
For the 2014 and 2015 distributions in Malawi, we have not seen household-level data on the number of nets received. Our understanding is that these data exist in paper form only.
For the 2014 Kasaï-Occidental distribution in DRC, households received nets at the same time they were registered, so the registration list provides some evidence that nets reached their intended destinations.41 We have seen registration and distribution data from Nord Ubangi, DRC that include numbers of LLINs actually received and hung up for each household.42 We have not yet seen a distribution report from Nord Ubangi, so we are uncertain about how data on the number of LLINs households actually received were collected.
In Ghana, data on the number of LLINs actually distributed to each household were recorded by LLIN distributors, and later entered electronically into AMF's Data Entry System, where we have viewed the data.43 We also spot-checked some paper records during our visit to AMF's distribution partner in Ghana in 2016.
We have not yet seen this data for recent distributions in Togo, Uganda, Papua New Guinea, and Zambia.
Distribution reports
Distribution reports provide narrative summaries of distribution activities and discuss challenges encountered. These reports provide some evidence that distributions generally operated as intended (or that distribution partners are aware of specific challenges and have plans to address them) and that households actually received LLINs; however, we do not think this type of evidence is as useful for the question of whether LLINs reached households as the two types of evidence discussed above.
United Purpose has provided distribution reports for four of the six large-scale distributions it has completed in Malawi.44 As we report in our March 2012 update, reports from the Ntcheu 2012 distribution note challenges including attempted thefts, double registrations, and logistical problems.45 United Purpose provided a similar level of detail on challenges encountered in the Balaka 201346 and Dedza 2014 distributions,47 and the first half of the Dowa 2015 distribution.48 These reports increase our confidence that United Purpose is aware of potential problems and has a system in place to address them.49 We have not seen reports for the Ntcheu 2015 or Balaka 2015 distributions in Malawi.
IMA World Health has provided a distribution report for the Kasaï-Occidental, DRC 2014 distribution. We have not yet seen any distribution reports from the Nord Ubangi, DRC distribution.50
We have seen progress reports covering periods of pre-distribution, distribution, and post-distribution activities from Episcopal Relief & Development, AMF's distribution partner in Ghana, for the 2016 distributions in Greater Accra, Northern Region, and Upper West Region, and a full report on the 2016 distribution in the Northern Region.51 These reports discuss problems encountered in each of these stages.52
AMF has also shared distribution reports from each of its newer countries of operation, namely Uganda, Togo, Papua New Guinea, and Zambia.53 These reports give an overview of the distributions that occurred and discuss challenges and problems encountered during the distribution; see footnote for examples.54
Other evidence
For the Kasaï-Occidental 2014 distribution, AMF's distribution partner, IMA World Health, piloted the use of smartphones to record household data, including GPS coordinates, for registration and LLIN distribution.55 AMF has sent us detailed GPS data that show the GPS coordinates for each household visited.56 The registration and distribution data from Nord Ubangi, DRC also included GPS coordinates for each household.57
In Ghana, it is our understanding that "post-distribution validation tracing" (i.e., checking, immediately after the distribution, by phone or in-person, that a randomly selected sample of households actually received the correct number of LLINs) was used for all three AMF-funded distributions in 2016, but we have not seen comprehensive results from this process (e.g., the proportion of selected households that received the appropriate number of LLINs).58 AMF told us that it expected to see data from post-distribution validation tracing from Episcopal Relief & Development in January 2017;59 we have not followed up with AMF for these data.
Are LLINs targeted at areas with high rates of malaria?
At the highest level, AMF appears to exclusively target countries with known malaria risk.60 Since 2012, AMF’s large-scale distributions have occurred in Malawi, DRC, Ghana, Uganda, Togo, Papua New Guinea, and Zambia.61 Based on 2013 data, the World Health Organization estimated that Malawi, DRC, Ghana, Uganda, Togo, and Zambia had malaria death rates of between 50 and 99 deaths per 100,000 people, and that Papua New Guinea's malaria death rate was between 10 and 49 deaths per 100,000 people.62
Do those who receive the LLINs install them in their homes properly? Do those who receive the LLINs utilize them consistently over the long term?
AMF requires partners to conduct PDMs at regular intervals for a period of 2.5 years, or until the next community-wide net distribution in the same area, to determine whether LLINs are present, whether they have been hung, and what condition they are in. Up to this point (mid-2018), AMF has conducted PDMs every 6 months. Going forward, PDMs will occur every 9 months (for distributions for which no PDMs have already taken place).63 Surveys covering distributions prior to 2017 have been reasonably comprehensive of the distributions that AMF has funded. They have some methodological limitations, discussed below. Results have been fairly positive with substantial variation across distributions.
Methods
See our summary of AMF distributions spreadsheet, "PDMs" sheet, for details of what PDMs have been completed. In short, AMF's PDMs are reasonably comprehensive: we have seen highly comprehensive results from all distributions taking place prior to 2017, and few of the scheduled surveys (which were intended to be conducted every six months) have been skipped.
We have not yet seen post-distribution surveys from Uganda, Togo, Papua New Guinea, or Zambia. This gap in monitoring is broadly due to a combination of (1) distributions having been completed fairly recently, (2) the shift from surveys beginning at 6 months to beginning at 9 months, and (3) delays in surveys being conducted.
For a description of the methodology used in AMF's PDMs, see this spreadsheet, sheet "Methods." In short:
- Households are now selected randomly for inclusion in the surveys. AMF generates the list of households to survey from the full list of households that were registered for the distribution.64 The list includes more households than will be surveyed, with the intention of allowing enumerators to skip some households (for example, when members of a household are not available); this may lead to bias in the results. Note that in some earlier surveys, households were not selected fully randomly.65
- AMF has told us that it asks its partner organizations to revisit 5% of the households visited, as a means of data quality control.66 While the idea is that the results from the revisits can then be matched and cross-checked against the original results, our impression is that this matching process historically has not actually occurred. AMF believes it will be easier to match the data using the Data Entry System.67 We have not yet seen this analysis for any distributions.
- We believe that the 8-, 12-, and 18-month surveys in Kasaï-Occidental were poorly implemented, and that the results of the surveys provide only limited evidence on the proportion of AMF-funded LLINs that are used effectively over the long term (details in this blog post).68 However, we think that the combination of the three reported rates of coverage (at 8-, 12-, and 18-months) tells a plausible story of a decline in coverage over time, which increases our confidence that these surveys are to some extent representative of LLIN hang-up rates, or at least of trends in hang-up rates.
- In 2017, GiveWell commissioned IDinsight to observe PDMs in Malawi and Ghana. For Ghana, IDinsight noted:
Results
Full results in this spreadsheet. Definitions of each indicator are on a separate page with additional information about AMF. In short:
- Malawi: The data from PDMs from the six distributions in Malawi show moderate-to-high rates of nets hanging and in at least "viable" condition for around 18 to 24 months post-distribution. The number of nets "worn out" appears to generally increase substantially as the time elapsed since the distribution approaches 2.5 years. Of the six distributions, the two more recent distributions seemed to have lower rates of nets from the distribution hanging. AMF believes that the low hang-up rates for these two more recent distributions may be due to the continued use of older LLINs from the 2012 distribution in Ntcheu and use of LLINs from other sources in Dowa (for other possible explanations, see footnote).71
- DRC: We believe the data we have seen from AMF's distributions in DRC provide some evidence that LLINs decayed considerably more quickly than expected.
- Ghana: The distributions in Ghana occurred in mid-to-late 2016, and follow-up reaching up to 24 months post-distribution shows high rates of nets hanging and nets in at least "viable" condition (i.e. not "worn out").
We note that net usage rates in the trials of bed net efficacy documented in our page on Long Lasting Insecticide Treated Nets were generally in the 60%-80% range.72 However, these usage rates are not directly comparable to the data from AMF's PDMs, which measure the proportion of nets hung, rather than usage.
As another point of comparison, the "decay model" we use to estimate the lifespan of LLINs assumes that 92% of LLINs are functional and in use for the first year after a distribution, 80% of nets are functional and in use for the second year, and 50% of nets are functional and in use for the third year.73 It is not fully clear to us how to compare the net quality and net hang-up rates found in AMF's post-distribution monitoring to the assumptions in the decay model, in part because it is not clear whether the definition of a "functional and in use" net in the decay model is comparable to what PDMs measure.
Do AMF's LLINs increase the total number of LLINs distributed, or would the recipients have received LLINs from other sources if not for AMF?
On a separate page, we discuss some cases where AMF was in discussions to fund a distribution, but ultimately did not. In most of these cases, the net gap AMF was in discussions to fill persisted for six or more months after AMF's discussions closed, and, in two out of the five cases we looked at, gaps persisted for long periods (18 months and ~3 years, respectively). In most cases, the gap was eventually filled by another funder. As far as we can tell, during the time between AMF withdrawing from discussions and another funder stepping in, the populations targeted for distributions did not receive nets and likely were inadequately protected from malaria.
We also discuss, on a separate page, what we have been told about what would have happened in the absence of AMF funding in two distributions that AMF did fund. In summary, in both cases our best guess is that there were no other funders who could have closed the gaps, and nets would have been at least partially targeted at higher-risk populations while others would have been left uncovered.
Across Africa, there are substantial funding gaps for LLINs (more below), and because our impression from following AMF's progress over time is that, due to AMF's more limited funding and, perhaps, greater data requirements, governments often seek funding first from larger funders (particularly the Global Fund to fight AIDS, TB, and Malaria) and then may ask AMF to fill gaps. However, we note that this dynamic may change if AMF has significant resources in the future (more below) and that countries are sometimes able to choose how they allocate Global Fund grants among malaria interventions (including LLINs, treatment, and diagnosis), so the availability of funding for LLINs from AMF could cause countries to allocate fewer Global Fund resources to LLINs.74
Are there any negative or offsetting impacts?
- Will insecticide-treated nets continue to be effective? As discussed in our report on insecticide-treated nets, there is strong evidence for the effectiveness of this intervention; however, the best evidence for the intervention was collected before LLINs were widely used and there is some evidence that mosquitoes have since adapted to the insecticide used in LLINs, possibly making them less effective. We have reviewed the evidence on the state of insecticide resistance. We concluded, "Broadly, it seems that insecticide resistance is a larger concern now than it was when we last thoroughly evaluated the evidence in 2012, but it remains difficult to quantify the impact of resistance. Our very rough best guess (methodology described in more detail below) is that insecticide-treated nets (ITNs) are roughly one-third less effective on average across sub-Saharan Africa than they would be in the absence of insecticide resistance. ITNs remain a highly cost-effective intervention after incorporating this discount." We wrote here about recent evidence suggesting that piperonyl butoxide (PBO) nets give additional protection over standard LLINs in areas with insecticide resistance; we also use this recent evidence to inform our estimate of the effects of insecticide resistance in distributions of standard LLINs. AMF expects that a portion of the nets it funds in the future will be PBO nets.75
- Do free LLIN distributions distort incentives for recipients or distort local markets for nets? As discussed in our report on insecticide-treated nets, we feel that there is a reasonably strong case for distributing LLINs freely rather than selling them at market (or even below-market) prices. We also think that the benefits of distributing LLINs freely to a population likely outweigh the negative consequences of distortion in local net markets, though we have not factored these potentially negative consequences into our cost-effectiveness analysis of AMF.
- Could distribution of LLINs be inequitable and unfair, causing problems in the targeted communities? We feel that AMF's processes for determining needs for LLINs at the household level are fairly well-suited to ensuring that LLINs are distributed equitably. We have some concerns about whether AMF's process succeeds at identifying all villages or households located outside of villages.
- Does AMF divert skilled labor from other areas? In Malawi, net distributions have been conducted by low-level government health staff in partnership with the staff of AMF's partner NGO.76 AMF's partner in Malawi told us in 2012 that government health staff are normally involved in activities such as disseminating health-related information, reporting on levels of stunting and disease, carrying out immunization campaigns, and providing nutrition support.77 We do not know the extent to which net distribution reduces their ability to complete other duties, though we note that net distributions are generally completed within a few days in each local area, and we would guess that LLIN distributions are likely among the most cost-effective work they engage in.78 Diversion of skilled labor may be more of a concern in the DRC, where 22 senior district health staff were employed as Field Supervisors for the Kasaï-Occidental distribution.79 AMF's distributions in Ghana in 2016 were planned by high-level staff from a government health agency and implemented by local government staff and volunteers; monitoring of the distribution was largely implemented by a Ghanaian non-profit organization.80 We have not investigated what other activities the government and non-profit staff and volunteers engage in, or whether the LLIN distribution interferes with their ability to perform other duties.
What do you get for your dollar?
Cost per LLIN distributed
We estimate that on average the total cost to purchase, distribute, and follow up on the distribution of an AMF-funded LLIN is $4.53. Excluding in-kind government contributions, we estimate the cost is $4.29. These estimates rely on a number of uncertain assumptions. Full details of our analysis are in this spreadsheet. For results, see sheet "Summary." More discussion follows.
Below, we also discuss how we estimate the cost per death averted in AMF distributions.
Our approach
To get the total costs of the program, we attempt to include all partners such that our cost per LLIN represents everything required to deliver the nets. In particular, in our cost per treatment analysis for AMF, we have attempted to include these categories:
- The costs paid by AMF to purchase LLINs. This accounts for 46% of the total cost per LLIN.
- Costs of shipping and delivering nets, monitoring the distribution, and conducting PDMs. In most cases, the Global Fund or another partner pays for most of these costs; in almost every case, AMF has paid for the PDMs. In total, these costs account for 45% of the total.
- Resources contributed by governments, such as staff time, office space, etc. We roughly estimate these costs as a proportion of the total cost (excluding LLIN purchase costs) based on an analysis of a distribution in Malawi in 2012. This accounts for 5% of the total.
- Other AMF costs: staff salaries and other organizational costs, a rough estimate of the value of the CEO's donated time and estimated value of other pro bono support, research AMF has funded on insecticide resistance, and costs of the Malaria Unit in Malawi. This accounts for 3% of the total.
We start with this total cost figure and apply adjustments in our cost-effectiveness analysis to account for cases where we believe the charity's funds have caused other actors to shift funds from a less cost-effective use to a more cost-effective use ("leverage") or from a more cost-effective use to a less cost-effective use ("funging").
We used data and estimates from completed distributions, ongoing distributions, and distributions that AMF has committed to funding in the future.
Comment from AMF: AMF would like all donors reading this to know that the costs included for the CEO and pro bono services are not actually incurred. Each of them is very happy to provide their services for free.On a separate page, we triangulate our AMF estimates of cost per LLIN with a rough global average cost per LLIN.
Shortcomings of our analysis
There are several ways in which our analysis of AMF's cost per LLIN is uncertain:
- The price of an LLIN has been falling and in our estimate we have used a projected price per LLIN, rather than an average of the prices AMF has paid in the past. The average price in distributions AMF funded in 2016-2018 was $2.20. Based on what AMF told us it expects in the future, we have used an estimate of $2.10 per LLIN.
- For distribution costs not paid by AMF, we have generally used rough estimates.81
- It is difficult to predict where AMF will fund LLINs in the future because it pursues several discussions at once. To get an overall average cost, we have taken a weighted average of past distributions, weighted by AMF's spending in each distribution, rather than weighted by AMF's expected spending in the future. This means that if, for example, AMF funds a larger proportion of nets in DRC, where costs are high, in the future than in the past, our cost per LLIN would be an underestimate. (Note that this does not mean that funding LLINs in DRC is necessarily less cost-effective—our cost-effectiveness analysis also takes into account factors such as malaria mortality rates in each country.)
Cost per death averted
See our most recent cost-effectiveness model for estimates of the cost per death averted through AMF-funded LLIN distributions.
Note that our cost-effectiveness analyses are simplified models that do not take into account a number of factors. For example, our model does not include the short-term impact of non-fatal cases of malaria prevented on health or productivity, prevention of other mosquito-borne diseases, or reductions in health care costs due to LLINs reducing the number of cases of malaria. It also does not include possible offsetting impacts or other harms. We do include possible developmental impacts on children who sleep under an LLIN.82
There are limitations to this kind of cost-effectiveness analysis, and we believe that cost-effectiveness estimates such as these should not be taken literally, due to the significant uncertainty around them. We provide these estimates (a) for comparative purposes and (b) because working on them helps us ensure that we are thinking through as many of the relevant issues as possible.
The full details of our cost-effectiveness analysis are in our report on mass distribution of LLINs.
Is there room for more funding?
Note: All content in this section reflects AMF's funding situation as of August 2018 except where otherwise noted.
Update: In November 2018, we recommended that Good Ventures grant $2.5 million to AMF; due to the large amount of uncertainty regarding our estimate of AMF's room for more funding, this grant recommendation does not significantly impact our estimate.
We believe that AMF is likely to be constrained by funding. There is a high degree of uncertainty in the maximum amount that AMF could use productively, but given AMF's track record of finding and filling funding gaps for LLINs and the large size of the global funding gap (estimated to be in the hundreds of millions of dollars for 2018-2020), we expect the maximum to be significantly greater than what AMF is likely to receive. We expect that most new distributions that AMF signs agreements for in 2019 would not take place until 2020 or 2021. November 2018 update: AMF told us that it expects that these distributions would take place in 2019 and 2020.
In short (more details in the sections below):
- Total opportunities to spend funds productively: By the end of 2018, AMF expects to have signed agreements to use the full amount of funding it has on hand to fund LLIN distributions in 2019-2020, though, based on AMF's past experience, our guess is that some of the specific discussions that AMF is pursuing will not result in agreements for reasons other than lack of funding. As of August 2018, AMF had not yet identified which countries it would most likely sign distribution agreements with using funding it receives in late 2018 and early 2019. (November 2018 update: AMF told us that it has identified three to four countries where it is most likely to commit funding that it receives in late 2018 and in 2019.83 ) Based on AMF's track record of finding and filling gaps in LLIN distributions and on its level of spending over the past few years (in the range of $20-30 million per year), we expect it to have opportunities to commit to distributions costing in the low tens of millions of dollars with funding it receives over the next year. We roughly estimate the total global funding gap for LLINs in 2019 and 2020 at approximately $550 million. (More)
- Cash on hand: As of August 2018, AMF held $84.1 million, of which $65 million was uncommitted to future activities. Update: As of October 2018, AMF held $90 million, of which $47 million was uncommitted to future activities.84 (More)
- Expected additional funding: We roughly estimate that AMF will receive $10.9 million in 2019-2021, not including funds due to GiveWell's recommendation. This could be an underestimate—AMF expects to make fundraising a larger priority in the future. (More)
Below, we also discuss:
- Past spending rate: AMF has a track record of spending tens of millions of dollars per year; however, we see its limited staff capacity as a risk to its ability to increase its spending in the future. (More)
- Considerations around the size of AMF distributions: Funding a large portion of a national distribution may have advantages in terms of efficiency and leverage, but also increases the risk of displacing funding from other donors. We discuss AMF's approach to this tradeoff. (More)
Uncommitted and expected funds
As of August 2018, AMF held $84.1 million. Of this, $19.1 million was committed to PDMs for previous distributions, future distributions in several countries, central costs, the research study on PBO nets in Uganda, and the Malaria Unit in Malawi, leaving $65 million in uncommitted funds.85 Update: As of October 2018, AMF held $90 million, of which $47 million was uncommitted to future activities.86
We expect that AMF will receive additional donations over the remainder of 2018 and in 2019 from:
- Donors who are not influenced by GiveWell's research: Historically, the vast majority of AMF's funding has been due to GiveWell's recommendation.87 As a rough guess, we expect AMF to receive about $1.5 million from non-GiveWell sources in the next year. This may be an underestimate as AMF has told us that it expects fundraising to be a key priority in late 2018 and 2019.88
- Donors who give based on GiveWell's top charity list, but do not follow our recommendation for marginal funding: GiveWell maintains both a list of all top charities that meet our criteria and a recommendation for which charity or charities to give to in order to maximize the impact of additional donations, given the cost-effectiveness of remaining funding gaps. We estimate that AMF will receive about $2 million from donors who use our top charity list but don't follow our recommendation for marginal donations.89 In our projections of future funding, we count only one year of funding that an organization receives as a result of being on our list of top charities in order to retain the flexibility to change our recommendations in future years.
- Funding held by GiveWell: As of mid-2018, GiveWell held $4.4 million in funding to be regranted to AMF. This includes donations made to GiveWell for regranting to AMF as well as a portion of donations to GiveWell that were restricted to regranting to top charities at our discretion. We also include in this amount a planned grant from the Global Health and Development EA Fund, which is not formally affiliated with GiveWell, but is managed by Elie Hassenfeld, Co-Founder and Executive Director of GiveWell.90
With $65 million in currently uncommitted funding and $7.9 million in expected additional funding over the next year ($1.5 million from the first source in the list above, $2 million from the second, and $4.4 million from the third), as well as an additional $1.5 million per year for the following two years from donors who are not influenced by GiveWell's research, we estimate that AMF will have about $75.9 million available over the next three years.
Update: As of October 2018, AMF held $90 million, of which $47 million was uncommitted to future activities.91 Our updated best guess is that AMF will have $57.9 million available over the next three years.
November 2018 update: AMF recently received a grant for $5 million over five years. We have not incorporated this into the room for more funding analysis below. Given the large amount of uncertainty in our estimate of the amount of funding AMF could productively absorb over the next few years, this additional funding does not substantially impact our conclusions.
Additional spending opportunities
AMF has fairly specific plans for how it may allocate the $65 million that it had on hand as of August 2018, though these plans are dependent on its negotiations with partners. For funds received in late 2018 and in 2019, it is less clear to us what funding gaps AMF might have the opportunity to fill. AMF's track record suggests that it will be able to commit to distributions totaling roughly $20-30 million per year. There appears to be a large global funding gap for LLINs.
November 2018 update: AMF told us that it has identified three to four countries where it is most likely to commit funding that it receives in late 2018 and in 2019.92
Current plans
AMF told us that, as of August 2018, it expected to sign agreements soon for distributions totaling $48 million, and was in detailed discussions about distributions that would cost an additional $65 million. All distributions in these categories are expected to take place in 2019 and 2020 and would be almost entirely in countries in which AMF has funded major distributions previously (DRC, Zambia, Togo, and Uganda, as well as one other country); our understanding is that work in DRC may involve new distribution partners, in addition to or instead of those AMF has worked with in the past. AMF told us that, if discussions with Zambia, Togo, and Uganda are successful, it expects to have about $17 million left to allocate to the DRC, leaving an estimated gap of $42 million in DRC.93 AMF told us in November 2018 that the opportunity to fill the gap there will no longer be available if it remains unfilled by December 2018.94
AMF told us that it is also in early conversations with five countries about distributions that AMF roughly estimates would cost an additional $65.8 million to fund; we expect that some of these distributions would not move forward due to considerations other than funding. AMF has not funded major distributions in any of these countries previously, which we expect to increase the length of time needed for discussions before distribution agreements are signed. Therefore, we anticipate that distributions signed in 2019 would likely take place in 2020 or 2021.
Finally, AMF told us that it has a stretch goal of raising at least $100 million by the middle of 2019 with a goal of negotiating an arrangement with a major co-funding partner in which AMF funds all nets needed in one or more countries during the partner's next funding cycle, and the partner re-allocates funding it would have provided to those countries to fund LLINs to instead fund LLINs in different countries.95 We have substantial reservations about this plan (more details below), but think it is very unlikely that AMF will raise this amount of funding.
Expected maximum
We believe that there will be a large global funding gap for mass LLIN campaigns over the next few years. Our best guess is that the funding gap for the period 2018-2020 was approximately $640 million for the 35 countries for which information was available as of early 2018.96 This includes gaps of $140 million in 2019 and $410 million in 2020.97 However, these estimates rely on a number of difficult judgment calls and may therefore substantially over- or underestimate the true gaps.
Ways in which the global funding gap for LLINs in 2018-2020 may be significantly overestimated include:
- Nigeria, which accounts for about half of the global gap ($330 million), is attempting to raise $300 million for malaria control;98 we expect that if it is successful, this will significantly reduce the gap, though not all of the funding raised would be spent on LLINs.
- Countries may decide to reallocate funding from other health programs or budget years in order to fill urgent gaps.
- The majority of the gap for this period is in 2020, which may be due to countries choosing to frontload Global Fund funding with the hope of identifying additional sources of funding later (the current round of Global Fund funding covers 2018-2020).99 There may still be enough time for other funders to fill gaps in that year.
Despite these considerations, we expect the funding gap for 2018-2020 to remain in the range of several hundred million dollars. The projected gaps for 2018-2020 (13% of total need in 2018, 13% of total need in 2019, and 40% of total need in 2020)100 are roughly in line with the end-of-year gaps in recent years. According to the RBM Partnership to End Malaria, the unfilled LLIN gaps in 2013-2015 were 22 million (13% of total need), 38 million (15% of total need), and 39 million (18% of total need), respectively.101 We estimate that the net gap in 2016 was 29% of total need, and that the gap in 2017 was 2% of total need.102 The RBM Partnership to End Malaria told us that the gap in 2017 was particularly low due to funding mechanisms that are no longer available.103
For more detail on our analysis of the global funding gap for LLINs, see our report on global funding gaps for LLINs and seasonal malaria chemoprevention and the spreadsheet with the calculations we used in that report.
Rate of funds moved
We had previously expressed concerns about AMF's ability to scale up.104 We now believe that AMF has a track record of productively spending large amounts of funding annually. It spent $34.3 million in its 2016 fiscal year, $27 million in 2017, and $26 million in 2018, up from $4 million or less in each of the prior years.105
Progress at signing new agreements was slow compared with AMF's available funding in 2017 and 2018, leaving AMF with a large amount of funds on hand. We attribute this to the facts that countries spent much of 2017 applying for Global Fund funding; decisions about how much funding would be allocated to LLIN distributions for 2018-2020 (and therefore what the funding gaps would be for LLINs) were still being finalized in many countries as of late 2017;106 and details of specific distributions, such as decisions about how funding would be allocated between 2018, 2019, and 2020, were still being finalized in many countries as of August 2018.
With the possible exception of one country with which AMF is currently in discussions, any new distributions it signs with funds received at the end of 2018 or in 2019 would be in countries where it has not funded major distributions in the past. We expect that discussions with new countries require more time than discussions with countries where AMF has funded distributions previously. Taking into account this longer timeline for discussions as well as AMF's preference for committing funding at least 18 months in advance of a distribution to give its partners time to plan a high-quality distribution, funding that AMF receives at the end of 2018 and beginning of 2019 would likely fund distributions in 2020 at the earliest.
While we understand that having more lead time is beneficial for countries' planning processes,107 we are concerned that committing to distributions far in advance increases the uncertainty about whether funding would have been available from another source. Specifically, we are mildly concerned that committing to distributions that will take place in 2021 could lead the Global Fund to allocate less funding to these areas for its 2021-2023 funding cycle.
November 2018 update: AMF told us that it is in discussions with three countries where it has funded major distributions in the past and that if these discussions are successful, it expects the majority of these distributions to take place in 2019 and 2020.
Staff capacity
We see AMF's staff capacity as one of the main risks to its ability to spend funds efficiently. Since November 2017, AMF has grown from four to seven staff.108 Our impression is that it continues to be severely capacity constrained, possibly due in part to the delay between hiring new staff and seeing meaningful increases in capacity. AMF noted (in 2016) that it believed that staff capacity had not constrained its ability to sign agreements or manage distributions.109
Considerations around the size of AMF distributions
Efficiency and leverage
AMF has told us that focusing on large distributions allows it to:110
- Be more efficient, since its staff capacity is largely limited by the number of distributions it is in discussions about and following up on.
- Focus on the countries that it has experience working with and where it has relationships with partners.
- Have more leverage to ask countries to carry out distributions and monitoring according to AMF's preferred processes. Funding a distribution requires negotiating with NMCPs, which we perceive to have some discretion in which funders they work with, and which we perceive to be choosing funders based on a variety of factors, including size and reporting requirements.111 In the past, AMF has been able to fund only a relatively small piece of countries' distributions (Uganda is an exception), but has maintained substantial reporting requirements. This dynamic may create fundamental reasons for governments to prefer partnerships with other funders.
- Give countries more confidence that their distributions will be fully funded and allow for easier planning and more timely distributions.
For these reasons, AMF's preferred approach would be to offer to purchase all the nets needed for one or more countries' distributions, and, if additional funds were available, fill gaps in LLIN funding for other countries; it would not fund the non-net costs, so this would mean funding about half of the full cost of the distribution.
Fungibility
AMF's approach in the past has been to look for funding gaps—countries that do not have sufficient funding from the Global Fund and other funders for nets—and offer to fill or partially fill those gaps. Given that countries and other funders have some discretion over how funds will be used, it is likely that some portion of AMF's funding has displaced other funding into other malaria interventions and into other uses.
We would guess that this effect would be significantly greater (i.e., there would be more displacement of other funding) if AMF were to pursue the strategy of offering to purchase all of the nets needed for one or more countries, rather than filling in gaps once the Global Fund has made its allocations. It is our understanding that once the Global Fund has told countries how much funding they have been allocated for each disease, it is difficult to change those allocations and to shift funding to countries that have funding gaps for nets. Therefore, we think that the most likely result of AMF providing a large amount of funding for nets to one country would be for that country to spend more Global Fund resources on other malaria interventions (including general health systems strengthening) or (less likely) to reallocate funds from malaria to AIDS and/or tuberculosis work (the other two diseases for which the Global Fund provides funding).
AMF has told us that it has a stretch goal of raising at least $100 million by the middle of 2019 with a goal of negotiating an arrangement with a major co-funding partner in which AMF funds all nets needed in one or more countries during the partner's next funding cycle, and the partner re-allocates funding it would have provided to those countries to fund LLINs to instead fund LLINs in different countries.112 We are concerned about this plan because we think it would be difficult to gain convincing evidence that the partner's total funding for LLINs had not been reduced. However, we think it is very unlikely that AMF will raise sufficient funding to move forward with this plan.
In 2017, AMF began requiring information for all distributions on how the country is spending its Global Fund malaria funding in the preceding and upcoming mass LLIN distributions, and what the other sources of funding are for the preceding and upcoming distributions.113 So far, we have seen reports from Uganda, Ghana, Guinea, and Papua New Guinea; we are waiting to receive a report from Malawi.114 The data we have seen so far, while incomplete, is consistent with the idea that AMF is not displacing Global Fund funding. We have summarized this information in this spreadsheet. In Uganda, Ghana, and Papua New Guinea, the portion of the total Global Fund grant (which is generally split between HIV/AIDS, malaria, tuberculosis, and health systems strengthening) that was allocated to work on malaria remained about the same in the period before and after AMF began funding LLINs in the country. The portion of total Global Fund malaria spending that was allocated to LLINs remained the same in Ghana and increased substantially in Uganda (27% to 40%) and Papua New Guinea (42% to 62%) in the period before and after AMF's involvement. In Guinea, there has not been a significant change in the proportion of total Global Fund funding allocated to malaria work or the proportion of malaria funding allocated to LLINs, but given that AMF's first large distribution in Guinea is scheduled to take place in 2019, we do not take this as very strong evidence about whether or not AMF will displace Global Fund funding in Guinea in the future.
Our conclusion on distribution size
We feel that the risk of displacing a large amount of funding using the approach in which AMF purchases all of the nets for one or more countries outweighs the benefits. We have requested that AMF use GiveWell-influenced funding to seek out gaps that other funders are unlikely to fill.
What portion of all net distributions are funded by AMF?
In 2016, 2017, and the first three quarters of 2018, approximately 473 million nets were distributed in sub-Saharan Africa. 54% of these nets were funded by the Global Fund, 25% were funded by the President's Malaria Initiative, and 8% were funded by UNICEF.115
AMF's contributions accounted for 17.1 million nets in 2016-2018 (this is less than the number of nets that AMF purchased; we have made an adjustment to account for the fact that AMF contributes the nets while other funders pay many of the other costs).116 Therefore, AMF's contribution during this period was about 3% of all nets distributed.117
AMF as an organization
We believe the Against Malaria Foundation to be a strong organization:
- Track record: We feel AMF has built up a strong track record of finding distribution partners and getting partners to report information publicly at an unusually high level.
- Communication: AMF has generally communicated clearly and directly with us and given thoughtful answers to our critical questions.
- Self-evaluation: AMF collects a large amount of relevant data about its programs, demonstrating a commitment to self-evaluation.
- Transparency: AMF has consistently been strong in its commitment to transparency. It has provided the information we’ve asked for and has not hesitated to share it publicly (unless it had what we felt was a good reason).
More on how we think about evaluating organizations at our 2012 blog post.
Sources
- 1
- See our Summary of AMF Distributions spreadsheet, "Overview" tab. Add up the "# LLINs" column for distributions including Zambia and rows below.
- In November 2018, AMF told us this figure should be 31 million LLINs; we have not analyzed the reason for this discrepancy. Rob Mather, AMF CEO, comment on a draft of this review, November 12, 2018.
- 2
- See our Summary of AMF Distributions spreadsheet, "Overview" tab, sum of the "# LLINs" column for distributions in rows 2-7.
- In November 2018, AMF told us this figure should be 20 million LLINs; we have not analyzed the reason for this discrepancy. Rob Mather, AMF CEO, comment on a draft of this review, November 12, 2018.
- 3
This understanding is based on many conversations with AMF, and from following AMF's progress over time.
- 4
This understanding is based on many conversations with AMF and its distribution partners, and from following AMF's progress over time.
- 5
- "This is a list of the countries with known gaps and where there are significant contiguous areas without nets, or a significant percentage required, and for which the estimate of need is believed to be reasonably accurate. It does not include countries where there are gaps, typically up to 40% of what the nation needs, but they are spread more uniformly across the country and would therefore require an ‘in-fill campaign’. An in-fill campaign is different from a so-called ‘universal coverage campaign’ because the percentage installed base of nets is higher in the former case and so a pre-distribution registration survey (PDRS) is an absolute requirement to ensure an efficient allocation of nets. Our methodology would lend itself to these campaigns if the relevant National Malaria Control Programme (NMCP) were to embrace a detailed PDRS. The list does not include, in our view, other countries where the need has not yet been quantified. Given there are many countries with needs estimated, we have not chosen to seek out other countries in need of nets. Our assumption is groups like AMP will be a source of reporting on additional countries as quantified needs emerge." Rob Mather, AMF Founder, email to GiveWell, August 8, 2012.
- In September 2015, we checked in with AMF about its process for determining in which countries it works. Rob Mather noted that AMF continues to review malaria prevalence data (where that data exists), although maintains a level of skepticism about that data given that it can be unreliable. Even so, AMF feels comfortable drawing conclusions about which countries have high malaria mortality burdens based on the data it sees and the conversations that it engages in. AMF checks the following sources to keep up-to-date on which countries have a significant malaria burden:
- The Alliance for Malaria Prevention, which sends out a weekly email with malaria-related data and information.
- The African Leaders Malaria Alliance (ALMA), which AMF has conversations with on a quarterly basis.
- In-country partners, who frequently attend malaria task force meetings and have recent news
- Members of malaria advisory groups
- Other connections
Before AMF decides to approach a country to offer funding for nets, it has many conversations to confirm the level of need that country has with the other actors that are working on malaria in the country. Rob Mather and Peter Sherratt, conversation with GiveWell, September 9, 2015
- In early 2016, AMF described a location-selection process similar to that described previously: "AMF learns about net gaps and receives funding requests through its network in the malaria control community, particularly through the Alliance for Malaria Prevention and the African Leaders Malaria Alliance." Rob Mather and Peter Sherratt, conversation with GiveWell, February 28, 2016
- 6
"As it becomes involved in larger distributions, AMF is receiving a growing number of funding requests. As its funding increases, AMF aims to make more strategic investments by engaging in the planning cycles of countries where it has strong connections and experience." Rob Mather and Peter Sherratt, conversation with GiveWell, February 28, 2016
- 7
Comment provided in response to a draft version of this review in November 2016.
- 8
Rob Mather, AMF Founder, conversation with GiveWell, July 19, 2012
- 9
Rob Mather, AMF Founder, email to GiveWell, August 8, 2012
- Ghana's National Malaria Control Program, one of AMF's distribution partners for the June-July 2016 distribution campaign in Ghana, described negotiating and compromising with AMF on requirements for the distribution:
- "The NMCP has been working with AMF for a relatively short period of time. Their working relationship has proceeded relatively smoothly thus far, especially since AMF has shown willingness to negotiate and compromise on some areas to conform with the country's specific scenario." GiveWell's non-verbatim summary of a conversation with Ghana's National Malaria Control Program, August 16-18, 2016
- 10
- 11
AMF told us that registration was previously carried out by AMF's distribution partners, but is now increasingly carried out by national health system staff. AMF's distribution partners continue to carry out monitoring of the registration process.
Rob Mather, AMF CEO, comment on a draft of this review, November 12, 2018.
- 12
- 13
- 14
"The validation was to establish precisely how many LLINs were distributed during the distribution campaign in all 12 districts. Apart from validating counterfoils, the validators undertook 'End-User Verification'. The end-user verification (EUV) is a rapid check-up to determine whether the beneficiaries really received the number of LLINs allocated for the households and are using the LLINs for the intended purpose. This involved randomly selecting 100 households in each district to verify LLINs received, LLIN use by household members, etc. Validators randomly sampled 100 booklets and from each booklet, randomly sampled one coupon counterfoil for the EUV visit. Validators then called the beneficiaries of the sampled coupon counterfoils and followed up to the households for the end-user verification exercise." Episcopal Relief & Development Ghana Activity Report 3 2016, Pgs 4-5.
- 15
AMF, comments on a draft of this review, November 12, 2018.
- 16
Rob Mather, AMF Founder, conversation with GiveWell, June 18, 2018
- 17
IDinsight, Recommendations for Post Distribution Monitoring Implementation
- 18
- 19
- The original budget for this study was $800,000. Rob Mather, AMF Founder, conversation with GiveWell, February 24, 2015
- AMF sent us a draft research proposal for the study in early 2015; some details are in our May 2015 update. AMF sent us what we believe was the final version of the research proposal in June 2015; we have not reviewed the final version. AMF insecticide research proposal from the London School of Tropical Medicine
- "Given the nature of the Uganda PBO study we have just last week decided to not proceed with Phase 2 of the DRC study. The total cost of Phase 1 was £75,667. Phase 1 looked at establishing where resistant mosquitoes were present in Nord Ubangi (they are) and Phase 2 was to look at the effectiveness of the PBO nets." Comment provided in response to a draft version of this review in November 2016.
- 1 GBP equals 1.25 USD. Google, November 21, 2016. 75,667 * 1.25 = $94,584.
- 20
- "We are close to concluding discussion with Concern Universal for AMF and CU to co-fund a Malaria Unit (a larger team of people than currently in place dedicated to malaria control related work) in Malawi led by a senior CU Manager and employing 12 Malawians (10 additional hires)." Rob Mather, AMF Founder, email to GiveWell, September 9, 2015
- AMF funds status (October 2017) Redacted
- 21
"The aim of this unit will be to provide more resource to allow 1. improved efficiency in managing the four contracted three-yearly distributions and associated work and 2. allow us to together innovate and develop additional malaria control support for the four districts and the NMCP, specifically: i) intended close liaising with Health Centre re malaria case data and elements related to the monitoring/recording of malaria data i.e. stock levels of RDTKs, rubber gloves and other diagnosis equipment; qualified staff able to test for malaria, presence at the clinic so diagnosis can happen; systems, capacities etc) ii) research (data), discussion and involvement in ways of ensuring 80% sleeping space coverage throughout the three year net-distribution cycle, including investigation of ‘injection strategy’ net distributions involving mini-mass distributions at two years post-distribution and in the subsequent distribution cycle at one-year post distribution." Rob Mather, AMF Founder, email to GiveWell, September 9, 2015
- 22
The distributions and post-distribution monitoring occur frequently enough that having a trained, consistent staff to manage them is worthwhile. Rob Mather and Peter Sherratt, conversation with GiveWell, September 9, 2015
- 23
- $736,000 was allocated to the Malaria [Control] Unit in AMF's funds status spreadsheet as of August 13, 2018 (AMF Funds status, August 2018), of which $699,000 was already paid. This allocation is about $300,000 higher than the amount AMF mentioned in our September 2015 conversation.
- "This would be an initial three year commitment from AMF of US$413k…Savings made on non-net costs (with the Malaria Unit funded, some costs included in non-net cost budgets would already be covered) we estimate to be of the order of US$70k, and perhaps as high as US$95k per distribution of which there are four in a three year cycle i.e. US$280-380k in total... If all progresses well we may be able to publish plans in the next six weeks once budgets have been agreed and assuming approval from the Malawi NMCP. We do not anticipate problems, although there is a work visa issue to resolve." Rob Mather, AMF Founder, email to GiveWell, September 9, 2015
- AMF Malaria Unit draft budget
- 24
- Rob Mather, AMF Founder, email to GiveWell, October 12, 2015
- In a conversation in June 2015, AMF told us that over the past several years, its high net hang-up rates had begun to catch the attention of a number of groups in Malawi, including the NMCP, local organizations that distribute nets, and large international NGOs. AMF also told us that it encouraged United Purpose to take a more active role in a task force on malaria control in Malawi. This meant that as interest in learning from AMF and United Purpose grew, United Purpose was available to explain AMF’s methodologies at the malaria task force meetings, and it was eventually decided to implement some of AMF’s practices for the upcoming distribution. Rob Mather and Peter Sherratt, conversation with GiveWell, June 2, 2015
- 25
In a conversation on March 5, 2018, AMF told us that for the national LLIN distribution in 2018, it was unclear whether any of its proposed practices would be adopted outside of the areas in which it was funding LLINs.
- 26
For calculations, see this spreadsheet.
- 27
Rob Mather, AMF Founder, conversation with GiveWell, July 19, 2012.
- 28
- Rob Mather, AMF Founder, email to GiveWell, November 26, 2014.
- See this spreadsheet for details on what costs AMF has paid for each distribution.
- For its 2016 Ghana distributions and its upcoming distributions in Uganda, Togo, and Papua New Guinea, AMF has agreed to pay for "non-standard" non-net costs, including PDMs and, in Uganda, the cost of an "independent assessor [who will] determine whether nets are distributed to beneficiaries in the quantities listed." The Global Fund paid for the "standard" non-net costs for the Ghana distributions and the government is paying for these costs in Uganda. "Standard" costs include shipping to the country, clearance charges, in-country transportation, pre-distribution planning and registration, and distribution costs.
- Rob Mather, AMF Founder, email to GiveWell, January 28, 2016
- "The Ghana distribution is now going ahead: AMF is funding the costs of the nets and AMF’s additional monitoring costs, and the Global Fund will fund other non-net costs." Rob Mather and Peter Sherratt, conversation with GiveWell, February 11, 2016, pg. 2.
- "The non-net costs will be funded by the Ghana Malaria Global Fund Grant. These costs include those for shipping to Ghana, clearance, in-country transport, pre-distribution, distribution." AMF Ghana 2016 distribution agreement, pg. 1.
- "The non-net costs will be funded by the Uganda Ministry of Health which may use funding from its Roll Back Malaria Partners. These costs include those for shipping to Uganda, clearance, in-country transport, pre-distribution, and distribution." AMF Uganda 2016 distribution agreement, pg 2.
- Discussion of independent assessor is from AMF Uganda 2016 distribution agreement, pg 4.
- "Post-Distribution Check-Ups… AMF will fund an NGO to run the process." AMF Uganda 2016 distribution agreement, pg 5.
- AMF Togo 2017 distribution agreement Redacted:
- "1) AMF will fund 2,413,250 LLINs.
2) The non-net costs will be funded by the MSPS which may use funding from The Global Fund or other sources." Pg 7. - "Post-Distribution Check-Ups (PDCUs) will take place across all of the districts to monitor net use and condition. The results will be owned by Togo and shared with AMF. AMF will fund an NGO to run the process in full consultation with the MSPS. The MSPS will facilitate the check-ups." Pg 10.
- "1) AMF will fund 2,413,250 LLINs.
- AMF Papua New Guinea 2017 distribution agreement Redacted:
- "1) AMF will fund 1,159,400 extra-large LLINs for distribution in 2017.
2) The costs, with the exception of the purchase of the LLINs, will be borne by RCPM which may use dedicated funding from The Global Fund and other sources." Pg 1. - "Post-Distribution Check-Ups (PDCUs) to assess correct net distribution, net use and condition of LLINs will take place across all of the districts to monitor net use and condition. The results will be owned by PNG but will be shared with AMF. AMF will fund a yet-to-be-decided NGO to run the process in full consultation with the NDoH and RCPM. RCPM will facilitate the check-ups." Pg 4.
- "1) AMF will fund 1,159,400 extra-large LLINs for distribution in 2017.
- 29
See our summary of post-distribution monitoring (PDM) results (the follow-up surveys) here.
- 30
- For example, from this spreadsheet:
- AMF supported distributions in Malawi in 2012-2014 and 2015-2016 and plans to support the next distribution in 2018.
- AMF supported distributions in Ghana in 2016 and plans to support the next distribution in 2018. In the notes from our site visit to Ghana in 2016, we noted, "Everyone we talked to had previously owned bed nets before this distribution. Most had been procured through the area's last mass distribution four years ago, but some had been purchased or received from a clinic more recently." Pg 17.
- AMF supported distributions in Uganda, Togo, and Zambia in 2017. AMF told us that the next distribution in each country is planned for 2020. (Unpublished, non-anonymized version of the information in this spreadsheet, sheet "Spending opportunities.")
- We estimate that an LLIN lasts on average 2.22 years. See this page for details.
- For example, from this spreadsheet:
- 31
- We discuss the evidence for whether households purchase LLINs in the private market on this page. Note that this evidence is largely from before donors scaled up mass LLIN distributions, and it is possible that there is now more willingness to pay for LLINs given greater experience with the benefits of LLINs and/or, perhaps, lower cost of LLINs or higher incomes from economic growth. Our guess is that mass campaigns generally create the expectation of free LLINs and decrease households' willingness to purchase them.
- In the notes from our site visit to Ghana in 2016, we noted, "Everyone we talked to had previously owned bed nets before this distribution. Most had been procured through the area's last mass distribution four years ago, but some had been purchased or received from a clinic more recently." Pg 17.
- 32
Discussion of the registration process used in each country is on our page with additional, detailed information on AMF.
- 33
Comment provided in response to a draft of this page in November 2017.
- 34
Rob Mather, conversation with GiveWell, June 18, 2018.
- 35
- "Continued use of nets is very important. Every six months, a post-distribution survey is carried out to assess net usage and net condition. Approximately 5% of the nets distributed are assessed through visits to randomly selected households. The data collected are used to determine if additional community-level malaria education activities are required. All data are published." AMF information we publish
- From a recent distribution agreement:
- "Post-Distribution Check-Ups (PDCUs) will take place across all of the districts to monitor net use and condition.
[…]
A PDCU is carried out every 6-months for two and a half years' post-distribution therefore at 6, 12, 18, 24 and 30-months post-distribution." AMF Togo 2017 distribution agreement Redacted, Pg 4, English version (Pg 10 in PDF).
- "Post-Distribution Check-Ups (PDCUs) will take place across all of the districts to monitor net use and condition.
- In older distribution agreements it appears that AMF planned to require PDMs for longer than 2.5 years following a distribution:
- "Please confirm you will carry out Post‐Distribution Surveys (PDSs) every 6 months post‐distribution for a period of up to four years to assess the level of net usage (hang‐up %), correct usage and condition of the nets and you will provide us with the findings. Each survey would cover approximately 5% of households." Concern Universal Dedza 2014 distribution proposal, pg. 2.
- Note that going forward, AMF plans to conduct PDMs beginning at 9 months rather than 6 months. AMF reporting schedule as of July 11, 2018
- 36
- LLINs are categorized as "Hung," "Present but not hung," "Missing," or "Worn out / not usable." See, for example, Ntcheu 2016 6-month post-distribution check-up data
- A United Purpose representative told us that PDM enumerators assess whether the net is an AMF net by looking at the net's label. Nets sourced from AMF distributions have AMF's logo and the month and year of the intended distribution date on the label. Nelson Coelho, conversation with GiveWell, April 15, 2016
- In its report on the 6-month PDM for the Ntcheu 2015 distribution, AMF notes that the rate of LLINs from the recent distribution hung is lower than for other distributions, and discusses a few possible explanations for the low rate:
- "This is the second universal coverage distribution in Ntcheu, with the first taking place in December 2012, a little over four years before."
[…]
Initial hypotheses for data from this PDCU-06:
Hypothesis 1: Timing differences between the 2012 PDCU-06 and the 2016 PDCU-06 mean there is a seasonal variation (e.g. linked to mosquito levels and average temperatures)
Hypothesis 2: The previously distributed nets have lasted beyond the normal three years life and some of the new nets are being held in reserve to replace them when worn out.
Hypothesis 3: Our criteria for assessing, prior to a mass distribution, which nets are ‘perfectly usable’ (have at least 18 months of life left) is too strict and materially more nets than we are judging to be so have extended life in them." Ntcheu 2015 6-month post-distribution check-up report, Pg 4.
- "This is the second universal coverage distribution in Ntcheu, with the first taking place in December 2012, a little over four years before."
- AMF provided further information in its comments on a draft of this review in November 2018: "The lower hang up rates were due to nets from the previous mass distribution still being viable and therefore lower than normal proportion of the most recently distributed nets needed to be hung but, as time passed, more of the recently distributed nets were hung as the remaining previously distributed nets wore out – and hence the higher hang up percentages later. AMF further note[s] that the percentages for overall sleeping space coverage remained higher throughout this period."
- 37
The blog post discusses the first two surveys from Kasaï-Occidental. We have now seen results from the 18-month survey as well. There appear to have been similar issues with the implementation of the 18-month survey. About half of the data was thought to be unreliable: "# of HHs [households] where net presence data is reliable: 6,330 (45% of HHs visited)" DRC Kasaï-Occidental 2014 18-month post-distribution check-up data (English summary), pg. 1
- 38
See this spreadsheet.
- 39
- 40
- 41
IMA World Health, Kasaï-Occidental 2014 distribution report:
- "1. Household registration, handing out and hanging nets (3 days)" Pg 16.
- "CHWs take the time to introduce themselves to the head of household and explain the reason for their visit in order to gain the householders’ permission to collect the required household information, distribute and hang the nets." Pg 17.
- 42
- IMA World Health Nord Ubangi 2015-16 registration data:
- Summary data reported for "Nbre de menages," "Population dans menage," "Nbre places a dormir," "Nbre bonne MILD," "Nbre MILD installees," and "Couverture."
- Translated to English, from Google Translate: "No. of households," "Population in household," "No. of places to sleep," "No. good MILD [LLIN]," "No. MILD [LLIN] be built [installed, or hung]," and "Coverage."
- Household-level data for these categories also included.
- IMA World Health Nord Ubangi 2015-16 registration data:
- 43
- "Distributors make sure the recipients' coupons (brought by recipients) match the registration copies (brought by distributors) and make a mark on each side. The recipient's coupon is returned to them. Distributors also have a tally sheet with rows of 5 bubbles, and mark off a bubble for every net they give out." GiveWell's notes from a site visit to a bed net distribution program funded by the Against Malaria Foundation in Greater Accra, Ghana, August 15-18, 2016, pg. 9.
- AMF has shared all registration data collected from each of the three regions it has funded distributions in with us.
- AMF Data Entry System, Ghana 2017
- The full registration data we have seen in AMF Data Entry System, Ghana 2017 includes data on "# LLINs allocated" and "# LLINs given."
- 44
- 45
See our March 2012 update on AMF.
- 46
All weekly reports at AMF page on Balaka 2013 distribution. Examples of problems reported:
- "The exercise despite the verification process and data cleaning faced some duplicates that were discovered during the distributions. The duplicate situation had not been dealt with during data cleaning as it was deemed only when both villages were asked to collect nets from the same distribution point that it became clear that there had been duplicate entries. However, different distribution points at the same time though at the same cluster makes it practically impossible for villagers to collect two nets from different sites by double registering." Concern Universal Balaka 2013 week 1 report, pg. 1.
- "There was a high number of absenteeism during the urban distribution, which resulted in some members receiving the nets on behalf of others. This absenteeism was explained by the unavailability of the beneficiaries due to professional reasons. There were some complaints from beneficiaries whose nets were received by representatives claiming that the nets weren’t handed over. Handing over of nets to representatives was cancelled since it was clear that, unlike in rural areas where all community members know each other and certify the representative’s identification and the nets were handed over to the legitimate beneficiaries, nets were being misappropriated... For the urban distributions we anticipate to conduct them during the weekend to assure that most of the household owners are free from their daily work related activities." Concern Universal Balaka 2013 week 5 report, pgs. 1-2.
- "One health worker assigned to facilitate the distribution process, in the community under his supervision, was caught by the beneficiaries trying to steal about 25 nets. He was reported to the authorities and discharged of his duties. This episode disrupted the distribution process and CU staff had to intervene to keep the population from beating the health worker." Concern Universal Balaka 2013 week 5 report, pg. 2.
- 47
All weekly reports at AMF page on Dedza 2014 distribution. Examples of problems reported:
- "The major challenge encountered during this week’s distributions was the misplacing of villages in clusters, which required us to the transfer the nets and distribution registers to the clusters where the villages have presented themselves. This delayed our distribution process but we still managed to reach and carry out the distributions to the affected villages." Concern Universal Dedza 2014 week 1 report, pg. 2.
- "There were 20 villages under Kaphuka that did not receive the nets because of poor communication as their HSAs were attending performance appraisals and failed to communicate the distribution dates to their respective villagers." Concern Universal Dedza 2014 week 3 report, pg. 1.
- "The major challenge during the week was duplication of registration in a way that some beneficiaries seem to have been deliberately registered in more than one village. The registration data was corrected and the affected beneficiaries only received the nets they were entitled to according their respective village data." Concern Universal Dedza 2014 week 3 report, pg. 2.
AMF notes these issues and an additional issue on its blog, "An isolated incident of 300 nets missing from one storage location. This is being investigated and pursued with the police as any nets missing is taken very seriously. 300 nets represents 0.12% of the total nets being distributed." AMF: "Mid-distribution weekly reports for Dedza distribution, Malawi"
- 48
"Mid-distribution Weekly Reports" at AMF page on Dowa 2015 distribution cover the first 184,554 nets distributed out of a total of 396,900 nets. Examples of problems reported:
- "The major challenge we encountered during the distribution was the breaking down of our distribution vehicles, which forced us to interrupt the distribution for almost one month to have them fixed, as some spare parts could not be sourced locally." Concern Universal Dowa 2015 weeks 1-3 report, pg. 2.
- "Some beneficiaries didn’t show up as they were attending a clothing items distribution on the same day. The fact that most inhabitants of the said villages are refugees from Rwanda, Burundi or Somalia caused identification challenges, preventing individuals claiming nets on behalf of the beneficiaries from receiving the nets. These beneficiaries will be considered during the mop up exercise." Concern Universal Dowa 2015 weeks 1-3 report, pg. 3.
- "Distributions were not conducted in ten of the planned villages under the three health facilities due to funerals hence we deferred distribution and managed to reach ... 493 of the 503 planned villages. However, arrangements will be made at a later date when we will reach them and conclude the distributions in the deferred villages hence their nets have been currently taken back to the warehouse for safe keeping. The above mentioned villages are: Msaka, Kancheri, Chimbalanga Mononga and Nkhota villages from Mtengowanthenga health facility with, respectively, 20, 100, 201, 91 and 49 nets returned; Masiya, Sintala 2, Mulode 2 and Mgoli from Dzoole health facility with a nets requirement of 42, 274, 26 and 84 nets respectively and Mphinda village under Kayembe health facility with a requirement of 140 nets." Concern Universal Dowa 2015 weeks 1-3 report, pg. 5.
- 49
“AMF has provided regular, public updates on the large, ongoing net distribution in the Ntcheu district of Malawi. Expected data collection has occurred and the distribution has proceeded close to schedule. AMF's distribution partner, Concern Universal, has been transparent about problems it has encountered, and seems to have a robust process to catch problems (such as attempts to steal nets) when they arise.” See our March 2012 update on AMF.
- 50
- 51
- Episcopal Relief & Development Pre-distribution Report Ghana Northern Region June 2016
Episcopal Relief & Development Pre-distribution Report Ghana Upper West Region December 2016
Episcopal Relief & Development Pre-distribution Report Ghana Greater Accra Region December 2016 - Episcopal Relief & Development Ghana Activity Report 1 2016
- Episcopal Relief & Development Ghana Activity Report 2 2016
- Episcopal Relief & Development Ghana Activity Report 3 2016
- Episcopal Relief & Development Ghana Activity Report 4 2016
- Episcopal Relief & Development Ghana Activity Report 5 2016
- Episcopal Relief & Development Ghana Activity Report 6 2016
- Episcopal Relief & Development Ghana Activity Report 1 2017
- Episcopal Relief & Development Ghana Activity Report 2 2017
- Episcopal Relief & Development Ghana Northern Region distribution report 2016
- Episcopal Relief & Development Pre-distribution Report Ghana Northern Region June 2016
- 52
Examples of problems encountered:
- Episcopal Relief & Development Pre-distribution Report Ghana Northern Region June 2016:
- "Some challenges noted [in pre-distribution activities in the Northern Region] include:
- Late submission of summary of sub-districts data to district for collation
- Large numbers of booklets to validate
- Poor telephone network making it difficult to reach some of the volunteers who had issues with some coupons and needed to get to the sub-district to clarify and if necessary go back to the households to make corrections to the registration or to re-register.
- Difficulty in reaching Mankarigu, a hard-to-reach sub-district across the White Volta River. The team had to travel across five districts to get to Mankarigu.
Some actions taken to resolve some of the above challenges included:
- With the delay in the submission of sub-districts data, the team continued to move to the sub-district and start the validation of the coupons whilst still waiting for the summary of sub-districts data.
- The validation team (including ADDRO staff) visited the communities to ascertain the veracity of the information captured on the coupons especially household sizes ranging from 15 to 20
- The households with large household sizes were re-registered to reduce the sizes of the households and the earlier coupons issued were retrieved and replaced with new coupons." Pgs 14-15.
- "Some challenges noted [in pre-distribution activities in the Northern Region] include:
- Episcopal Relief & Development Ghana Activity Report 1 2016:
- "The distribution activity itself has taken place in the Northern region and reportedly went well. While complete details will be presented in the September Distribution Report, some initial, key observations made during the monitoring of the LLIN point distribution exercise included the following:
- Some distribution points had issues with crowd control but were able to resolve them by forming and maintaining queues
- Some registered beneficiaries rejected nets given to them on the basis that each household member should be given one net. Although the universal coverage strategy was explained to the crowds some still rejected the LLINs given to them.
- Other households who missed out on the registration exercise turned up at some distribution points demanding nets but were not able to be served due to the protocols of pre-registration.
- A few household members discovered the distribution strategy (universal coverage formula) and changed their household sizes/numbers on the coupon ostensibly to receive more nets than originally allocated so each HH member gets a net. However, this was easily found out and corrected as the distribution point attendants checked the counterfoils with the coupons submitted by the households." Pg 7.
- "The distribution activity itself has taken place in the Northern region and reportedly went well. While complete details will be presented in the September Distribution Report, some initial, key observations made during the monitoring of the LLIN point distribution exercise included the following:
- Episcopal Relief & Development Ghana Activity Report 3 2016:
- "The Ashaiman and Ningo Prampram districts had significant numbers of nets not redeemed. For example, Ashaiman had 127 bales (12,700 pieces) at the District Health Directorate not distributed. The reasons given were that during the distribution in July, there was a LLIN shortage (because the districts had not received all their nets) so later when the districts finally had their nets, beneficiaries did not turn up to claim them. The GHS staff had called most of the beneficiaries per the contact numbers in the coupon counterfoils but only few came for the LLINs. This issue was reported to NMCP to take action." Pg 5.
- Episcopal Relief & Development Pre-distribution Report Ghana Northern Region June 2016:
- 53
- Uganda:
- Togo: AMF Distribution Report, Togo, 2017
- Papua New Guinea:
- AMF Distribution Report, Chimbu, Papua New Guinea, 2018
- AMF Distribution Report, East Sepik, Papua New Guinea, 2017
- AMF Distribution Report, Eastern Highlands Province, Papua New Guinea, 2017
- AMF Distribution Report, Jiwaka, Papua New Guinea, 2018
- AMF Distribution Report, Madang, Papua New Guinea, 2017
- AMF Distribution Report, Morobe, Papua New Guinea, 2017
- AMF Distribution Report, Sandaun, Papua New Guinea, 2017
- AMF Distribution Report, Western Highlands Province, Papua New Guinea, 2018
- Zambia:
- 54
- "The distribution went very well in Madang except for an incident where one of the RAM officer was beaten by drunkards in Bogia. This delayed operations for some time while this issue was resolved. Otherwise the distribution programme was carried out without any real difficulties apart from the usual poor infrastructure and bad weather." AMF Distribution Report, Madang, Papua New Guinea, 2017, Pg 3.
- "There were overspends in all categories but one aspect caused the greatest cost which is unbudgeted that it was necessary to get full security on the containers of nets as it was estimated that there was a big security risk and good chance that the containers would have been broken into if they had not been protected by a Security company. This cost alone added another 9% to the budget." AMF Distribution Report, East Sepik, Papua New Guinea, 2017, Pg 3.
- "In the previous LLINs distribution of Round Three in 2006 t0 2010, nets were allocated at a rate of one net to every 2.5 people. With the programme only receiving 80% of needs, and most provinces distributing for example two nets to families of three, in practically every province, nets ran out before the end of the distribution. The RAM programme makes all attempts to assure that this does not happen by collecting all population information first and then allocating the nets based on needs as well as availability of nets to ensure that all families receive nets throughout any given province. The only scenario where survey and net distribution may be simultaneous is in very remote locations where it is not practical to return a second time." AMF Distribution Report, Eastern Highlands Province, Papua New Guinea, 2017, Pg 6.
- "Overall, the distribution went very well in Western Highlands with no problems. The only major issue was that the border between Mount Hagen Rural and Mount Hagen Urban join each other and it is difficult in places to know where one stopped and the other started. Therefore it is believed that some people from the Urban Area managed to get themselves included in the distribution which resulted in higher than expected population. However, high growth rates are also possible as Mount Hagen (both Rural and Urban) are an area of major growth to which people from other parts of the highlands come to settle." AMF Distribution Report, Western Highlands Province, Papua New Guinea, 2018, Pg 3.
- "There was a shortfall of 232,144 LLINs to reach all households as per household registration." AMF Distribution Report, Eastern Province, Zambia, 2017, Pg 9.
- "No established structures for data management. This resulted into loss and/or misplacement of HHR forms. Accordingly, some forms were not entered into the HHR database resulting into production of unreliable data which was utilized for allocation of LLINs. Consequently, the number of LLINs delivered to wave 2 districts were mostly less than the expected number hence requiring to-ups." AMF Distribution Report, Eastern Uganda, Wave 2, 2017, Pg 19.
- In Togo, distribution partners experienced insufficient funds for social mobilization ("Insuffisance de budget pour la mise en œuvre des activités de mobilisation sociale") and difficulty with the mobile money network used (e.g., "Les numéros de téléphone sont saisis avec des erreurs qui créent des déperditions de paiement par T MONEY"). AMF Distribution Report, Togo, 2017, Pg 33.
- 55
"Our distribution of 676,000 nets in Kasaï-Occidental in partnership with IMA World Health (IMA) is our first one using smartphone technology for data collection. We see this as an exciting development with significant potential benefits including:
- Acts against potential theft
- Improved accountability
- Greater transparency
- Greater data accuracy
- Improved cost effectiveness
- Additional data can be collected
- Reduced operational risk
The use of this technology may become a significant determinant of future net distributions that we fund. We will report publicly on our experience with the Kasaï-Occidental 2014 distribution and the data gathered…
GPS information can also be gathered helping to locate households and tie the number of nets delivered to each." AMF: "Introduction of smartphone technology to collect distribution data" - 56
IMA World Health, Kasaï-Occidental 2014 distribution data
- 57
IMA World Health Nord Ubangi 2015-16 registration data
- 58
- Episcopal Relief & Development Ghana Activity Report 3 2016:
- "The validation was to establish precisely how many LLINs were distributed during the distribution campaign in all 12 districts. Apart from validating counterfoils, the validators undertook 'End-User Verification'. The end-user verification (EUV) is a rapid check-up to determine whether the beneficiaries really received the number of LLINs allocated for the households and are using the LLINs for the intended purpose. This involved randomly selecting 100 households in each district to verify LLINs received, LLIN use by household members, etc. Validators randomly sampled 100 booklets and from each booklet, randomly sampled one coupon counterfoil for the EUV visit. Validators then called the beneficiaries of the sampled coupon counterfoils and followed up to the households for the end-user verification exercise." Pg 4-5.
- "24 NMCP validators were assigned to work in the 12 AMF supported districts (2 validators per district). Two teams from ADDRO (a team from the ADDRO HQ and a team from the ADDRO Greater Accra office) visited all the 12 AMF districts to monitor the validation process and to provide support for the packaging of coupon counterfoils for transportation to ADDRO headquarters in Bolgatanga. Key findings were as follows:
- It was comparatively easier for the validators/monitoring team to enter into bedrooms/sleeping places of beneficiaries in the rural areas to inspect or observe net usage (LLINs hanging and being used) than it was in the urban areas. Residents in the urban areas felt very reluctant to allow ‘strangers’ to observe their sleeping places.
- The Ashaiman and Ningo Prampram districts had significant numbers of nets not redeemed. For example, Ashaiman had 127 bales (12,700 pieces) at the District Health Directorate not distributed. The reasons given were that during the distribution in July, there was a LLIN shortage (because the districts had not received all their nets) so later when the districts finally had their nets, beneficiaries did not turn up to claim them. The GHS staff had called most of the beneficiaries per the contact numbers in the coupon counterfoils but only few came for the LLINs. This issue was reported to NMCP to take action."
Pgs 4-5.
- "In the Greater Accra, post-distribution validation tracing was implemented for a random sample of households. The same process is planned for the Upper West Region. The Global Fund imposed this requirement." GiveWell's notes from a site visit to a bed net distribution program funded by the Against Malaria Foundation in Greater Accra, Ghana, August 15-18, 2016, pg. 10.
- Episcopal Relief & Development Ghana Activity Report 3 2016:
- 59
Comment provided in response to a draft version of this review in November 2016.
- 60
AMF lists the countries it has provided nets to at @AMF Countries Involved@. The Malaria Atlas Project has compiled data on malaria risk by location at Malaria Atlas Project Endemic countries.
- 61
- 62
- WHO 2014 Malaria World Report, pg. 37, Figures 8.6 and 8.7.
- An additional source of data on malaria deaths in these countries is the Institute for Health Metrics and Evaluation's (IHME) Global Burden of Disease tool. IHME Global Burden of Disease tool:
- 95.3 malaria deaths per 100,000 people in DRC in 2015 (95% confidence interval: 62.42 to 135.06).
- 68.61 malaria deaths per 100,000 people in Malawi in 2015 (95% confidence interval: 41.28 to 103.36).
- 52.81 malaria deaths per 100,000 people in Ghana in 2015 (95% confidence interval: 28.6 to 81.65)
- 41.5 malaria deaths per 100,000 people in Uganda in 2015 (95% confidence interval: 18.99 to 68.58).
- 99.27 malaria deaths per 100,000 people in Togo in 2015 (95% confidence interval: 70.93 to 132.55).
- 15.43 malaria deaths per 100,000 people in Papua New Guinea in 2015 (95% confidence interval: 9.44 to 24.59).
- 63
- "Continued use of nets is very important. Every six months, a post-distribution survey is carried out to assess net usage and net condition. Approximately 5% of the nets distributed are assessed through visits to randomly selected households. The data collected are used to determine if additional community-level malaria education activities are required. All data are published." AMF information we publish
- Example from a distribution proposal: "Please confirm you will carry out Post‐Distribution Surveys (PDSs) every 6 months post‐distribution for a period of up to four years to assess the level of net usage (hang‐up %), correct usage and condition of the nets and you will provide us with the findings. Each survey would cover approximately 5% of households." Concern Universal Dedza 2014 distribution proposal, pg. 2.
- AMF has to be flexible about the timing of PDMs because often there are delays that cannot be prevented. If a PDM is delayed, the next PDM will occur on schedule (e.g. even though the Dedza 2014 distribution's first PDM was done at 8 months, the next PDM occurred at 12 months), unless the delay was severe enough that sticking to the schedule would not make sense (as happened with the Ntcheu 2012 PDMs). Although AMF originally planned to request PDMs for four years after a distribution, this doesn't make sense in some contexts where it is required that a mass distribution of LLINs occurs at least every 3 years (such as Malawi). Rob Mather and Peter Sherratt, conversation with GiveWell, September 9, 2015
- PDMs will be done every 9 months for newer distributions. AMF reporting schedule as of July 11, 2018
- 64
We have seen examples of the random selection used for the Ntcheu 2015 18-month and the Balaka 2015 18-month PDMs and for several of the PDMs that have taken place in Ghana.
- 65
See this blog post for more details on non-random sampling in past post-distribution surveys in Malawi.
- 66
For example, "After the HSAs have collected data from all villages, spot-checkers independently collect the same data from 5% of households in each village...
The two sets of data are entered into a Microsoft Access database separately. Reconciliation of the data is done after data entry." GiveWell's non-verbatim summary of a conversation with Nelson Coelho, April 15, 2016. - 67
Rob Mather, AMF Founder, email to GiveWell, October 31, 2016.
- 68
The blog post discusses the first two surveys. More recently, AMF shared a summary of the 18-month survey that notes that about half of the data was discarded due to inconsistencies: "# of HHs [households] where net presence data is reliable: 6,330 (45% of HHs visited)", DRC Kasaï-Occidental 2014 18-month post-distribution check-up data (English summary), pg. 1
- 69
Enumerators were trained to observe nets, shown what to look for with respect to the net and how the respondent hangs it. In practice, this was found to be lacking. Not all enumerators seemed to follow best practice of checking the net themselves. Of those that do check the net, they may not always ask the respondent to demonstrate how they hang the net if it is not already hung. Radhika Lokur, IDinsight, email to GiveWell, November 1, 2017.
- 70
"ERD & ADDRO ask AMF for a 0.5% larger sample selection for the PDCU because they tend to discard inconsistent data during the data entry phase. For e.g. if the paper PDCU is hard to read or has been marked up badly or has numbers missing / don't add up -- the form is discarded, with no record of why or how many forms they discard. This affects the randomness of the sample selection as there could be a particular set of responses that are getting thrown out." Radhika Lokur, IDinsight, email to GiveWell, November 1, 2017.
- 71
- See all results compared to the predictions of the decay rate model in this spreadsheet, "Decay rate comparison" sheet.
- "This is the second universal coverage distribution in Ntcheu, with the first taking place in December 2012, a little over four years before.
[…]
Initial hypotheses for data from this PDCU-06:
Hypothesis 1: Timing differences between the 2012 PDCU-06 and the 2016 PDCU-06 mean there is a seasonal variation (e.g. linked to mosquito levels and average temperatures)
Hypothesis 2: The previously distributed nets have lasted beyond the normal three years life and some of the new nets are being held in reserve to replace them when worn out.
Hypothesis 3: Our criteria for assessing, prior to a mass distribution, which nets are ‘perfectly usable’ (have at least 18 months of life left) is too strict and materially more nets than we are judging to be so have extended life in them." Ntcheu 2015 6-month post-distribution check-up report, Pg 4. - "The data collected show the level of sleeping space coverage with nets that were distributed during April 2015 was 81%.
We expected this figure to be about 5 to 10 percentage points higher.
Data for the proportion of all sleeping spaces covered shows that 85% are covered. This suggests that some sleeping spaces may be covered with nets not distributed during the mass campaign. If so, these are likely to be nets distributed in the prior campaign (few, we estimate) and some nets distributed via routine mechanisms e.g. ante-natal clinics (most, we estimate).
We do not have further information or data on a likely split. The level of nets present but not hung is 15%. Normally we see levels around 4-8%. This suggests householders may not be using new nets as they still have acceptable older nets. We will consider what further information we could gather to understand if a) newer nets are being held back due to being not needed (and what the implication, if any, that has for the assessment at the time of distribution of household net need and the presence of ‘perfectly usable nets’.); and/or b) whether all sleeping spaces that should be covered (ones being slept in) are not being covered and there is a need to encourage greater hang-up." Dowa 2015 6-month post-distribution check-up report, Pg 4.
- 72
- "Usage does not appear to have been near-universal. Most studies report usage rates in the range of 60-80%, though some report 90%+ usage." From our page on Long Lasting Insecticide Treated Nets.
- Note that the World Malaria Reports that we looked at showed similar usage rates.
- 73
- "Alliance for Malaria Prevention 2011 lays out a model for estimating the number of LLINs still in use after distributions: 'the number of LLINs already distributed over the last three years and considered to be available in households should be calculated and subtracted from the total need, working with a decay rate of 8 per cent at one year (0-12 months), 20 per cent at two years (13-24 months) and 50 per cent at three years (25-36 months).'…
Bottom line: We believe that the "8%-20%-50%" model is the most widely used and most reasonable approximation available at the moment for capturing the extent to which LLINs remain in use in the years following distribution, accounting for any factors that might cause LLINs to be discarded or additional LLINs to be purchased. It implies an average of 2.22 years of use for each LLIN distributed. Data and analysis on this topic appears extremely thin; we have little sense for how long LLINs last in practice." - "If we assume that an LLIN has a 92% chance of being in use at a given point in the first year after distribution, this implies that for each LLIN delivered, an average of 0.92 LLIN-years of use are obtained in the first year. Assuming 0.92 LLIN-years of use in the first year, 0.8 in the second year and 0.5 in the third year would yield an overall average of 2.22 years of use per LLIN. This is substantially less than the "official life" of an LLIN. As discussed below, we believe this makes sense because the decay function is intended to account for wastage of all kinds, including loss/failed delivery of LLINs, improper use resulting in disrepair, etc."
- "Alliance for Malaria Prevention 2011 lays out a model for estimating the number of LLINs still in use after distributions: 'the number of LLINs already distributed over the last three years and considered to be available in households should be calculated and subtracted from the total need, working with a decay rate of 8 per cent at one year (0-12 months), 20 per cent at two years (13-24 months) and 50 per cent at three years (25-36 months).'…
- 74
This is an understanding formed over many conversations.
- 75
Rob Mather and Peter Sherratt, AMF Founder and Executive Chairman, conversation with GiveWell, June 18, 2018
- 76
"Health Surveillance Assistants (HSAs) are Government extension workers- they are the lowest tier of government presence in the decentralized health system." Robin Todd, Concern Universal Malawi Director, email to GiveWell, April 27, 2012.
- 77
"As such they are the first line of response to any public health issues in communities. Their job involves disseminating health related information (such as encouraging people to make use of sanitary facilities, go for immunizations, sleep under mosquito nets etc.), carrying out sanitation and hygiene campaigns and sending data on take-up of facilities to the District Council, conducting basic nutrition support, weighing children and reporting levels of stunting and wasting, detecting common communicable diseases and reporting these to clinicians and other health providers, implementing immunization campaigns etc. As you can see being involved in universal net distribution fits very well with their core public health responsibilities. HSAs need to have a primary school completion certificate as a minimum but the majority of them will have O-Levels (exams sat by pupils aged 16 if they have completed the school system at the recommended pace). Once they have been selected as HSAs they are sent on an initial 9 months intensive training course where they will be trained in many aspects of public health including how to recognize common diseases, how to administer immunizations etc." Robin Todd, Concern Universal Malawi Director, email to GiveWell, April 27, 2012.
- 78
- Pre-distribution registration surveys appear to be completed relatively quickly: "Approximately 480 personnel will be involved in the PDRS, with the majority, some 460, involved for 5-7 days over the data collection period." Concern Universal, Dowa 2015 planning document, pg. 4.
- In the Ntcheu 2012 distribution, the verification of PDRS data took several weeks: "The verification process took the verification team of 10 members 18 days to complete and in a day 20 clusters were verified with 10 verification sites in the morning and 10 verification sites in the afternoon." Concern Universal Ntcheu 2012 distribution report, pg. 7.
- In the Ntcheu 2012 distribution, distributions were scheduled for several weeks, but covered approximately 10 "clusters" per day: "The distributions were scheduled to have been concluded within 28 days with the team distributing at 10 clusters per day covering five weeks." Concern Universal Ntcheu 2012 distribution report, pgs. 7-8.
- United Purpose has recently started to use fewer staff for post-distribution check ups, which causes them to take somewhat longer: "However, in collaboration with the District Environmental Health Office (DEHO) and Malaria Coordinator (MC) and lessons lea[r]nt from 24 month Ntcheu PDCU, it was recommended to have a focused team of 10 data collectors rather than have the HSAs as data collectors from each HCA. This was based on the following reasons. First, this would reduce the number of data collectors that would need to be monitored and trained. Second, we would be able to select reliable individuals whom we could trust to do a diligent and accurate job of collecting the data. Third, it would leave the majority of HSAs to carry on with the normal health tasks and duties. Fourth, by having the same people covering the whole exercise they will get acquainted to the task and reduce errors on data collection. This meant the data collectors would spend thirty seven days collecting data rather than the one or several days if many more data collectors were to be used. This was judged the preferable way of organising and managing the data collection phase." Concern Universal Ntcheu 2012 33-month post-distribution check-up report, Pg 5. Other recent post-distribution monitoring reports have similar language.
- 79
"i) Field Supervisors (FSs)
22 FSs were selected from permanent and senior health staff in Tshikapa Health District.
ii) Community Health Workers (CHWs) – data collectors
Each of the 22 FSs had the responsibility of recruiting, in each HA they were designated, enough CHWs to gather household data and hang nets. Two primary recruitment criteria were literacy and familiarity with using a mobile phone. The number of CHWs recruited depended on the size of the HA and the number of households to be visited. The aim was to recruit enough CHWs to carry out the entire registration and hang‐up, once it commenced, in a five day period. Between 20 and 40 CHWs were recruited by each FS for a total of 4,000 CHWs across the 8 HZs (8 HZs x 20 HAs x 25 CHWs per HA = 4,000 CHWs)." IMA World Health, Kasaï-Occidental 2014 distribution report, pg. 13. - 80
- "In the present distribution, core responsibilities of Episcopal Relief & Development and ADDRO include:
- Monitoring the NMCP-led pre-distribution and distribution activities, and providing feedback to the NMCP. NMCP also does its own monitoring.
- Post-distribution monitoring." Pg. 4.
- "Phase 1 – Planning and registration
The registration phase was implemented by the government and is now complete in all three regions.
Step 1 – Informative Meetings with Ghana Health Service Regional Health Directorates
At these meetings, stakeholders discuss the LLIN distribution implementation model, the schedule of activities, and budgets. Stakeholders also agree on a date for the regional planning workshop.
Step 2 – Regional planning workshops
At these workshops, stakeholders discuss the registration and distribution processes, budgets, rules, and responsibilities for different groups. In the Greater Accra regional planning workshop, the stakeholders also discussed which households to target (in other regions, all households were targeted)." Pg. 4. - "GHS volunteers carry out the registration process, which takes place more than one month before the distribution. Volunteers are organized by the Ministry of Health (MoH) and participate in a number of government health programs, such as vaccination campaigns (immunization days)." Pg. 5.
- " Steps in the distribution process
1. Beneficiaries walk a short distance to their distribution point. One staff member employed by GHS and at least one GHS volunteer are stationed at each distribution point; there are never just two GHS volunteers." Pg. 8.
- "In the present distribution, core responsibilities of Episcopal Relief & Development and ADDRO include:
- 81
- Our estimate of the value of in-kind government contributions for all AMF distributions is based on an analysis of a single distribution in Malawi in 2012. See cell B34 on the "Summary" sheet here.
- Our estimate of the Global Fund and other philanthropic funders’ non-net costs per net relies on a variety of different sources which we have not received permission to publish. See cell B33 on the "Summary" sheet here.
- 82
See our most recent model, "Bednets" and "Results" sheets.
- 83
Rob Mather, AMF CEO, comment on a draft of this review, November 12, 2018.
- 84
For a high-level summary of AMF's funding situation in October 2018, see AMF Funds status, high-level summary for GiveWell, October 2018.
- 85
See this spreadsheet, sheet "Funding commitments."
- 86
For a high-level summary of AMF's funding situation in October 2018, see AMF Funds status, high-level summary for GiveWell, October 2018.
- 87
- Over AMF's FY 2011 to 2017 (June 30, 2010 to July 1, 2017), AMF took in $128.7 million. In total, over GiveWell's 2011 to 2016 metrics years (January 1, 2011 to January 31, 2017—we changed metrics years in this period), GiveWell-directed donors gave $91.8 to AMF. We add to this figure the amount given by GiveWell-directed donors in February 1, 2017 to June 30, 2017 ($0.7 million; from internal donation records) plus "accruals" ($4.5 million; see note in sheet "Available and expected funds," cell E23 here), to get a total of $97 million. Note that the time period for these figures do not perfectly align (though it's close). In addition, we would guess that a portion of AMF's donations that we have not attributed to GiveWell's recommendation should be counted as due to GiveWell but have not been because of lack of information from the donors.
- For GiveWell money moved figures, see our impact page. See this blog post for metrics year 2017 data.
- AMF Financial information
- Over AMF's FY 2011 to 2017 (June 30, 2010 to July 1, 2017), AMF took in $128.7 million. In total, over GiveWell's 2011 to 2016 metrics years (January 1, 2011 to January 31, 2017—we changed metrics years in this period), GiveWell-directed donors gave $91.8 to AMF. We add to this figure the amount given by GiveWell-directed donors in February 1, 2017 to June 30, 2017 ($0.7 million; from internal donation records) plus "accruals" ($4.5 million; see note in sheet "Available and expected funds," cell E23 here), to get a total of $97 million. Note that the time period for these figures do not perfectly align (though it's close). In addition, we would guess that a portion of AMF's donations that we have not attributed to GiveWell's recommendation should be counted as due to GiveWell but have not been because of lack of information from the donors.
- 88
Conversation with Rob Mather, AMF Founder, June 18, 2018
- 89
This is based on internal records of how much GiveWell-directed donors gave to AMF in 2013 when we listed AMF as a "top charity with limited room for more funding," inflated for growth in GiveWell's annual money moved since 2013.
- 90
In late August 2018, Elie recommended that 70% of available funding in the Global Health and Development Fund be donated to AMF. As of August 31, 2018, the fund contained roughly $1,855,000.
- 91
For a high-level summary of AMF's funding situation in October 2018, see AMF Funds status, high-level summary for GiveWell, October 2018.
- 92
Rob Mather, AMF CEO, comment on a draft of this review, November 12, 2018.
- 93
Rob Mather, Founder and CEO, AMF, email to GiveWell, August 13, 2018
- 94
Rob Mather, AMF CEO, comment on a draft of this review, November 12, 2018.
- 95
Conversation with Rob Mather, Founder and CEO, and Peter Sherratt, Executive Chairman, AMF, August 13, 2018
- 96
We focus our analysis on this time period in part because it represents the Global Fund's current funding cycle. The Global Fund is one of the main funders of malaria control globally. It allocates funding to country governments in three-year cycles.
- 97
For more detail, see our report on global funding gaps for LLINs and seasonal malaria chemoprevention. A spreadsheet with our calculations is here.
- 98
See this article for more detail.
- 99
Melanie Renshaw, African Leaders Malaria Alliance Chief Technical Advisor, conversation with GiveWell, October 13, 2017
- 100
See this spreadsheet, "Nets dashboard" tab.
- 101
As reported to us in Rob Mather, email to GiveWell, May 9, 2016.
- 102
See this spreadsheet, "Historic analysis" tab.
- 103
See our report on malaria funding gaps for more detail.
- 104
- In November 2013, we wrote in this blog post that we believed AMF did not have room for more funding because it had raised over $10.6 million due to GiveWell's recommendation since 2011 and had not spent the bulk of these funds.
- In 2014, AMF completed and signed agreements for several large distributions, increasing our confidence that it could productively use the donated funds it held. By the end of 2014, AMF had spent or committed a large portion of the funds it raised prior to 2014. As of November 2014, AMF held $4.9 million in uncommitted funds, of which it raised $2.65 million in 2014. Of committed funds, $1.9 million were for expenses that AMF would incur more than a year later, and AMF was considering reallocating these funds to the nearer-term with the expectation of raising enough to cover its later commitments by the time they were due. This reallocation brought AMF's total available funds to $6.8 million. Rob Mather, AMF Founder, email to GiveWell, November 26, 2014
- In 2015, AMF did not sign any new distribution agreements for the near future, although it signed agreements to replace nets it had previously funded in Malawi in 2018. AMF: "US$6m commitment to malaria control support in Malawi in 2018"
- 105
See this spreadsheet for more detail.
- 106
Melanie Renshaw, conversation with GiveWell, October 13, 2017. AMF told us something similar.
AMF noted (in a comment on a draft of this review in November 2017) that one of the reasons why it did not commit to funding distributions earlier in the year was because GiveWell had asked AMF not to make funding commitments until the sizes of funding gaps were known.
- 107
- Rob Mather and Peter Sherratt, conversation with GiveWell, April 25, 2016
- "The operational plan for a distribution typically covers 12 months. The planning horizon for a specific distribution is, however, typically 18 to 24 months as discussions to assess and approve a distribution start six months earlier and the funds required (we need to have funds in hand in order to have serious discussions) are aggregated in the preceding months." AMF: "Operational planning (12 months) and planning horizon (18 to 24 months)"
- 108
See AMF People
- 109
"Staff capacity has not hindered in any way our ability to sign agreements or manage distributions. It has slowed aspects of IT development (website redesign) and reporting." Comment provided in response to a draft of this review in November 2016
- 110
This understanding comes from many conversations with AMF.
- 111
"With or without a co-funding partner, our sense, is NMCPs will first try and achieve funding from:
a) Organisations from whom they have received funding before and with whom they have established relationships (know how the relationship operates, reporting requirements etc)
b) Organisations with high levels of funding to minimise the number of agreements reached (often 2)
c) Organisations who have the least accountability requirements. We do not have hard information to support this but is a view shared by others within the malaria and wider aid community." Rob Mather, AMF Founder, email to GiveWell, September 9, 2015 - 112
Conversation with Rob Mather, Founder and CEO, and Peter Sherratt, Executive Chairman, AMF, August 13, 2018
- 113
Rob Mather, AMF Founder, conversation with GiveWell, May 24, 2017
- 114
- 115
Alliance for Malaria Prevention 2018 Q3 Net Mapping Project
- 116
See this spreadsheet, sheet "Overview," column F. Though AMF purchased more than 17.1 million nets, because it does not pay for other distribution costs, in effect, it funded 17.1 million nets for distributions occurring in 2016-2018.
- 117
In 2016-2018 (assuming 75% of the nets that will be delivered in 2018 were delivered in the first 3 quarters), 517 million nets were delivered. 17.1 million nets is 3.3% of this. Alliance for Malaria Prevention 2018 Q3 Net Mapping Project
- 1
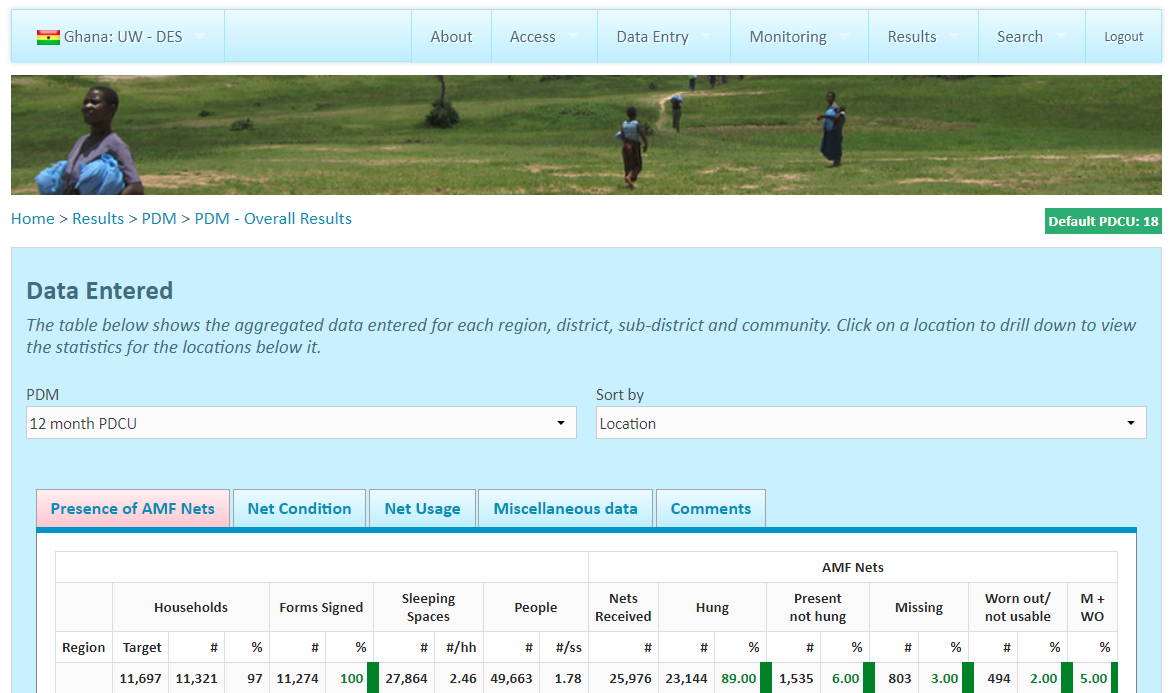
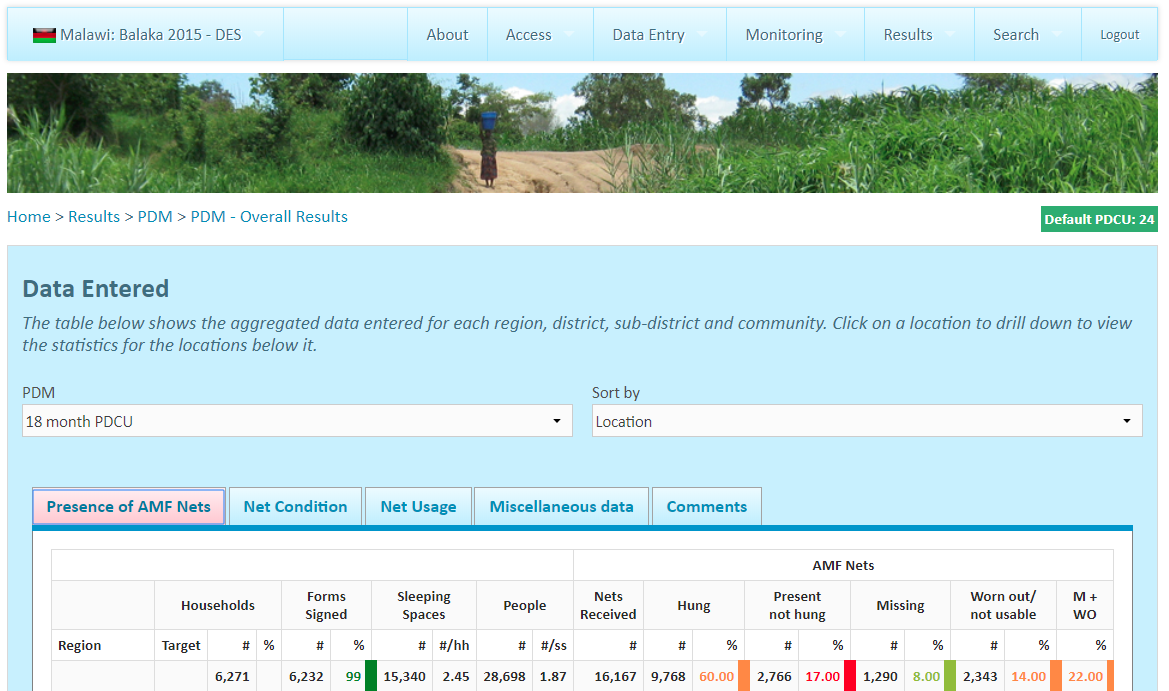
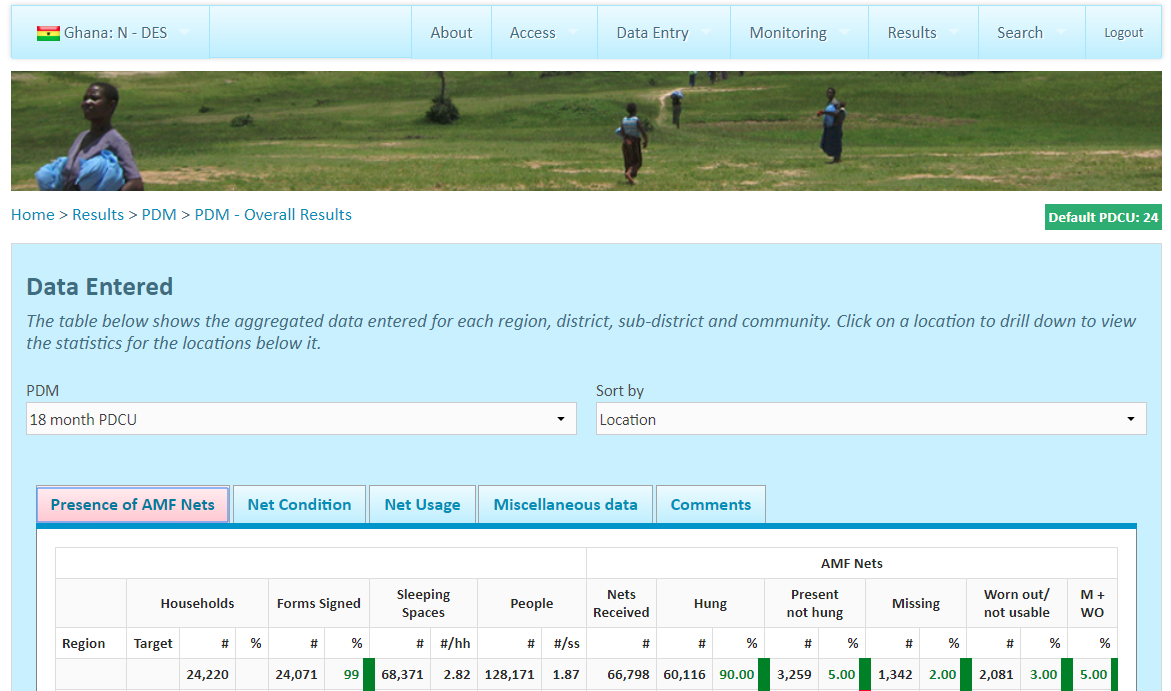
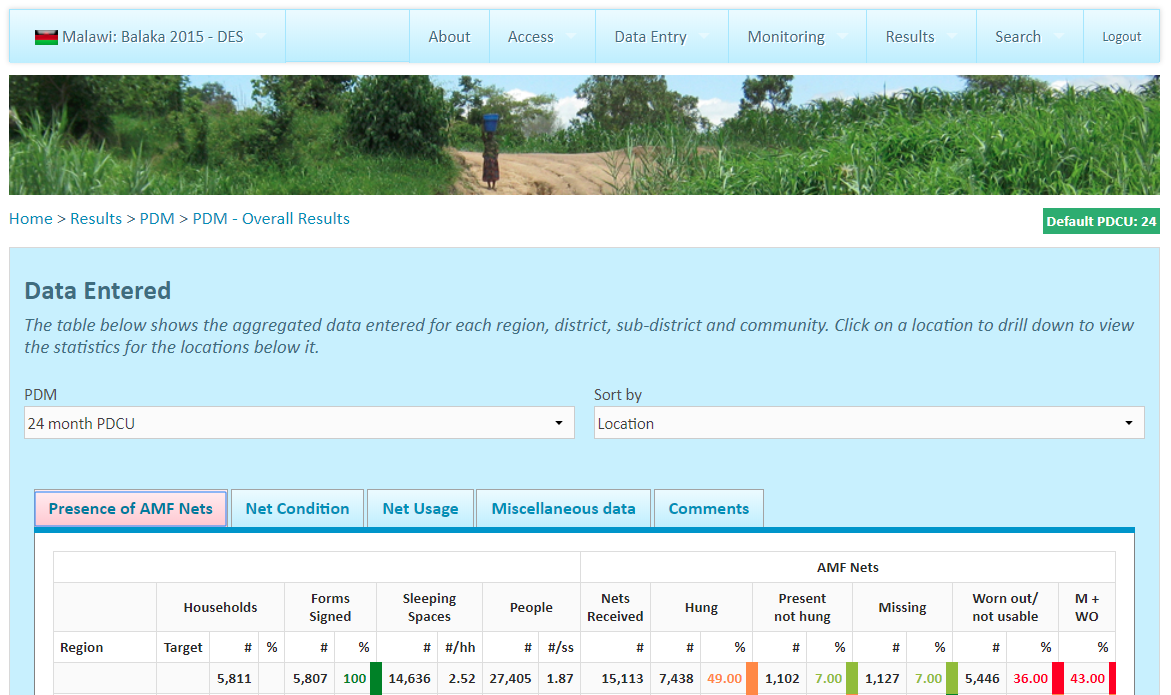
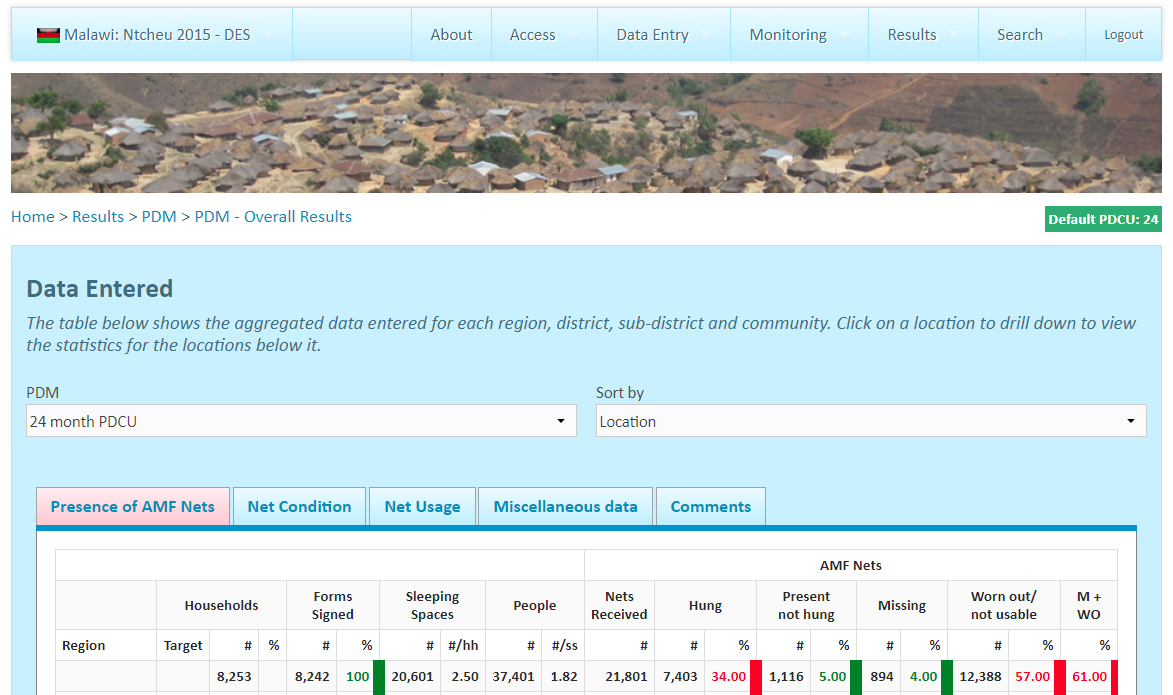