A note on this page's publication date
The content we created for KIPP in 2011 appears below. This content is likely to be no longer fully accurate, both with respect to what it says about KIPP and with respect to what it implies about our own views and positions. With that said, we do feel that the takeaways from this examination are sufficient not to prioritize re-opening our investigation of this organization at this time.
Note added June 2024: We are no longer updating reviews of individual organizations outside our Top Charities.
In 2011, we declared KIPP a "standout organization," which meant that we found it to be an outstanding opportunity to accomplish good but that we rated our top charities above it.
Published: July 2011, Updated: March 2012
Summary
We believe that KIPP improves educational outcomes for the students it serves. We recommend KIPP Houston because the KIPP Foundation (the national KIPP organization) told us that KIPP Houston has a particularly pressing need for additional funds. We have not contacted other local KIPP entities, but we do believe that KIPP Houston's funding need is real. For more, see our July 2011 and March 2012 blog posts about KIPP Houston.
Table of Contents
What do they do?
Note: The below section describes the KIPP Foundation, a national entity providing support services to KIPP network schools. In July 2011, we updated KIPP's room for more funding analysis and currently recommend donating to KIPP Houston, a regional network of KIPP schools. For more information on KIPP's current room for more funding, see our July 7, 2011 and March 14, 2012 blog posts.
As of the 2010-11 school year, KIPP is a network of almost 100 public schools across the U.S. (the majority are charter schools), focusing on improving outcomes for educationally underserved youth.1 The KIPP Foundation recruits and trains school leaders to open and operate KIPP schools, trains future school leaders through “leadership pipeline” development programs, manages the growth of the KIPP network, provides evaluative services to maintain quality, provides professional development to teachers and leaders, facilitates sharing across the network, and supports KIPP schools and regions "in areas such as legal support, real estate, technology, finance, governance, operations, communications, marketing, and development."2 The KIPP Foundation also provides professional development services to staff in leadership and coordination positions at KIPP schools.3 All of these services are provided as supports to schools - the KIPP Foundation does not operate or govern local KIPP schools.4
The following table shows the breakdown of KIPP Foundation expenses by focus area. Figures shown are board-approved budgets for fiscal years 2010 and 2011.5
| Area | 2010 | 2011 |
|---|---|---|
| Leadership development | 48% | 47% |
| Research, design and innovation | 27% | 27% |
| Network services and school support | 17% | 18% |
| Information technology | 8% | 7% |
KIPP's Model
As public schools, KIPP schools are free and all students in the school's vicinity are eligible for admission (if more students apply than there are available slots, admission is determined by random lottery).6 Like other public schools, KIPP schools pay for their operations through public funding from federal, state, and local sources. However, because charter schools receive less public funding than traditional public schools and because of costs, associated with a longer school day, month, and year, they seek out private philanthropy as well.7
KIPP schools design their own curricula, and KIPP school leaders have a great deal of autonomy within their school.8 KIPP schools are characterized by:9
- more time spent in school (longer school day, week, and year)10
- high academic expectations
- a focus on measurable results
- school-level decision making
- students, parents, and teachers signs a "Commitment to Excellence"
According to KIPP's annual report card, 85% of KIPP students are eligible for free or reduced priced meals.11 60% of students are African American and 35% are Latino.12
Other KIPP Foundation activities:
- KIPP Through College. KIPP Through College programs provide KIPP students and alumni with academic, career, and other supports, such as individual tutoring, interview skills training, and counseling for emotional needs.13
- The KIPP Foundation also lists a number of scholarship programs on their web site.14
Does it work?
Numerous independent evaluations of the effects of KIPP schools15 make a strong case that KIPP schools improve students' academic performance as measured by standardized math and reading exams. KIPP's internal monitoring, its annual report card, provides data consistent with the notion that KIPP schools are having a significant impact on students' academic achievement.
Independent studies
Below, we review in-depth three higher-quality studies of KIPP's impact, each of which finds statistically significant impacts on math scores of about 0.35-0.4 standard deviations and about 0.15-0.25 standard deviations on reading.16 We consider a study "high quality" if it carefully addresses two issues which complicate evaluating KIPP's impact: students leaving KIPP (i.e., student attrition) and students being retained in a grade and not advancing (more at Issues requiring special attention).
Although we rely on the higher-quality studies in our review, it is worth noting that each of the "lower-quality" studies finds results supporting the conclusion that KIPP schools improve students' test scores.17
Issues requiring special attention
Because of the nature of KIPP schools, two issues arise in evaluating their impact that require special attention:
- Students leaving KIPP: Improvement in class or school aggregate scores can be due to a change in class composition: poorer-performing students may leave without being replaced or being replaced by higher-performing students. These scenarios would create the appearance of improved test scores even if KIPP had no impact. A study of 22 KIPP schools found that a substantial share of students leave KIPP schools and that lower performing students are more likely to leave.18
- Students being retained in grades: In-class retention complicates the analysis since the students that are retained cannot be directly compared to non-KIPP students of the same age since they no longer do the same tests.19 And if retained students are excluded from the analysis, since the retained students are lower-performing we would get a problem very similar to the one of students leaving KIPP just described. It also seems unfair in a way favoring KIPP to compare older KIPP students who have been retained to younger non-KIPP students in the same grade level. The study of 22 KIPP schools found that KIPP retains students in grades significantly more than traditional public schools in the same district20 The study ascribes this higher retention to the KIPP model, which says students should only move to the next grade once they have mastered the content of the current grade.21
Below, we discuss the three higher quality studies we are aware of. We consider them higher quality in part because they better deal with the challenges of students leaving KIPP or being retained in grades.
Three high-quality, independent studies
- Tuttle et al. 2010
- Scope: 22 KIPP middle schools nationwide.22
- Methodology: Comparing standardized test scores of KIPP students with (a) propensity score matched non-KIPP students that have similar demographics and prior test scores and (b) all non-KIPP students in the local district(s).23 The study controls for, among other things, demographics and test scores one and two years prior to KIPP entry.24 The study will also include a randomized experimental design in a subset of schools.25 Results from the experimental part will be released in 2012.26
- Student attrition and retention: The study deals with attrition by including students who leave KIPP in the treatment group (analogous to an intention-to-treat analysis) and assumes an unchanged score trajectory for retained students.27
- Results: Using the propensity score matching approach, the study finds overall statistically significant, positive and sizeable impacts on math and reading scores. After three years at KIPP, KIPP students outperformed non-KIPP students by around 0.35 standard deviations in math and 0.22 standard deviations in reading (we take it these are cumulative effects after 3 years at KIPP, not effects per year).28 The results were similar whether KIPP students were compared with their propensity scores matches or with the whole district; the results were also similar using a variety of different methods for dealing with students that left KIPP or were retained in grades.29
- Sample attrition: The study had attrition of 17-18% of the sample. We do not believe this level of attrition poses a significant challenge to the results.30
- Other issues: One drawback of the study is that a large proportion of the sample lacked data on test scores prior to enrolling at KIPP, so the study imputed the missing scores.31 However, the study also performs its analysis on only the students that had complete baseline scores (i.e. had in scores in reading and math 1 and 2 years before enrolling in KIPP), and it is this analysis we focus on in our review.32
- Angrist et al. 2010
- Scope: One KIPP middle school, KIPP Academy Lynn, in Lynn, Massachusetts. The study included approximately 400 students.33
- Methodology: Comparing applicants who received an admissions offer through the charter school's lottery34 to applicants who did not.35
- Student attrition and retention: The study includes all students who lotteried in to KIPP Academy Lynn, whether or not they ultimately enrolled (or remain enrolled) thereby dealing effectively with the issue of attrition. It appears to us that Angrist et al. (2010) includes retained students in their analysis but excluded test scores in the repeated grade from retained students.36
- Results: Lottery winners scored on average about 0.4 standard deviations higher in math and 0.15 standard deviations higher in reading than lottery losers. Lottery winners spent an average of 1.85 years at KIPP in the period covered by the study. The differences are statistically significant.37
- Sample attrition: Given the sample size, Angrist et al. (2010) expected to find 971 total test scores. It in fact found 85% of the scores it expected. There is a small discrepancy in attrition between lottery winners and losers.38
- Other: KIPP Academy Lynn is an older KIPP school and newer KIPP schools may not have similar results. The cohorts included in Angrist et al. (2010) are among the first to enter the school and may not be representative of students who entered later or of other KIPP schools.39
- Woodworth et al. 2008
- Scope: Three San Francisco Bay Area KIPP schools.40 For students who entered KIPP in 5th grade, it analyzes only scores at the end of 5th grade, and for students who entered KIPP in 6th grade, it only analyze scores in 6th grade.41
- Methodology: Comparing the math and English Language Arts (ELA) test scores of students in KIPP schools with the test scores of non-KIPP students from the same neighborhood with similar demographics and prior test scores.42
- Student attrition and retention: The study only looks at single year improvements in test scores and does not look at improvement during students' entire time at a KIPP school. Only a small subset of those who started in 5th grade stayed through 8th grade, and those who stayed are different from those who left. This would, according to Woodworth et al. (2008), make a longer follow-up assessment biased.43
- Results:
- Fifth grade students: Students who entered KIPP in fifth grade outperformed non-KIPP students by 0.41 standard deviations on math and 0.26 standard deviations on ELA scores, by the end of 5th grade. Both effects are statistically significant.44
- Sixth grade students: Students who entered KIPP in sixth grade outperformed non-KIPP students in math and ELA by the end of 6th grade. In the three KIPP schools, these differences were statistically significant and ranged from 0.30 to 0.88 standard deviations for math and from 0.24 to 0.68 standard deviations for ELA.45
- Sample attrition: Unknown.
Internal monitoring
The KIPP Foundation releases an annual report card which describes student demographics and achievement results.46 The report card presents state test scores for each school and compares them to those of the local district showing that the vast majority of KIPP classes outperform districts in math and reading/English Language Arts.47
The report card also reports that 89% of KIPP 8th grade completers have matriculated to college.48 Note that we don't know how many students this figure includes and what a reasonable comparison figure for non-KIPP students would be. This figure doesn't include students who drop out of KIPP before 8th grade, and it is largely made up of graduates from the first KIPP schools, which may differ from the vast majority of KIPP schools founded more recently who have yet to see a significant portion of their students reach college age.
Weighing the evidence
Three independent, high-quality studies find significant impacts of KIPP's programs on students' academic achievement. KIPP's internal monitoring paints a similar picture. Overall, we find KIPP's case for improving students' test scores compelling.
- We find the combination of these studies compelling even when weighed against the fact that propensity score matching studies do not adjust for student-factors such as motivation which could lead the sample of students who enter the KIPP lottery to differ in a meaningful way from students who do not enter the lottery. We find it plausible that some of the effect measured by studies using this method are not due to KIPP. Nevertheless, we would guess that a difference in students that did not manifest itself in third- or fourth-grade test scores but then does appear for fifth-grade (and later) test scores is likely a minor issue.
- As noted above, KIPP is currently participating in an evaluation with Mathematica Policy Research that will ultimately produce results using the randomized controlled trial methodology. In the relatively near future, even more rigorous information will be available regarding KIPP's impact.
Note that we have focused our analysis on KIPP's impact on middle-school test scores and not longer-term impacts such as high school and college graduation or adult earnings because we have not seen this data.
Concerns with KIPP's model
A review from 2008 of the evidence of the effectiveness of KIPP says, "Few studies look deeply inside the KIPP process; those that do show that teacher enthusiasm is high but that demands on teachers and leaders are great, resulting in high turnover and an unrelieved pressure to find and train new people. The implications for the expansion and sustainability of the KIPP model are still not clear."49 And it recommends, "Although KIPP may yield useful information, policymakers and others should temper their interest in the operation with wariness and realistic expectations. There are significant unanswered questions about how expansion might affect outcomes, especially in relation to the difficulty of sustaining gains dependent upon KIPP’s heavy demands on teachers and school leaders.... It is possible that only a small proportion of students and families will be able to meet the demands KIPP imposes on them; even those enthused when they begin the KIPP regimen tend to leave in high numbers.... With no strong evidence yet linking extended scheduling to KIPP success, policymakers might best encourage it as a school level (rather than district-wide) option while concurrently promoting a combination of experimentation and careful analysis of consequences."50
25% of KIPP teachers left KIPP in the year 2008/2009 (those who moved into a non-teaching position at KIPP or left to teach at another KIPP school are not included in this number).51 That a fourth of the teachers leaves per year sounds like a high number to us.
What do you get for your dollar?
KIPP does not report the average per-student cost across its network.52 KIPP reports that the total (including per-student state funding) per-student costs across its schools ranged from $7,500 to $17,000 per student in 2010.53 We do not know the portion of this that comes from government funding versus private charitable donations.
In 2008, we evaluated the costs per-student of KIPP NYC, a group of four KIPP schools in New York City. Though these data are somewhat dated, they are consistent with the figures discussed above.
Attachment D-2 breaks out KIPP NYC's costs (for the 2007-2008 year, projected as of late 2007). The following summary lists KIPP's direct per-student costs, as well as the implied per-student costs of various programs it runs that are not associated with a particular school, in order to give a full sense of how much funding KIPP expends per student serves.54
- When looking only at direct operating expenses of the four schools, KIPP lists total expenses of $12,712,349 for a total of 949 students, implying $13,396 per student. Note that a significant portion of these expenses are covered by "per-pupil funding" that KIPP receives from the state as an alternative to traditional public schooling; state per-pupil funding covers $11,023 per student, leaving $2,373 per student to be covered by grants and private support.
- KIPP also lists several general support programs, not associated with a particular school, with total expenses of $ $3,672,935, or an additional $3,870 per student.
- None of these figures includes the expenses of The KIPP Foundation, a national organization that focuses on starting new schools. (For more information on the KIPP Foundation, see the KIPP website.) In 2006 (according to its IRS Form 990, available on Guidestar), the KIPP Foundation had total expenses of $19.9 million, which implies an additional $1,423 for each of its (at that time) 14,000 students served.
Depending on what one wishes to include in "per-student" expenses, the total cost of the program for NYC students was between $13,000 and $19,000 per student in 2008, $11,023 of which comes directly from state per-pupil funding.
Room for more funding
On July 7, 2011, we published a blog post updating our view on KIPP's room for more funding. We updated this view in another blog post on March 14, 2012.
Financials
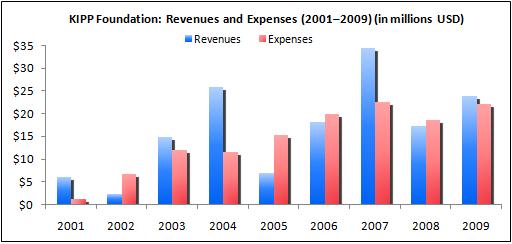
Revenue and expense growth (about this metric): KIPP Foundation's revenues and expenses have grown over time.55
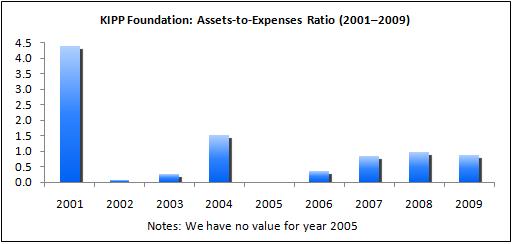
Assets-to-expenses ratio (about this metric): In 2007–2009, KIPP Foundation had an assets to expenses ratio of between approximately 0.9 and 1. This means that KIPP Foundation could sustain its activities for about 1 year if its revenues stopped. We find this assets to expenses ratio reasonable.56
Expenses by program area (about this metric): See table above.
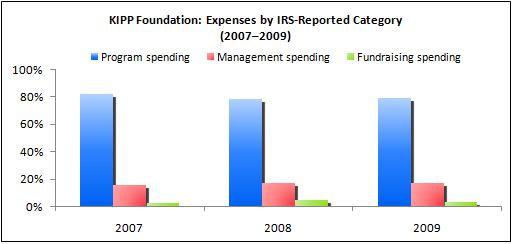
Expenses by IRS-reported category (about this metric): KIPP Foundation maintains a reasonable "overhead ratio," spending approximately 80% of its budget on program expenses.57
Sources
- Anderson, Amy Berk, and Dale DeCesare. 2006. Opening closed doors: Lessons from Colorado’s first independent charter school. Denver, CO: Augenblick, Palaich and Associates, Inc.
- Angrist, Joshua D., et al. 2010. Who benefits from KIPP? NBER Working Paper Series, Working Paper 15740. Cambridge, MA: National Bureau of Economic Research.
- Doran, Harold C., and Darrel W. Drury. 2002. Evaluating success: KIPP educational program evaluation. New American Schools Education Performance Network.
- Educational Policy Institute. 2005. Focus on results:
An academic impact analysis of the Knowledge Is Power Program (KIPP). Virginia Beach, VA: Educational Policy Institute. - Henig, Jeffrey R. 2008. What do we know about the outcomes of KIPP schools? East Lansing, MI: Great Lakes Center for Education Research and Practice.
- KIPP Foundation. About KIPP. http://kipp.org/about-kipp (accessed August 31, 2011). Archived by WebCite® at http://www.webcitation.org/61LzBXz5B.
- KIPP Foundation. FAQ. http://kipp.org/about-kipp/faq (accessed August 31, 2011). Archived by WebCite® at http://www.webcitation.org/61LzK6m6G.
- KIPP Foundation. Five pillars. http://kipp.org/about-kipp/five-pillars (accessed August 31, 2011). Archived by WebCite® at http://www.webcitation.org/61LzQQmoR.
- KIPP Foundation. GiveWell due diligence questions. KIPP has asked us to keep this document confidential and quote from this document, which is not an official document, only when necessary.
- KIPP Foundation. Independent reports. http://www.kipp.org/about-kipp/results/independent-reports (accessed August 31, 2011). Archived by WebCite® at http://www.webcitation.org/61LzUzq05.
- KIPP Foundation. Initiatives & Impact. http://kipp.org/about-kipp/the-kipp-foundation/initiatives-and-impact (accessed August 31, 2011). Archived by WebCite® at http://www.webcitation.org/61LzY5hEU.
- KIPP Foundation. IRS Form 990:
- KIPP Foundation. IRS Form 990-PF:
- KIPP Foundation. Program-specific questions: KIPP NYC (DOC).
- KIPP Foundation. Report card (2009) (PDF).
- KIPP Foundation. Report card (2010) (PDF).
- KIPP Foundation. KIPP through college. http://www.kipp.org/students/kipp-through-college (accessed August 31, 2011). Archived by WebCite® at http://www.webcitation.org/61LzjAHqp.
- KIPP Foundation. Other leadership pathways. http://www.kipp.org/school-leaders/other-leadership-pathways (accessed August 31, 2011). Archived by WebCite® at http://www.webcitation.org/61LzlSJN7.
- KIPP Foundation. Philanthropy News Digest - "Newsmakers: Richard Barth, Chief Executive Officer, KIPP Foundation". http://www.kipp.org/news/philanthropy-news-digest-newsmakers-richard-ba…- (accessed August 31, 2011). Archived by WebCite® at http://www.webcitation.org/61Lzq6Pqb.
- KIPP Foundation. Results. http://kipp.org/about-kipp/results (accessed August 31, 2011). Archived by WebCite® at http://www.webcitation.org/61LzsM1tB.
- KIPP Foundation. Scholarships. http://www.kipp.org/students/scholarships (accessed August 31, 2011). Archived by WebCite® at http://www.webcitation.org/61LzupFKT.
- KIPP Foundation. Teaching Environment. http://kipp.org/teachers/teaching-environment (accessed August 31, 2011). Archived by WebCite® at http://www.webcitation.org/61LzzpqNd.
- KIPP Foundation. The KIPP Foundation. http://kipp.org/about-kipp/the-kipp-foundation (accessed August 31, 2011). Archived by WebCite® at http://www.webcitation.org/61M06UFg5.
- Mac Iver, Martha Avele, and Elizabeth Farley-Ripple. 2007. The Baltimore KIPP Ujima Village Academy, 2002-2006: A longitudinal analysis of student outcomes. Baltimore: The Center for Social Organization of Schools, Johns Hopkins University.
- McDonald, Aaron J., et al. 2008. Urban School Reform: Year 4 Outcomes for the Knowledge is Power Program in an Urban Middle School. Memphis: Center for Research in Educational Policy, The University of Memphis.
- McSparrin-Gallagher, Brenda, and Steven M. Ross. 2005. Analysis of Year 2 (2003 – 2004): Student Achievement Outcomes for the Memphis KIPP DIAMOND Academy. Memphis: Center for Research in Educational Policy, The University of Memphis.
- Musher, Karol K., et al. 2005. Can an intense educational experience improve performance on objective
tests? Results from one charter school. The Educational Forum 69: 352-366. - Ross, Steven M., et al. (2007). Achievement and Climate Outcomes for the Knowledge is Power Program in an Inner-City Middle School. Journal of Education for Students Placed at Risk 12 (2): 137-165.
- Ross, Steven M., Aaron McDonald, and Brenda McSparrin-Gallagher. 2004. Year 1 Evaluation of the KIPP DIAMOND Academy: Analysis of TCAP Scores for Matched Program-Control Group Students. Memphis: Center for Research in Educational Policy, The University of Memphis.
- Thompson, Susan, Aaron McDonald, and Allan Sterbinsky. 2005. KIPP DIAMOND Academy: Year three (2004-2005) evaluation report. Memphis: Center for Research in Educational Policy, The University of Memphis.
- Tuttle, Christina Clark, et al. 2010. Student characteristics and achievement in 22 KIPP middle schools: Final report (PDF). Washington, DC: Mathematica Policy Research, Inc.
- Woodworth, Katrina R, et al. 2008. San Francisco Bay Area KIPP schools: A study of early implementation and achievement: Final report. Menlo Park, CA: SRI International.
Other submitted documents
These are documents KIPP submitted to us as past of a grant process in 2007. We do not refer to most of these documents in our review.
A. Application and response
- Attachment A-1: Application response - Round 1
- Attachment A-2: Application - Round 2
- Attachment A-3: Application response - Round 2
B. Program related attachments
- Attachment B-1: Email from Casey Karel 2008 2 29
- Attachment B-2: Publicly Available Test Data
- Attachment B-3: “The Baltimore KIPP Ujima Village Academy, 2002-2006: A Longitudinal Analysis of Student Outcomes” – Iver and Farley-Ripple (2007)
- Attachment B-4: “KIPP DIAMOND Academy – Analysis of Year 2 (2004-2004) Student Achievement Outcomes” – Gallagher and Ross (2005)
- Attachment B-5: Draft of: “Attrition and Its Impact on Baseline Test Scores at KIPP Gaston College Preparatory” – Maddin (2007)
- Attachment B-6: High Schools Attended by KIPP NYC Alumni as of 9/1/07
- Attachment B-7: Colleges Attended by KIPP NYC Alumni as of 9/1/07
- Attachment B-8: KIPP NYC Parent, Teacher, and Student Commitment Contract
- Attachment B-9: KIPP NYC School Profile Sheets
- Attachment B-10: KIPP NYC Self-Checking Guide
- Attachment B-11: “An Evaluation of Achievements of Students Attending KIPP STAR” (2006)
- Attachment B-12: SAT 9/10 National Score Equivalence Performance Summary for 2011 Cohort at KIPP Academy, New York
- Attachment B-13: SAT 9/10 National Score Equivalence Performance Summary for 2011 Cohort at KIPP STAR Academy
- Attachment B-14: SAT 9/10 National Score Equivalence Performance Summary for 2012 Cohort at KIPP Academy, New York
- Attachment B-15: SAT 9/10 National Score Equivalence Performance Summary for 2013 Cohort at KIPP Academy, New York
- Attachment B-16: B-16: SAT 9/10 National Score Equivalence Performance Summary for 2014 Cohort at KIPP Academy, New York
- Attachment B-17: SAT 9/10 National Score Equivalence Performance Summary for 2013 Cohort at KIPP AMP Academy
- Attachment B-18: SAT 9/10 National Score Equivalence Performance Summary for 2014 Cohort at KIPP AMP Academy
- Attachment B-19: SAT 9/10 National Score Equivalence Performance Summary for 2013 Cohort at KIPP Infinity School
- Attachment B-20: SAT 9/10 National Score Equivalence Performance Summary for 2014 Cohort at KIPP Infinity School
- Attachment B-21: SAT 9/10 National Score Equivalence Performance Summary for 2012 Cohort at KIPP STAR Academy
- Attachment B-22: SAT 9/10 National Score Equivalence Performance Summary for 2013 Cohort at KIPP STAR Academy
- Attachment B-23: SAT 9/10 National Score Equivalence Performance Summary for 2014 Cohort at KIPP STAR Academy
- Attachment B-24: “Evaluating Success: KIPP Educational Program Evaluation” – New American Schools (2002)
- Attachment B-25: KIPP - 2006 summary of achievements
- Attachment B-26: Peer-reviewed KIPP Diamond study
- Attachment B-27: Excel file of KIPP Ujima data
C. Organization related attachments
- Attachment C-1: IRS 501C3 Approval Letter
- Attachment C-2: KIPP NYC Staff Bios
- Attachment C-3: KIPP NYC Board of Directors
D. Financial documents
- Attachment D-1: KIPP Infinity Financial Statement June 2006
- Attachment D-2: KIPP NYC Budget 2007-08 (withheld due to confidentiality request)
- Attachment D-3: KIPP Academy Financial Statement (June 2006)
- Attachment D-4: KIPP AMP Academy Financial Statement (June 2006)
- Attachment D-5: KIPP Star College Prep Financial Statement (June 2006)
- 1
"All KIPP schools are public schools, so their basic funding comes from the same federal, state and local sources that support other public schools. The majority of KIPP schools are charter schools." KIPP Foundation, "FAQ."
"There are 60 KIPP middle schools (grades 5-8), 24 elementary schools (grades Pre-K-4), and 15 high schools (grades 9-12)." KIPP Foundation, "About KIPP."
- 2
"In 2000, Doris and Don Fisher created the KIPP Foundation to grow the KIPP network by training outstanding school leaders to open and operate KIPP schools. Since 1994, KIPP has grown from two teachers in a single classroom to over 1,500 teachers serving more than 26,000 kids in 99 schools across the country. The KIPP Foundation, through its KIPP School Leadership Program, has recruited and trained more than 100 KIPP school leaders to open new KIPP schools or succeed founding school leaders.
Beyond recruiting and training new school leaders, the KIPP Foundation is responsible for supporting excellence and sustainability across the network and leading network-wide innovation efforts to leverage our growing scale. The KIPP Foundation provides a variety of supports and services to KIPP schools and regions in areas such as legal support, real estate, technology, finance, corporate governance, operations, communications, marketing, and development." KIPP Foundation, "The KIPP Foundation."
- 3
KIPP Foundation, "Other Leadership Pathways."
- 4
"The KIPP Foundation does not manage KIPP schools. Each KIPP school is run by a KIPP-trained school leader and governed by a local board of directors, and charters are held by a local 501(c)3." KIPP Foundation, "The KIPP Foundation."
- 5
KIPP Foundation, "GiveWell Due Diligence Questions," Pgs 17-20.
- 6
KIPP Foundation, "FAQ."
- 7
"All KIPP schools are public schools, so their basic funding comes from the same federal, state and local sources that support other public schools. The majority of KIPP schools are charter schools, which have a slightly different funding structure because they have to pay for facilities and other expenses that are covered for district public schools.
To make up for the gap between state and district revenues and the cost of running KIPP schools, KIPP school leaders and regional directors raise independent funds to help cover their costs. KIPP's funders include local and national foundations, individual donors, and corporate philanthropy." KIPP Foundation, "FAQ."
- 8
"KIPP offers a rigorous, college preparatory education. Due to KIPP's extended day, week and school year, KIPP students benefit not only from extra time in core subjects such as math and reading, but more instruction in courses such as art music and physical education.
Each KIPP school operates autonomously, and teachers and principals have the freedom to design the curriculum to best meet the needs of their students. Several KIPP schools, such as the KIPP Academy in the South Bronx, have award-winning student orchestra programs, while other KIPP schools offer unique elective classes that are of interest to their students." KIPP Foundation, "FAQ."
"The principals of KIPP schools are effective academic and organizational leaders who understand that great schools require great school leaders. They have control over their school budget and personnel. They are free to swiftly move dollars or make staffing changes, allowing them maximum effectiveness in helping students learn." KIPP Foundation, "Five Pillars."
- 9
According to a literature of the evidence of KIPP schools' impact, "KIPP’s identifying features include high academic expectations, parent and student commitment, substantially more time in school, school-level decision-making, and a focus on measurable outcomes." Henig 2008, Pg 3
These features correspond to the five operating principles that KIPP schools share (known as the Five Pillars). KIPP Foundation, "Five Pillars."
- 10
One of the five operating principles that KIPP schools share is "More Time. KIPP schools know that there are no shortcuts when it comes to success in academics and life. With an extended school day, week, and year, students have more time in the classroom to acquire the academic knowledge and skills that will prepare them for competitive high schools and colleges, as well as more opportunities to engage in diverse extracurricular experiences." KIPP Foundation, "Five Pillars."
"KIPP schools provide students more learning time than do traditional schools. How each school adds extra time varies, but usually includes some Saturdays and summer school." KIPP Foundation, "Teaching Environment."
KIPP NYC schools:
"KIPP NYC schools operate on a longer day. Our schools typically run 7:25 a.m. – 5:00 p.m. Monday through Thursday; 7:25 a.m. – 3:00 p.m. Fridays; alternating Saturdays from 8:00 a.m. – 1:00 p.m.; and for three weeks in July from 8:00 a.m. – 2:00 p.m. In all, KIPP NYC students are in school for 209 days per year. This translates to 67% more time in the classroom than their peers, or the equivalent of an additional 2½ years of instruction after their four years in middle school." KIPP Foundation, "Program-specific questions: KIPP NYC," Pg 1. - 11
KIPP Foundation, "Report Card (2010)," Pg 7.
- 12
KIPP Foundation, "Report Card (2010)," Pg 8.
- 13
KIPP Foundation, "KIPP Through College."
- 14
KIPP Foundation, "Scholarships."
- 15
Henig 2008.
KIPP Foundation, "Independent Reports."The studies on the effects of KIPP schools that we have considered for this review of the KIPP Foundation are:
- Higher-quality studies:
- Tuttle et al. 2010.
- Angrist et al. 2010.
- Woodworth et al. 2008.
- Lower-quality studies:
- Anderson and DeCesare 2006.
- Mac Iver and Farley-Ripple 2007.
- Doran and Drury 2002.
- Education Policy Institute 2005.
- Musher et al. 2005.
- Publications from studying the KIPP DIAMOND Academy:
- Ross, McDonald, and McSparrin Gallagher 2004.
- McSparrin Gallagher and Ross 2005.
- Thompson, McDonald, and Sterbinsky 2005.
- Ross et al. 2007.
- McDonald et al. 2008.
- Higher-quality studies:
- 16
Tuttle et al. 2010.
Angrist et al. 2010.
Woodworth et al. 2008. - 17
The lower-quality studies we've considered are:
- Publications from studying the KIPP DIAMOND Academy:
- Ross, McDonald, and McSparrin Gallagher 2004.
- McSparrin Gallagher and Ross 2005.
- Thompson, McDonald, and Sterbinsky 2005.
- Ross et al. 2007.
- McDonald et al. 2008.
- Anderson and DeCesare 2006.
- Mac Iver and Farley-Ripple 2007.
- Doran and Drury 2002.
- Education Policy Institute 2005.
- Musher et al. 2005.
- Publications from studying the KIPP DIAMOND Academy:
- 18
"Over the entire course of middle school, cumulative attrition rates for students who enter in fifth grade at KIPP schools range from a low of 10 percent to a high of 76 percent." Tuttle et al. 2010, Pg 15. See also Pgs B-6, B-7.
"Overall, these descriptive findings suggest that lower performing students are more likely to transfer schools before completing eighth grade; at KIPP, this is especially evident for in-district transfers. However, there is little evidence that the transfer pattern of low-performing KIPP students differs from the pattern at other public schools." Tuttle et al. 2010, Pg 16.
- 19
Tuttle et al. 2010, Pg 24.
- 20
"As the table demonstrates, KIPP middle schools retain students in grade at significantly higher
rates than traditional public schools in the same districts.... Differences in grade repetition rates make it challenging to compare the achievement of KIPP students to district students using conventional, grade-specific standardized tests." Tuttle et al. 2010, Pg 17. - 21
Tuttle et al. 2010, Pgs 16, 24.
- 22
"“In this report, we use the best available nonexperimental approaches to provide timely estimates of the effect of a national sample of 22 KIPP middle schools.” Tuttle et al. 2010, Pgs 4, 9.
- 23
Tuttle et al. 2010, Pgs 19-22.
- 24
“Our nonexperimental methods account for the pre-KIPP (baseline) characteristics of students who subsequently enter KIPP schools: not only demographic characteristics such as race/ethnicity, gender, poverty status, and special education status, but also their achievement test results for two years prior to entering KIPP. We examine the achievement levels of the students for up to four years after entering KIPP schools. In our preferred models, we compare these trajectories to the achievement trajectories of a matched set of local public school students who have similar achievement test results and demographic characteristics in the baseline period (typically third and fourth grades) but who do not enroll in KIPP.” Tuttle et al. 2010, Pg 4, 20.
- 25
Tuttle et al. 2010, xii.
- 26
Tuttle et al. 2010, Pg 4.
- 27
Attrition:
-
"Any student who ever enrolled at KIPP remains permanently in the KIPP treatment group, regardless of whether the student remains in a KIPP school or transfers elsewhere.... This approach is analogous to an “intent to treat” analysis conducted in an experimental context." Tuttle et al. 2010, Pg 24.
Retention:
-
"For each grade repeater, in the year of repetition and subsequent years, we impute a score on the cohort-appropriate (rather than grade-appropriate) assessment that is equal to the student’s standardized score in the last year prior to grade retention. In other words, we assume that each retained student does neither better nor worse than before retention. If KIPP in fact has a positive impact on the achievement of grade repeaters, this would cause us to underestimate KIPP’s impact. If KIPP in fact has a negative impact on the achievement of grade repeaters, this would cause us to overestimate KIPP’s impact." Tuttle et al. 2010, Pg 24.
- 28
- Mathematics:
For mathematics 3 years after enrollment in KIPP, the cumulative effects in the 22 schools were: 14 schools showed positive and statistically significant effects (p.05), 4 effects were not statistically significant, and 4 schools were N/A. The median and average effect size (among the 18 schools with effects reported) were 0.35 and 0.40 standard deviations, respectively, and both statistically significant at p.01 (Tuttle et al. 2010, Table D.5a, Pg D-11).
- Reading:
For reading 3 years after enrollment in KIPP, the cumulative effects in the 22 schools were: 11 schools showed positive and statistically significant effects (p.05), 7 effects were not statistically significant, and 4 schools were N/A. The median and average effect size (among the 18 schools with effects reported) were 0.22 and 0.24 standard deviations, respectively, and both statistically significant at p.05 (Tuttle et al. 2010, Table D.5b, Pg D-12).
These estimates were made using what Tuttle et al. call their "benchmark model" (Pg 33): propensity score matching controlling for demographics and test scores two years prior to KIPP enrollment.
These estimates are made treating any student who ever enrolled in KIPP to remain permanently in the KIPP treatment group, regardless of whether the student leaves KIPP (analogous to intent to treat analysis) (Tuttle et al. 2010, Pg 24). These estimates also assumes those retained in grades score neither better or worse than before retention and impute test scores (i.e. assume an unchanged score trajectory for retained students) (Pg 24).Note that a large proportion of the sample lacked data on test scores prior to enrolling at KIPP, so the study imputed the missing scores:
-
"In this study, a large proportion of sample members were missing baseline test scores, especially baseline test scores from two years prior. Like back-end attrition, missing data on the front end may pose a problem when missingness is correlated to treatment status or to student characteristics. To address this problem, we conducted stochastic regression imputation for missing baseline test scores separately by treatment status and used data sets with imputed baseline test scores." Tuttle et al. 2010, Pg 25.
However, the study also does its analysis with only the students that had complete baseline test scores (i.e. had scores in reading and math 1 and 2 years before enrolling in KIPP). (Tuttle et al. 2010, Appendix D, Pg D-3; Table D.5a, Pg D-11; and Table D5.b, Pg D-12.) These are the results we focus on in our review, and we focus on the cumulative results after three years at KIPP
See Tuttle et al. (2010), Pgs 28, 30, and Figures III.5 and III.6, Pg 31, for the results from the analysis with the full sample (including students with imputed baseline test scores). For the full sample, students three years after they entered KIPP, the median school's effect size is around 0.4 standard deviations for math and 0.25 standard deviations for reading; both are statistically significant.
- Mathematics:
- 29
“A variety of alternative analyses, the details of which can be found in Appendix D, produce results that likewise suggest large impacts.” Tuttle et al. 2010, Pgs 28, 32, Appendix D.
- 30
"The study subjects may disappear from our analytic sample for several reasons including, but not limited to, dropping out of school; moving to a school outside of our data catchment areas; moving into our data catchment areas after the baseline period; moving to a private school; and having missing variable values. We categorized the above cases when students disappear from our analytic sample as out-of-district transfers. When we examined differences between KIPP and non-KIPP students in the cumulative rates of these out-of-district transfers, we found no obvious trend in either direction. The median cumulative rates of out-of-district transfers are 18 and 17 percent for KIPP and non-KIPP students respectively. For details, refer to Appendix Table B.5." Tuttle et al. 2010, Pg 25.
- 31
"In this study, a large proportion of sample members were missing baseline test scores, especially baseline test scores from two years prior. Like back-end attrition, missing data on the front end may pose a problem when missingness is correlated to treatment status or to student characteristics. To address this problem, we conducted stochastic regression imputation for missing baseline test scores separately by treatment status and used data sets with imputed baseline test scores." Tuttle et al. 2010, Pg 25.
- 32
Tuttle et al. 2010, Appendix D, Pg D-3; Table D.5a, Pg D-11; and Table D5.b, Pg D-12. We don't know the sample size used in the analysis of only the students that had complete baseline scores.
- 33
The school is KIPP Academy Lynn in Lynn, Massachusetts. Angrist et al. 2010, Pg 1.
For sample size, see Angrist et al. 2010, Pg 22.
For grades and tests of the cohorts studied, see Angrist et al. 2010, Pg 4.
- 34
Since more people apply to the school than there are seats, the school uses randomized lotteries to determine who gets admitted. KIPP Foundation, "FAQ."
- 35
Note that the random assignment wasn't perfect, the study says, "our reconstruction of the KIPP lotteries is based on spreadsheets that may be missing some information. In particular, for some applicants, lottery status was over-written with enrollment status. We attempted to fix this by reviewing the lottery records with school staff." Angrist et al. 2010, Pg 4.
- 36
Angrist et al. (2010) only says the following about how they deal with students repeating grades:
- "We standardized scores to have mean zero and standard deviation one within a subject-grade-year in Massachusetts. Repetitions of the same test subject and grade were dropped. In one case with multiple records within a year and grade, scores were chosen at random." Angrist et al. 2010, Pg 20.
- "KIPP Lynn typically asked 5th grade applicants to repeat. These applicants might be expected to do better on 5th grade MCAS tests just by virtue of repeating. We therefore assume that all 5th grade applicants repeat and look only at their 6th grade and higher scores. We also drop a few 3rd grade applicants. These restrictions reduce the sample to 419, eliminating 38 2008-9 applicants from 5th grade (and a handful from 3rd)." Angrist et al. 2010, Pg 21.
- 37
For effect sizes and statistical significance, see Angrist et al. 2010, Pg 6;Table 4, Pg 13.
"Overall, lottery winners spent an average of about 1.85 years at KIPP Lynn in our sample period." Angrist et al. 2010, Pg 4.
Note that:
- The estimates of effect sizes are made for all applicants, controlling for demographics and baseline test scores, and are statistically significant at 5% significance level (Angrist et al. 2010, Table 4, Pg 13).
- The effect sizes 0.4 and 0.15 standard deviations in math and reading are not effects per year at KIPP but effects per 1.85 years at KIPP.
- 38
"While Table 1 shows that lottery winners and losers are similar at the time of the lottery, subsequent attrition may generate important differences in the follow-up sample if the attrition process is non-random. Of particular concern is the possibility that lottery losers are more likely to be missing. The MCAS is a statewide test, but KIPP applicants who enroll in private school or leave Massachusetts altogether are lost to follow-up. Table 3 probes for evidence of differential attrition between lottery winners and losers. Given the entry cohorts and tested grades of the lottery applicants, we expect to observe 971 test scores after the lottery (Appendix Table A3 lists the number of test scores expected and observed for each applicant cohort). Among those who lose the lottery, about 85% of expected scores were found. This rate is about fi
ve percentage points higher for those who win the lottery, a difference that shrinks and become insigni
ficant with the inclusion of demographic controls. The small follow-up di
fferentials documented in Table 3 seem unlikely to impart substantial selection bias in our impact analysis." Angrist et al. 2010, Pg 5. - 39
"A recent charter study concludes that newly opened charter schools do worse than traditional public schools (Zimmer, Gill, Booker, Lavertu, Sass and Witte 2009). It's therefore worth emphasizing that the results reported here are from the
first few cohorts to attend KIPP Lynn." Angrist et al. 2010, Pg 9. - 40
"Our data include student-level CST and demographic data for KIPP and non-KIPP students from three
Bay Area KIPP schools and the two districts where these schools are located." Woodworth et al. 2008, Pg 23. - 41
Woodworth et al. 2008, Pgs 23-27.
- 42
The matching was made using propensity scores. Woodworth et al. 2008, Pg 23.
Note, this study performs several different analyses but we rely and report on the results from this match.
- 43
Woodworth et al. 2008, Pgs 26-27.
- 44
Both these effects are statistically significant at 1% significance level. And these effect sizes are for the end of 5th grade and the median cohort among the six cohorts (two cohorts each in three KIPP schools). Estimates were made adjusting for two years of prior test scores. Woodworth et al. 2008, Pgs 23-25 and Exhibit B-18, Pg 104.
- 45
These estimates were made adjusting for scores in 4th and 5th grades. Woodworth et al. 2009, Pg 25 and Exhibit 2-13, Pg 26.
- 46
KIPP Foundation, "Report Card (2010)."
- 47

KIPP Foundation, "Report Card (2009)," Pg 24.
- 48
KIPP Foundation, "Report Card (2010)," Pg 27.
- 49
Henig 2008, Pgs 1-2.
- 50
Henig 2008, Pgs 1-2.
- 51
"The seventh annual KIPP Report Card provides data that tracks the growth and development of the KIPP network, collected from each locally-run KIPP school open during the 2008-09 school year." KIPP Foundation, "Report Card (2009)," Pgs 22, 25.
- 52
"We do not aggregate our school and regional financial data in a way that can produce average costs per student across the KIPP network. In general, our regional and school budgets (and therefore costs per student) range greatly, depending on the state in which a school is located (which impacts public funding), whether or not a school is located in a region with a shared services center, maturity of a school or region (those fully enrolled are most cost efficient), cost of living index and on other factors, such as if the district provides facilities or not." KIPP Foundation, "GiveWell Due Diligence Questions," Pg 16.
- 53
"In FY10 KIPP schools cost per students ran from $7,500 to close to $17,000 per student. Our schools in California (as an example) are on the low cost per student end of the spectrum, and our schools on the east coast are on the high end. Again, the range is driven by the factors listed above, with the largest driver being the state & local per pupil funding." KIPP Foundation, "GiveWell Due Diligence Questions," Pg 16.
- 54
Note that KIPP states, Our schools in California (as an example) are on the low cost per student end of the spectrum, and our schools on the east coast are on the high end." KIPP Foundation, "GiveWell Due Diligence Questions," Pg 16.
- 55
The data on KIPP Foundation's revenues and expenses comes from
KIPP Foundation, "IRS Form 990-PF (2001)."
KIPP Foundation, "IRS Form 990-PF (2002)."
KIPP Foundation, "IRS Form 990-PF (2003)."
KIPP Foundation, "IRS Form 990-PF (2004)."
KIPP Foundation, "IRS Form 990-PF (2005)."
KIPP Foundation, "IRS Form 990-PF (2006)."
KIPP Foundation, "IRS Form 990 (2007)."
KIPP Foundation, "IRS Form 990 (2008)."
KIPP Foundation, "IRS Form 990 (2009)." - 56
The data on KIPP Foundation's assets to expenses ratio comes from
KIPP Foundation, "IRS Form 990-PF (2001)."
KIPP Foundation, "IRS Form 990-PF (2002)."
KIPP Foundation, "IRS Form 990-PF (2003)."
KIPP Foundation, "IRS Form 990-PF (2004)."
KIPP Foundation, "IRS Form 990-PF (2006)."
KIPP Foundation, "IRS Form 990 (2007)."
KIPP Foundation, "IRS Form 990 (2008)."
KIPP Foundation, "IRS Form 990 (2009)." - 57
The data on KIPP Foundation's expenses by IRS-reported category comes from
KIPP Foundation, "IRS Form 990 (2007)."
KIPP Foundation, "IRS Form 990 (2008)."
KIPP Foundation, "IRS Form 990 (2009)."