Our Report
We have published a more recent review of this organization. See our most recent report on Helen Keller Intl's vitamin A supplementation program.
Helen Keller Intl's vitamin A supplementation program is one of our top-rated charities and we believe that it offers donors an outstanding opportunity to accomplish good with their donations.
More information: What is our evaluation process?
Published: November 2021; Last Updated: September 2022
Summary
What do they do? Helen Keller Intl (Helen Keller) supports programs focused on reducing malnutrition and averting blindness and poor vision; this review focuses only on Helen Keller's work on vitamin A supplementation (VAS) in sub-Saharan Africa. Helen Keller provides technical assistance, engages in advocacy, and contributes funding to government-run vitamin A supplementation programs. (More)
Does it work? There is strong evidence from many randomized controlled trials (RCTs) conducted in the 1980s and 1990s that VAS can substantially reduce child mortality, but weaker evidence on how effective VAS is in the places Helen Keller would work with additional funding in the next few years. Helen Keller has conducted studies to determine whether its mass distribution programs reach a large proportion of targeted children and generally found positive results. We have also investigated the question of what effect Helen Keller's support has on programs and found a number of cases where it seems likely that Helen Keller support is necessary for supplementation to occur. (More)
What do you get for your dollar? We estimate that it costs $1.10 to deliver a vitamin A supplement in Helen Keller-supported programs. The numbers of deaths averted and other benefits of VAS are a function of a number of difficult-to-estimate factors, which we discuss below. (More)
Is there room for more funding? Our most recent analysis finds that Helen Keller Intl currently has $56.9 million in room for more funding—prior to receiving any grants that GiveWell specifically makes or recommends—to support its VAS portfolio in 2022-24. (More)
Helen Keller's vitamin A supplementation program is recommended because:
- VAS is a program with a strong evidence base and strong cost-effectiveness.
- Track record – Helen Keller has experience with supporting VAS programs in a large number of countries.
- Standout transparency – it has shared significant, detailed information about its programs with us.
- Room for more funding – we believe that Helen Keller could productively use more funding than it expects to receive to scale up its VAS activities.
Major open questions include:
- We remain highly uncertain about current rates of vitamin A deficiency among preschool-aged children in areas where Helen Keller supports VAS programs. If rates of vitamin A deficiency are low, it is likely that the impact of Helen Keller's VAS programs would be limited.
Table of Contents
- Summary
- Our investigation process
- What do they do?
-
Does it work?
- Is there independent evidence that the program is effective?
- Are programs targeted at areas where they are likely to be effective?
- Are vitamin A supplements delivered to and ingested by targeted children?
- How does Helen Keller's support affect program outcomes?
- Are there any negative or offsetting impacts?
- What do you get for your dollar?
- Is there room for more funding?
- Helen Keller as an organization
- Sources
Our investigation process
In April 2017, we invited Helen Keller Intl (Helen Keller) to apply to be considered for a top charity recommendation for its vitamin A supplementation program. To date, our investigation of Helen Keller has consisted of:
- Conversations with Helen Keller staff.1
- Reviewing documents Helen Keller shared with us.
- A visit to Conakry, Guinea in October 2017 to meet with representatives of Helen Keller.
What do they do?
Helen Keller Intl (Helen Keller) supports programs focused on reducing malnutrition and averting blindness and poor vision in countries in Africa and Asia; it also provides vision screenings and distributes eyeglasses at schools in the United States.2
In this review, we focus only on Helen Keller's vitamin A supplementation (VAS) programs, which operate in countries in sub-Saharan Africa.3 The World Health Organization (WHO) recommends that all preschool-aged children (aged 6 to 59 months) in areas where vitamin A deficiency (VAD) is a public health problem receive vitamin A supplements two to three times per year.4 Helen Keller supports countries' VAS programs for preschool-aged children by providing technical assistance, engaging in advocacy, and contributing funding to governments for implementing the programs.
What is vitamin A supplementation?
Vitamin A is an essential nutrient that serves many purposes in the body; in particular, the immune and visual systems require it to function properly.5 Essential nutrients must be obtained through diet since the body cannot produce them on its own.6
Vitamin A deficiency (VAD) can cause stunting, anemia, xerophthalmia (dry eyes, which can lead to blindness), increased severity of infections, and death.7 WHO notes that people who have diets containing few animal products and little vitamin A-fortified food may be particularly susceptible to VAD.8 WHO estimates that VAD is most common in its Africa and South-East Asia Regions.9 Infants, children, and pregnant or lactating women with low vitamin A intake appear to have a particularly high risk of the negative health impacts caused by VAD.10
WHO notes that vitamin A from high-dose supplements can be stored in the liver and used as needed in the body for several months.11 To prevent childhood morbidity and mortality, WHO recommends vitamin A supplementation (VAS) every four to six months for all children aged 6 to 59 months in areas where VAD is a public health problem.12
More information about VAS is available in our vitamin A supplementation intervention report.
How are vitamin A supplements distributed and administered to preschool-aged children?
Distribution
Helen Keller-supported VAS programs distribute vitamin A supplements through either mass distribution campaigns or through routine delivery (in which caregivers take their children to facilities to receive VAS every six months).13 We have requested that Helen Keller use future GiveWell-directed funding only for mass distribution campaigns because we have a limited understanding of how to measure Helen Keller's impact on routine delivery programs.
Helen Keller supports two types of VAS mass distribution campaigns:
- Door-to-door campaigns, in which community health workers travel to recipients' homes to distribute and administer vitamin A supplements and other interventions to preschool-aged children.14
- Fixed-site campaigns, in which caregivers bring preschool-aged children to health facilities or outreach posts to receive vitamin A supplements and other interventions.15 Fixed-site campaigns use social mobilization activities (e.g., fliers and radio announcements) to remind caregivers to bring their preschool-aged children to nearby distribution sites during the campaign dates.16
This spreadsheet lists the distribution methods of VAS mass distribution campaigns Helen Keller supported with GiveWell-directed funding in 2018, 2019, and 2020.
Administration
Health workers implementing VAS programs are instructed to cut vitamin A capsules open with scissors and squeeze the contents of the capsules directly into children's mouths.17 Health workers are also instructed to ask caregivers about the age of the child in order to provide the correct dosage of vitamin A: 100,000 IU for 6-11 month-old infants, and 200,000 IU to 12-59 month-old children.18
What is Helen Keller's role in VAS programs?
Helen Keller provides the following types of support to government-run VAS programs:19
- Technical assistance: Helen Keller assists governments with monitoring and evaluation,20 training health workers and managers,21 policy design,22 planning and budgeting,23 and social mobilization24 for VAS programs (details in footnotes). Helen Keller mainly focuses on providing technical assistance at the sub-national level, particularly to districts or regions that may have low VAS coverage rates.25
- Advocacy: Helen Keller encourages national governments to prioritize budgeting for and implementing VAS mass campaigns,26 and advocates for routine distribution of vitamin A supplements through health facilities.27
- Funding: Helen Keller provides grants to governments to cover a portion of the implementation costs of VAS programs.28
UNICEF and Nutrition International (formerly Micronutrient Initiative) also support VAS programs in countries where Helen Keller works. Nutrition International procures the vitamin A supplements used in the programs, and UNICEF provides technical and financial support to geographic regions not supported by Helen Keller.29
Helen Keller's spending on VAS campaigns
Helen Keller's work on VAS campaigns in 2018, 2019, and 2020 was primarily funded by GiveWell-directed funding.30 Details of its spending on VAS campaigns in 2018-2020 can be found in this spreadsheet. In short, in 2020:
- Helen Keller spent a total of $7.6 million on VAS campaigns, up from $5.8 million in 2019 and $3 million in 2018.
- By location, Helen Keller spent between roughly $0.5 and $1.3 million each in Burkina Faso, Côte d'Ivoire, Guinea, Kenya, Mali, Niger, and Nigeria. It also spent a small amount (less than $0.1 million) in the Democratic Republic of Congo (DRC).31 It spent an additional $1.3 million on regional and global support for these country programs.
- By category, Helen Keller spent around 33% on grants to governments for program implementation,32 50% on direct program costs (including campaign logistics, training, monitoring, personnel, travel, equipment, and supplies),33 and 17% on overhead costs.
- Helen Keller's total spending on VAS campaigns was roughly $0.8 million lower than originally budgeted. This difference was due primarily to program disruptions caused by the Covid-19 pandemic, which led campaigns in several countries to be delayed until early 2021.34
- Helen Keller also spent $0.3 million on delivery of VAS through approaches other than campaigns: around $0.1 million in each Cameroon, Senegal, and Sierra Leone.35
Does it work?
This section was last updated in November 2020. The information that Helen Keller has provided since that date is not yet reflected in this section.
We base our expectation of the impact of Helen Keller's VAS campaigns on:
- the evidence of effectiveness of VAS at reducing child mortality,
- characteristics of the areas targeted by Helen Keller's VAS campaigns (including vitamin A deficiency and child mortality), and
- evidence that a high proportion of targeted children receive and ingest vitamin A supplements.
This expectation relies on the assumption that Helen Keller's support of VAS campaigns increases the number of children who receive VAS, compared to the number who would have in the absence of its support. To test whether this assumption holds up, we consider evidence about whether Helen Keller's support of past VAS campaigns either caused those campaigns to occur or increased the coverage rates they achieved.
Finally, we consider whether there are factors that are not accounted for in the above evidence that would offset the impact of Helen Keller's VAS programs, either through reducing their effectiveness or contributing to negative outcomes.
Is there independent evidence that the program is effective?
A large number of RCTs of VAS that were conducted in the 1980s and 1990s found that VAS greatly reduces child mortality. A 1999-2004 trial with more participants than all previous studies combined (the Deworming and Enhanced Vitamin A, or DEVTA, trial) did not find a statistically significant effect on mortality. We remain uncertain about what could explain this difference in results.
Further details on trials of VAS:
- A Cochrane systematic review and meta-analysis of sixteen randomized controlled trials and one quasi-randomized trial conducted in the 1980s and 1990s (Imdad et al. 2010) finds that VAS reduces mortality of 6 to 59-month-old children by 24% (95% confidence interval 17% to 31% reduction in mortality rates).36 The Deworming and Enhanced Vitamin A (DEVTA) study, a more recent trial (taking place between 1999-2004 and published in 2013) in India with around one million participants, estimates that VAS reduced child mortality by 4% and cannot rule out the possibility that VAS did not affect child mortality at all (the 95% confidence interval ranged from a 3% increase in child mortality to an 11% decrease).37 An updated version of the Cochrane review (Imdad et al. 2017) combined DEVTA and another smaller recent trial (Fisker et al. 2014) with previous trials.38 Its fixed-effect meta-analysis finds that VAS causes a 12% reduction in child mortality (95% confidence interval 7% to 17% reduction) and its random-effects meta-analysis finds that VAS causes a 24% reduction in child mortality (95% confidence interval 17% to 31% reduction).39 (See the following footnote for a description of the differences between fixed-effect and random-effects meta-analyses.)40 Even though the overall effect found in the updated meta-analysis remains statistically significant, it is unlikely that differences between the results of DEVTA and earlier trials were due to random chance alone.41
- We are uncertain about what could explain why the earlier trials and DEVTA found such different results. Some potential explanations include:
- The population treated by DEVTA had lower baseline child mortality rates and may have had better overall health than many previously studied populations.42 Deaths averted by VAS in worse-off populations may have already been averted through other means (e.g., increased vaccination rates) in the DEVTA population.43 This hypothesis is undermined somewhat by the apparent lack of a correlation between how much mortality risk was reduced and baseline mortality rate in non-DEVTA trials.44
- Some researchers not involved in the study have pointed to evidence suggesting that DEVTA may have failed to achieve as high a coverage rate as it reported.45
- DEVTA may have had methodological weaknesses that caused it to fail to detect a statistically significant mortality effect, even if VAS had a real effect on mortality rates in the population studied (details in footnote).46
For more details, see our vitamin A supplementation intervention report. A shorter summary of our views is available in our blog post on vitamin A supplementation programs.
Are programs targeted at areas where they are likely to be effective?
We have several sources of uncertainty about how to apply evidence from the trials discussed above to the contexts in which VAS programs operate today, including:
- More children in today's contexts may be receiving vitamin A through food fortification programs or improved diets than children in the earlier contexts did. There appears to be limited information available on current rates of vitamin A deficiency (VAD) in the populations targeted by VAS.
- Child mortality rates in developing countries have decreased substantially over the past few decades. It is possible that deaths that may have been averted by VAS in worse-off populations in the past may already be averted through other means (e.g., increased immunization rates) in today's contexts.
To estimate what effect we should expect from VAS in locations where Helen Keller supports VAS programs, we have considered the following questions:
- How prevalent is vitamin A deficiency in areas where Helen Keller works?
- How high are child mortality rates in areas where Helen Keller works?
How prevalent is vitamin A deficiency in areas where Helen Keller works?
There is limited recent data on the prevalence of vitamin A deficiency (VAD) among populations targeted by Helen Keller's VAS programs. Our best estimate, using data from a model of VAD prevalence created by the Institute for Health Metrics and Evaluation's Global Burden of Disease project, is that the prevalence of VAD among preschool-aged children in countries where Helen Keller works or plans to work is between 25% and 36%. We estimate that the prevalence of VAD in populations represented in the meta-analysis of the effect of VAS on mortality was roughly 59%. Based on these estimates, we expect that VAS has a smaller impact on child mortality rates in populations reached by Helen Keller's programs today than the impact on mortality found in populations studied in VAS trials. We incorporate this adjustment into our cost-effectiveness analysis of Helen Keller (see below).
It appears unlikely that low rates of vitamin A deficiency (VAD) explain the DEVTA results, but it is still plausible that low rates of VAD in an area may indicate that VAS programs will have a limited effect on mortality there.47 (See footnote for arguments on ways in which VAD rates may not be indicative of the impact of VAS on child mortality; we have not yet evaluated these arguments carefully.)48
The prevalence of VAD in a population can be estimated using representative surveys of serum retinol concentrations or retinol-binding protein (measured in blood samples), clinically assessed eye signs of VAD (e.g., Bitot's spots, xerophthalmia), or other measures.49 WHO defines VAD as being indicated by a serum retinol concentration lower than 0.70 μmol/L, and severe VAD as a serum retinol concentration lower than 0.35 μmol/L.50
Our estimates for the prevalence of VAD among populations studied in trials included in Imdad et al. 2017 are in this spreadsheet ("Imdad 2017 - VAD prevalence estimates" sheet). We consider our weighted average estimate of 59% prevalence of VAD in populations studied in VAS trials to be a rough best guess, based on limited data. Our process and sources for creating this estimate are outlined in the following footnote.51
We remain uncertain about the prevalence of VAD among preschool-aged children in areas where Helen Keller works after considering the following sources of information:
- Vitamin A deficiency surveys: We have listed the most recent serum retinol and retinol-binding protein surveys of preschool-aged children in countries where Helen Keller supports or plans to support VAS mass campaign programs in this spreadsheet. Notes on this data:
- Of the nine countries where Helen Keller supports or plans to support VAS mass campaign programs, two have completed nationally-representative surveys of VAD (using serum retinol or retinol-binding protein biomarkers) among preschool-aged children in the past ten years. The remaining countries completed VAD surveys more than ten years ago, or have not ever completed any.52
- The majority of these surveys find VAD prevalence among preschool-aged children in the "severe" range as defined by WHO (above 20% prevalence).53 But one of the more recent surveys, from Kenya in 2012, found prevalence rates in the "mild" range.54 Malawi and Ghana have not received support from Helen Keller for VAS programs, but have implemented VAD surveys in the past five years—a very low prevalence of VAD among preschool-aged children was reported from a 2015-16 survey in Malawi (4%), and a relatively high rate (21%) was found in Ghana in 2017.55
- VAS appears to have only a temporary impact on measures of serum retinol and retinol-binding protein concentrations.56 Accordingly, measures of serum retinol or retinol-binding protein may not be useful for evaluating the impact of a VAS program—instead, they may reflect whether or not dietary vitamin A intake is adequate.57
- We have not searched for recent surveys of the prevalence of Bitot's spots or other eye signs of VAD; our understanding is that these indicators of VAD may be responsive to VAS, and so would not be useful as an indicator of "underlying" VAD in a population reached by a VAS program, but we have not investigated this issue in depth.58
- Stevens et al. 2015 incorporates the most recent available VAD surveys and other relevant information (e.g., availability of animal-source foods) into a mathematical model to estimate rates of VAD as of 2013.59 We have not carefully reviewed the methodology used in this paper. Stevens et al. 2015 concludes that VAD was likely to be high (above 40%) in 2013 throughout sub-Saharan Africa.60 Three more recent vitamin A deficiency surveys from Sierra Leone, Malawi, and Kenya found considerably lower rates of VAD among preschool-aged children than the lower bound estimate for sub-Saharan African countries in Stevens et al. 2015.61
- Vitamin A food fortification: Excluding the Democratic Republic of the Congo, all countries in which Helen Keller supports or plans to support VAS mass campaign programs mandate that vegetable oil be fortified with vitamin A. A few others mandate or allow fortification of wheat flour or sugar with vitamin A as well. (Some countries also have programs encouraging the consumption of crops biofortified with vitamin A, but we have not investigated these programs in depth.)62
See details in this spreadsheet. We are uncertain about whether these food fortification programs have had impacts on rates of VAD among preschool-aged children in these countries. Our key findings:
- In most countries in which Helen Keller has recently supported or plans to support VAS mass campaign programs, we have not seen any household- or market-level surveys testing whether food samples are adequately fortified.63
- A market-level survey of vegetable oil in the city of Abidjan, Côte d'Ivoire, found that nearly all samples were adequately fortified, but other surveys we have seen found relatively low rates of adequately-fortified oil.64
- Engle-Stone et al. 2017 found that rates of VAD among preschool-aged children in two cities in Cameroon did not significantly decline between 2009 and 2012, despite vitamin A fortification of vegetable oil becoming mandatory in 2011.65
- Conversations with Helen Keller and experts on vitamin A deficiency: We have discussed our concerns about the lack of recent data on vitamin A deficiency with Helen Keller. Helen Keller told us that it believes it would be very surprising if vitamin A deficiency were no longer a problem throughout sub-Saharan Africa, especially in countries with high child mortality and malnutrition rates.66 Dr. Sherry Tanumihardjo, an expert on vitamin A status assessment, has told us that since many vitamin A oil fortification programs in countries in sub-Saharan Africa are relatively new, it would not be surprising if many of the programs were not yet functioning well enough to have an impact on VAD rates among preschool-aged children.67
In 2018, we took the information above into account to form a subjective best guess of VAD prevalence among populations targeted by Helen Keller's VAS campaigns.68 In 2019, following a conversation with the Institute for Health Metrics and Evaluation (IHME), we decided to instead use VAD prevalence estimates from its Global Burden of Disease (GBD) project.69 IHME's modeling takes past vitamin A deficiency survey results, vitamin A supplementation coverage, a socio-demographic index, and an estimate of the availability of vitamin A in a country's food supply into account (excluding fortified foods).70 IHME's estimates indicate that, as of 2017, VAD prevalence ranged from 25% to 36% among children aged 6 to 59 months in countries where Helen Keller is supporting or plans to support VAS campaigns.71
We would guess that IHME's estimates of the prevalence of VAD are more likely to be accurate than our subjective best-guesses, but our confidence in this judgment is limited for the following reasons:
- IHME told us that its model does not take vitamin A food fortification into account.72 We are uncertain how much we should expect vitamin A food fortification programs to affect VAD prevalence.
- IHME's vitamin A deficiency modeling takes vitamin A supplementation coverage into account, so a country with high coverage for vitamin A supplementation over time would be estimated to have lower vitamin A deficiency.73 To estimate the impact of VAS, we would ideally like to consider estimates of what VAD prevalence would be in absence of VAS programs.
How high are child mortality rates in areas where Helen Keller works?
Child mortality rates in countries where Helen Keller works are lower than child mortality rates of some populations studied in trials of VAS in the 1980s and 1990s, but not so much lower that we would expect that Helen Keller's programs would be unlikely to be effective on average. (See above for an explanation of why VAS may have a limited impact on preventing additional child mortalities in populations where baseline rates are already relatively low.)
For the nine countries where Helen Keller is supporting or plans to support VAS mass campaign programs, we estimate that mortality rates for children aged 6 to 59 months range from 4.6 to 19.0 deaths per 1,000 child-years as of 2017.74 Some major VAS trials took place in contexts where baseline mortality rates were considerably higher than these rates (see Table 1 below). Trials listed in Table 1 with baseline child mortality rates of 10.6 per 1,000 child-years or higher found that VAS significantly reduced child mortality, but the trials with lower baseline rates did not find statistically significant effects.75
Three out of the nine countries where Helen Keller supports or plans to support VAS programs have mortality rates below 10.6 per 1,000 child-years.76
For comparison, control group child mortality rates in the six main trials included in Imdad et al. 2017 are presented in the following table. 19 trials are included in the all-cause mortality meta-analysis in Imdad et al. 2017, but we focus on these six trials because they account for around 90% of Imdad et al. 2017's weighted mean estimate of the effect of VAS on mortality.77
Table 1: Characteristics of the six main studies used in the Cochrane review's estimate of the effect of VAS on all-cause mortality
| Study | Age group | Control group mortality per 1,000 child-years | Mortality risk ratio (95% CI) | Deaths/Child-years in treatment vs. control |
|---|---|---|---|---|
| Awasthi et al. 2013 (DEVTA) | 12 to 72 months | 5.3 | 0.96 (0.89 – 1.03)78 | 12,467/2,464,490 vs. 13,217/2,496,62079 |
| Ross et al. 1993 | 6 to 90 months | 29.9 | 0.81 (0.68 – 0.98) | 397/16,508 vs. 495/16,77980
|
| West et al. 1991 | 6 to 72 months | 16.4 | 0.70 (0.56 – 0.88) | 152/13,175 vs. 210/12,79581
|
| Herrera et al. 1992 | 9 to 72 months | 5.3 | 1.06 (0.82 – 1.37) | 120/21,515 vs. 112/21,22482 |
| Daulaire et al. 1992 | 1 to 59 months | 12.6 | 0.74 (0.55 – 0.99) | 138/1,480 vs. 167/1,32383 |
| Sommer et al. 1986 | 0 to 71 months | 10.6 | 0.73 (0.54 – 0.99) | 101/12,991 vs. 130/12,20984 |
There are major limitations to our analysis so far of baseline child mortality rates in areas where Helen Keller works. In particular:
- We have only reviewed data on national average child mortality rates. It would be more appropriate to use regional or local mortality data to evaluate the impact of Helen Keller's sub-national technical assistance work. We have not yet looked into whether reasonably high-quality data exist at the sub-national level.
- It seems unlikely to us that there is a real baseline mortality rate "threshold" for the effectiveness of VAS (i.e., that VAS has an impact on child mortality when baseline rates are above 10.6 per 1,000 child-years, but no effect when baseline rates are below 10.6 per 1,000 child-years). We compare baseline mortality rates in areas where Helen Keller works to 10.6 per 1,000 child-years because it may be useful as a general indication of where VAS programs are more or less effective at reducing mortality.
- We are uncertain whether VAS might have an impact on all mortalities caused by infectious diseases, or only a subset of specific infectious diseases. (It does not seem plausible to us that VAS could have an impact on other causes of child mortality, like accidents.) The only statistically significant cause-specific mortality reduction effect found in a meta-analysis of trials of VAS for preschool-aged children was for diarrhea.85 The same meta-analysis found a statistically significant reduction in measles incidence, but not mortality.86 See our analysis comparing mortality rates and causes of mortality between populations studied in VAS trials and targeted populations in countries where Helen Keller works in this spreadsheet, "External validity by country" sheet.
Are vitamin A supplements delivered to and ingested by targeted children?
Helen Keller conducts coverage surveys to determine what proportion of the target population (children aged 6-59 months) was reached with VAS in the relevant campaign. We use results from past campaigns to understand the impact we should expect future campaigns to have. Specifically, we use coverage survey results about the proportion of targeted children reached, along with data on program spending, to estimate the cost of treating a child with VAS. Our interpretation of these coverage survey results is informed by their comprehensiveness and the methodology used to collect them.
Comprehensiveness
See this spreadsheet for all results we have seen from Helen Keller's VAS campaigns.
In 2018, Helen Keller began supporting VAS campaigns with GiveWell-directed funds. That year, Helen Keller supported eight such campaigns: two each in Burkina Faso, Côte d'Ivoire, Guinea, and Mali. We have seen results from all five coverage surveys that took place; surveys did not take place for three campaigns.87 In 2019, Helen Keller supported eleven VAS campaigns: one in Mali and two each in Burkina Faso, Côte d'Ivoire, Guinea, Kenya, and Niger. We have seen results from all seven coverage surveys that took place; surveys did not take place for four campaigns.88 The surveys we have seen from 2018 and 2019 represent around 65% of Helen Keller's total spending on VAS campaigns in those years.89 While this constitutes substantial evidence for the impact of Helen Keller's VAS campaigns, we note that it is less thorough than monitoring we have seen from some of our other top charities. Our confidence that we are seeing a representative picture of Helen Keller's work is increased by the fact that in 2018 we saw coverage surveys from all four countries where Helen Keller supported VAS campaigns, and in 2019 we saw coverage surveys from five of six countries where Helen Keller supported VAS campaigns (the exception being Kenya).90 We incorporate this assessment into our cost-effectiveness model.91
Helen Keller has also shared coverage surveys from VAS campaigns conducted prior to 2018. We have reviewed these surveys but put limited weight on their results92 because they cover a relatively small portion of Helen Keller's past work93 and many were conducted in areas where Helen Keller expected coverage to be low.94 We have focused on reviewing results from 2018 and 2019, as we believe they are more likely to be indicative of what we can expect from future VAS campaigns that Helen Keller supports using GiveWell-directed funds.
Methodology
In Helen Keller's coverage surveys, data collectors visit a sample of households and ask household members whether the eligible children in those households received VAS during the relevant campaign. As noted above, we have focused on understanding the methodology used in the coverage surveys conducted for campaigns in 2018 and 2019 that were supported with GiveWell-directed funds. Full details of the methodology used in those surveys are in this spreadsheet.
In 2019, Helen Keller developed a revised coverage survey guide,95 with a new sampling methodology.96 As such, the remainder of this section focuses on the methodology used in the coverage surveys conducted for campaigns in 2019, along with results from those surveys.
Below, we summarize Helen Keller's general 2019 coverage survey methodology and discuss methodological strengths and weaknesses. Overall, we believe that Helen Keller's coverage surveys are designed to measure key indicators of the success of VAS campaigns and to achieve samples that are generally representative of target populations. However, we are concerned that the self-reported nature of responses may produce bias in results. We are also uncertain about the quality of survey implementation because we have not seen results from the procedure used to audit data collectors' work. We incorporate our assessment of the quality of Helen Keller's coverage survey methodology into our cost-effectiveness model97 and into our qualitative assessment of Helen Keller's organizational strength.
- Respondent selection: Helen Keller's 2019 coverage surveys employed two-stage cluster sampling of households in the relevant study area.98
In each survey, the study area was subdivided into smaller "enumeration areas," which were stratified as either urban or rural and in some cases by an additional quality (e.g., Helen Keller-supported or non-Helen Keller-supported).99
Enumeration areas were then selected randomly, generally with probability proportional to size, from each stratum.100
Next, data collectors performed a census of all eligible households in selected enumeration areas.101
Census data was sent to the central supervision team, which randomly selected ten eligible households (i.e., households that contained at least one child aged 6-59 months) per enumeration area. All eligible children in selected households were surveyed.102
We expect this selection protocol to result in a sample that is generally representative of the target population. We believe that bias may be introduced by data collectors during the household census, either unintentionally (if households are missed) or intentionally (if they only include households that are easier to reach).103 We believe both possibilities would bias results upward, as households missed by data collectors may also have been missed by the relevant campaign. We note that we have not seen evidence that this occurred and note it only as a possibility.
If a selected household is unavailable, data collectors are instructed to return up to two additional times to attempt to interview that household.104 The coverage survey reports for the first 2019 campaign in Burkina Faso and the second 2019 campaign in Côte d'Ivoire state that replacement households were provided to data collectors;105 we do not know how often replacement households were used in those cases. Our understanding is that replacement households were not provided in other surveys.106
In the surveys we have reviewed, 99% or higher of the targeted number of households were interviewed.107 This low sample attrition (i.e., households randomly selected to be interviewed not being interviewed) is unsurprising, as household interviews were conducted shortly after the household census.
- Survey design: Helen Keller has developed standard questionnaires,108
which in 2019 were adapted for use in each country and translated into local languages. Each of the 2019 coverage surveys we have reviewed included a pilot survey, during which questionnaires were tested and updated prior to survey implementation.109
The adaptation, translation, and piloting of questionnaires in each setting increases our confidence that they are administered appropriately and consistently across contexts.
A potential source of bias in Helen Keller's coverage surveys is their heavy reliance on self-reported responses. The questionnaire used during household interviews instructs data collectors to ask household members questions about VAS and other interventions, such as deworming, received by each eligible child in the household during the relevant campaign.110 We believe that these responses are at risk of recall bias, as respondents must answer questions about multiple interventions and possibly multiple children. This concern is mitigated by the fact that in most cases, the recall period for these responses was relatively short, about one month.111 Self-reported responses are also at risk of social desirability bias that could lead respondents to overreport VAS administration, if they believe that this is the preferred response of data collectors.
We would have more confidence in a survey that tested the reliability of self-reported responses against some objective measure. The questionnaire instructs data collectors to show household members vitamin A capsules and deworming tablets (or photos of these items) when asking questions about these treatments,112 but while these visual aids may improve accurate recall, they are not used to verify responses (for example, by asking respondents to identify these items before they are asked if eligible children received them).
- Survey implementation: Helen Keller contracts with independent consultants that recruit data collectors and supervisors and oversee survey implementation. Generally, data collectors and supervisors were not involved in VAS campaign implementation,113
which suggests that they are unlikely to have a personal interest in survey outcomes.
Helen Keller's 2019 coverage surveys included an auditing procedure in which supervisors randomly selected and then re-surveyed 10% of households in order to assess the accuracy of initial results, to which they were blinded.114 We see the inclusion of such a procedure as a methodological strength, both because it may encourage accurate data collection and because it provides a check on the accuracy of results. However, we have not seen data on the level of correspondence found between initial and re-survey results.115 We are thus uncertain about the quality of survey implementation.
- Data capture: Data was collected electronically.116 One concern we have about coverage surveys in general is that data may be lost after being collected. However, we believe it is unlikely that substantial data loss occurred after collection in Helen Keller's 2019 coverage surveys. This is because, as mentioned above, in the surveys we have reviewed, data was collected and uploaded from 99% or higher of the number of households that were targeted to be interviewed.117
Results
We believe that results from Helen Keller's coverage surveys provide relatively strong evidence that a high proportion of the target population has been reached with VAS in past campaigns. We use results about the proportion of targeted children reached, along with data on program spending, to estimate the cost of treating a child with VAS.
See this spreadsheet for all results we have seen from Helen Keller's VAS campaigns. In short, in 2019:
- The median coverage rate from surveys of campaigns that were supported by Helen Keller using GiveWell-directed funds was 85%.118
- The lowest coverage rate measured by these surveys was 74%, from the first VAS campaign of the year in two regions of Mali supported by Helen Keller.119 The highest coverage rate was 94%, from the first VAS campaign of the year in six regions of Niger supported by Helen Keller.120
- 75% of these surveys measured coverage rates above 80%,121
which is the coverage rate targeted by Helen Keller for its VAS campaigns.122
How does Helen Keller's support affect program outcomes?
The evidence we have discussed to this point forms the basis of our expectation of the impact of Helen Keller's VAS campaigns. This expectation relies on the assumption that Helen Keller's support of VAS campaigns increases the number of children who receive VAS, compared to the number who would have in the absence of its support. To test whether this assumption holds up, we have considered evidence about whether Helen Keller's support of past VAS campaigns either caused those campaigns to occur or increased the coverage rates they achieved. We have found strong evidence in some cases that Helen Keller's financial support enables VAS mass campaigns to occur.
Helen Keller's support may impact the outcome of VAS mass campaigns in the following ways:
- Increasing coverage rates: Helen Keller identifies districts or regions participating in mass campaigns that have low VAS coverage rates and provides sub-national governments in those regions with technical support.123
- Causing VAS campaigns to occur: In the absence of external technical assistance and funding, Helen Keller told us that VAS campaigns and programs would not occur at all in some countries.124
We have completed case studies on the types of impact Helen Keller's involvement may have on VAS mass campaigns for a selection of Helen Keller's past country programs. Helen Keller selected the countries for these case studies based on the availability of in-country staff for phone interviews; we are uncertain how representative our five country case studies are of the thirteen countries in which Helen Keller has recently supported VAS programs.
In our case studies, we found strong evidence in a few cases that Helen Keller's financial support enables mass distributions of VAS to occur. We have not yet seen evidence we find convincing that Helen Keller's technical assistance enables mass distribution programs to achieve higher coverage rates than the programs would achieve in Helen Keller's absence, primarily because we lack information about coverage rates in areas without Helen Keller-supported programs (details in footnote).125
The full details of our case studies are available in this spreadsheet.
Are there any negative or offsetting impacts?
In this section, we consider factors that are not accounted for in the above evidence that could offset the impact of Helen Keller's VAS campaigns, either through reducing their effectiveness or contributing to negative outcomes.
- Potential VAS interaction with vaccines and increased mortality in some groups: Benn et al. 2009 reanalyzed data from an earlier VAS trial in Ghana to test the hypothesis that VAS reduced mortality in children whose most recent vaccine was a live vaccine (e.g., measles), but could lead to increased mortality in children (particularly girls) whose most recent vaccine was an inactivated vaccine (e.g., DTP).126 The data re-analysis found that VAS was associated with nonsignificant increases in mortality among girls who had received vaccinations.127 The authors of Fisker et al. 2014, a 2007-2010 trial in Guinea-Bissau of VAS, intended for the trial to test for interactions between VAS, live or inactivated vaccines, and gender.128 The trial found no significant effect on mortality overall, a nonsignificant increase in mortality for boys, and no evidence of a differential effect based on receiving live or inactivated vaccines.129 Based on the results of Fisker et al. 2014, it does not appear that increased mortality following VAS and live or inactivated vaccinations for boys or girls is a substantial concern. We have also completed research on the biological plausibility of interactions between VAS, vaccines, and sex, and did not find reasons to believe that harmful impacts are highly plausible (details in footnote).130
- Adverse side effects of vitamin A supplements: Some preschool-aged children experience side effects after taking vitamin A supplements, including loose stools, headache, irritability, fever, nausea, and vomiting.131 WHO cites an estimate of the prevalence of these types of side effects of 1.5% to 7%; we have not vetted this estimate.132
- Potential vitamin A overdose: Chronic excessive vitamin A intake can cause a serious condition called vitamin A toxicity (also known as hypervitaminosis A).133 Our understanding is that cases of vitamin A toxicity are very rare globally, and that VAS programs are not thought to be a cause of cases of vitamin A toxicity.134
- Diversion of skilled labor: VAS mass campaigns involve Ministry of Health staff, nurses, and other health workers.135 We are uncertain of the degree to which participating in VAS programs reduces their ability to complete other duties, but we note that our understanding is that VAS campaigns usually take between a few days and a few weeks to complete.136
What do you get for your dollar?
This section was last updated in November 2020. The information that Helen Keller has provided since that date is not yet reflected in this section.
Cost per vitamin A supplement delivered
We estimate that on average the total cost to deliver a vitamin A supplement through Helen Keller-supported mass distribution programs is $1.10, using information from programs implemented in 2018 and 2019.
Our approach
For programs that distribute health commodities, our general approach for calculating a "cost per item delivered" estimate is to identify comparable data on costs and items delivered and take the ratio.
We try to include all costs incurred to carry out a project, not just those that the charity in question pays for itself. We start with this total cost figure and apply adjustments in our cost-effectiveness analysis to account for cases in which we believe the charity's funds have caused other actors to shift funds from a less cost-effective use to a more cost-effective use ("leverage") or from a more cost-effective use to a less cost-effective use ("funging").
We prefer to calculate average "cost per item delivered" estimates using data from a broadly representative sample of mass distribution rounds, since costs may vary considerably in different contexts.
We have used the following inputs to construct our cost per supplement estimate for Helen Keller:
- Helen Keller's actual expenditures for VAS distribution rounds in 2018 and 2019 in Guinea, Mali, Burkina Faso, and Niger.137
- Rough estimates of expected spending by other organizations supporting VAS distribution rounds in Guinea, Mali, Burkina Faso, and Niger in 2018 and 2019, including UNICEF, Nutrition International, the World Health Organization (WHO), World Vision, and Save the Children.138
- An assumption about the amount that the governments of Guinea, Mali, Burkina Faso, and Niger will contribute to VAS programs in the form of in-kind contributions.139
- An estimate of the number of children who received vitamin A supplements, based on estimates from Helen Keller of the number of children in Guinea, Mali, Burkina Faso, and Niger aged 6-59 months and the results of Helen Keller's coverage surveys we have seen from GiveWell-supported campaigns.140
Our cost per supplement estimate
Using the approach described in the section above, we estimate that it costs $1.10 on average to deliver a vitamin A supplement in Helen Keller-supported VAS mass distribution programs. Full details are in this spreadsheet.
Shortcomings of our cost per supplement analysis
The following are key limitations of our cost per supplement analysis:
- We have limited information on the contributions of organizations other than Helen Keller supporting VAS mass campaigns in Guinea, Burkina Faso, Mali, and Niger in 2018 and 2019 (UNICEF, Save the Children, Nutrition International, WHO, World Vision, and the Global Fund to Fight AIDS, Tuberculosis, and Malaria).141 We have only seen information on how much funding these organizations have budgeted for government grants to support program implementation, but our cost per supplement estimate also relies on rough estimates of how much additional funding these organizations will use for other expenses, including personnel and overhead costs.142
- We rely on an estimate that 30% of overall program costs are indirect government costs (e.g., time-use of salaried government officials), the same estimate we use for the Schistosomiasis Control Initiative's deworming programs. We would guess that VAS programs and deworming programs require similar types of contributions from governments, but we note that the 30% estimate is derived from a single deworming program in Niger.143
- Our cost per supplement estimate also relies on Helen Keller's estimates of the population of 6-to-59-month-old children in Guinea, Mali, Burkina Faso, and Niger.144 We are uncertain about the accuracy of these population estimates.
- We only have cost per supplement estimates for Guinea, Mali, Burkina Faso, and Niger, but Helen Keller also currently supports VAS campaigns in Côte d'Ivoire and Kenya.145 We do not include cost per supplement estimates for Côte d'Ivoire and Kenya in our analysis because we have seen limited information from Helen Keller's programs in those countries to date (details in footnote).146
Cost-effectiveness
See our most recent cost-effectiveness model for estimates of the cost per life saved through Helen Keller's VAS programs.
There are limitations to this kind of cost-effectiveness analysis, and we believe that cost-effectiveness estimates such as these should not be taken literally, due to the significant uncertainty around them. We provide these estimates (a) for comparative purposes and (b) because working on them helps us ensure that we are thinking through as many of the relevant issues as possible.
Helen Keller-supported VAS campaigns also deliver additional interventions alongside VAS, including deworming, polio vaccination, "mop-up" immunizations (for children who have missed scheduled immunizations), and screening for severe acute malnutrition and moderate acute malnutrition.147 A major limitation of our cost-effectiveness analysis of Helen Keller is that we do not directly include benefits resulting from interventions delivered alongside VAS in Helen Keller-supported programs.148
Is there room for more funding?
We conduct "room for more funding" analysis to understand what portion of Helen Keller Intl's ideal future budget it will be unable to support with the funding it has or should expect to have available. We may then choose to either make or recommend grants to support those unfunded activities. Our most recent analysis finds that Helen Keller Intl currently has $56.9 million in room for more funding—prior to receiving any grants that GiveWell specifically makes or recommends—to support its VAS portfolio in 2022-24.
Room for more funding analysis
In general, we assess top charities' funding needs over a three-year period.149 We ask top charities to report their ideal budgets over the next three years, along with information about their current available funding and funding pipeline. The difference between a charity's three-year budget and the funding we project that it will have available to support that budget is the charity's "room for more funding."
For this analysis, we focus only on Helen Keller's programs supporting VAS mass campaigns.
The main components of our room for more funding analyses are:
- Available funding. We ask top charities to report how much funding they currently hold in the bank, including in reserves,150 and how much of this funding is committed or expected to be spent on specific future activities. The difference between these figures is the amount available to allocate to the charity's unfunded spending opportunities.
- Expected funding. We project the amount of additional funding that top charities will receive to support their work over the next three years. These projections represent our best guesses based on top charities' past revenue and our understanding of their funding pipelines. They typically include funding currently held by GiveWell to be granted to the top charity, projected funding due to being a GiveWell top charity,151 and, if the top charity is part of a larger organization, projected unrestricted funding from that parent organization. They exclude any funding we may specifically recommend to the top charity subsequent to the analysis. We add this projected funding to the amount available to allocate to the charity's unfunded spending opportunities.
- Spending opportunities. We ask top charities to report their ideal budgets in each of the next three years and to provide details on the specific spending opportunities included in these budgets. These opportunities are typically presented as one program year in a specific implementation geography (for example, VAS in Nigeria in 2024), and they can represent either an extension of the top charity's previous support to a geography or an expansion of support to a new geography. We ask top charities to report the order in which they would prioritize funding these opportunities, which helps us to understand how available and expected funding will be allocated and what the marginal impact of additional funding beyond that amount would be.
A charity's room for more funding represents the total budget for the charity's spending opportunities, less its available and expected funding. For example, if a charity proposes spending $50 million over the next three years and holds $10 million in uncommitted funding, and we project that it will receive an additional $15 million in revenue over the next three years, that charity's room for more funding is $25 million. (Note that a charity's total room for more funding figure includes funding gaps at all levels of cost-effectiveness—see below.) Our most recent analysis of Helen Keller Intl's room for more funding can be found in this spreadsheet.
Grant investigation process
Room for more funding analysis is a key part of our grant investigation process. We periodically request the information described above from top charities and update our room for more funding analyses. Our default is to update each top charity's room for more funding analysis annually, though we may choose to do so more or less frequently. The cadence on which we conduct updates depends largely on how often we grant funding to a top charity152 and how much we expect that charity's funding and budgets to have changed since our most recent funding decision.153 We have typically updated our analysis of Helen Keller Intl's room for more funding on an annual basis. Our most recent analysis of Helen Keller Intl's room for more funding can be found in this spreadsheet.
After completing such an update, we may then choose to investigate potential grants to support the spending opportunities that we do not expect to be funded with the charity's available and expected funding, which we refer to as "funding gaps." The principles we follow in deciding whether or not to fill a funding gap are described on this page.
The first of those principles is to put significant weight on our cost-effectiveness estimates. We use GiveDirectly's unconditional cash transfers as a benchmark for comparing the cost-effectiveness of different funding gaps, which we describe in multiples of "cash." Thus, if we estimate that a funding gap is "10x cash," this means we estimate it to be ten times as cost-effective as unconditional cash transfers. As of this writing, we have typically funded opportunities that meet or exceed a relatively high bar: 8x cash, or eight (or more) times as cost-effective as GiveDirectly's unconditional cash transfers. (Note that a charity's total room for more funding figure includes funding gaps at all levels of cost-effectiveness.)
If we decide to fill a funding gap, we either make a grant from our Top Charities Fund154 or recommend that another funder—typically Open Philanthropy155 —makes a grant. This page lists all grants made or recommended by GiveWell. Typically, when GiveWell donors make a donation to a top charity,156 we don't expect that donation to be directed to a specific funding gap, but rather to contribute to supporting the overall portfolio of opportunities included within a charity's room for more funding.
Helen Keller Intl's room for more funding
Our most recent analysis of Helen Keller Intl's room for more funding can be found in this spreadsheet. In that analysis, we estimate that Helen Keller Intl has $56.9 million in room for more funding—prior to receiving any grants that GiveWell specifically makes or recommends—to support its VAS portfolio in 2022-24. In sheet "RFMF projections," we present this figure broken down by funding gap.
We will consider making or recommending grants to fill each of these funding gaps. As of this writing, we expect to have sufficient funding at our discretion to fill all funding gaps we identify among our top charities that meet our current cost-effectiveness bar of 8x cash or better; we also expect to fill some funding gaps in the 5-8x cash range (for more details, see this blog post). Our top recommendation to GiveWell donors seeking to do the most good possible is to donate to the Top Charities Fund, which we allocate quarterly to the charity with the highest-priority funding gap(s).Helen Keller as an organization
We use qualitative assessments of our top charities to inform our funding recommendations. See this page for more information about this process and for our qualitative assessment of Helen Keller as an organization.
Sources
- 1
We have published notes from some of our conversations with Helen Keller staff:
- 2
- "Founded in 1915, Helen Keller International is dedicated to saving and improving the sight and lives of the world's vulnerable by combatting the causes and consequences of blindness, poor health and malnutrition.
"We currently have more than 120 programs in 20 African and Asian countries.
"Part of this work is focused on preventing blindness and vision loss for millions of vulnerable people through cataract surgery, vision correction, vitamin A supplementation, screening and treatment for diabetic retinopathy, and distribution of treatments and cures for neglected tropical diseases.
"We also work to reduce malnutrition by promoting solutions aimed at improving nutrition practices for millions of families. These include vitamin A supplementation, maternal and child nutrition education, fortification of staple foods with essential nutrients, globally recognized family-led agricultural programs and community-based management of acute malnutrition." HKI website About Us
- "United States: We provide the gift of clear vision to tens of thousands of children every year by providing free school-based vision screenings, prescription eyeglasses, and referral for further care through our innovative ChildSight program." HKI website Where we work
- "Founded in 1915, Helen Keller International is dedicated to saving and improving the sight and lives of the world's vulnerable by combatting the causes and consequences of blindness, poor health and malnutrition.
- 3
This spreadsheet lists the countries where Helen Keller supported VAS campaigns with GiveWell-directed funding in 2018, 2019, and 2020.
- 4
- WHO Guideline: Vitamin A supplementation in infants and children 6-59 months of age 2011:
- "In settings where vitamin A deficiency is a public health problem, vitamin A supplementation is recommended in infants and children 6–59 months of age as a public health intervention to reduce child morbidity and mortality (strong recommendation). The quality of the available evidence for all-cause mortality was high, whereas for all other critical outcomes it was moderate to very low. The quality of the available evidence for outcomes in human immunodeficiency virus (HIV)- positive children was moderate for all-cause mortality." Pg 1.
- One dose of 100,000 IU of vitamin A is recommended for infants aged 6 to 11 months of age, and a 200,000 IU dose of vitamin A is recommended for children 12 to 59 months of age every four to six months. Table 1, Pg 5.
- WHO defines vitamin A deficiency to be of mild public health importance when rates of vitamin A deficiency (defined as a measure of serum or plasma retinol <0.70 µmol/l) among preschool-aged children or pregnant women are between 2% and 10%, moderate public health importance when rates of vitamin A deficiency among preschool-aged children or pregnant women are between 10% and 20%, and severe public health importance when rates of vitamin A deficiency among preschool-aged children or pregnant women are greater than or equal to 20%. WHO Global prevalence of vitamin A deficiency in populations at risk 2009, Pg 8, Table 5.
- WHO Guideline: Vitamin A supplementation in infants and children 6-59 months of age 2011:
- 5
- "Vitamin A is an essential nutrient needed in small amounts for the normal functioning of the visual system, and maintenance of cell function for growth, epithelial integrity, red blood cell production, immunity and reproduction. Essential nutrients cannot be synthesized by the body and therefore must be provided through diet." WHO Global prevalence of vitamin A deficiency in populations at risk 2009, Pg 1.
- "Vitamin A is required for normal functioning of the visual system, maintenance of cell function for growth, epithelial integrity, red blood cell production, immunity, and reproduction (Sommer 1996)." Imdad et al. 2017, Pg 8.
- See Sommer and West 1996 (cited in Imdad et al. 2017 in the bullet point above) chapters 8 and 9 for a detailed description of how vitamin A is understood to function in visual, immune, and other bodily systems.
- 6
"Vitamin A is an essential nutrient needed in small amounts for the normal functioning of the visual system, and maintenance of cell function for growth, epithelial integrity, red blood cell production, immunity and reproduction. Essential nutrients cannot be synthesized by the body and therefore must be provided through diet." WHO Global prevalence of vitamin A deficiency in populations at risk 2009, Pg 1.
- 7
- WHO Global prevalence of vitamin A deficiency in populations at risk 2009:
- "Deficiency of sufficient duration or severity can lead to disorders that are common in vitamin A deficient populations such as xerophthalmia (xeros = dryness; -ophthalmia = pertaining to the eye), the leading cause of preventable childhood blindness, anaemia, and weakened host resistance to infection, which can increase the severity of infectious diseases and risk of death." Pg 1.
- "The term xerophthalmia encompasses the clinical spectrum of ocular manifestations of VAD, from milder stages of night blindness and Bitot’s spots, to potentially blinding stages of corneal xerosis, ulceration and necrosis (keratomalacia). . . . The stages of xerophthalmia are regarded both as disorders and clinical indicators of VAD, and thus can be used to estimate an important aspect of morbidity and blinding disability as well as the prevalence of deficiency. As corneal disease is rare, the most commonly assessed stages are night blindness, obtainable by history, and Bitot’s spots, observable by handlight examination of the conjunctival surface. Standard procedures exist for assessing xerophthalmia. Although night blindness and Bitot’s spots are considered mild stages of eye disease, both represent moderate-to-severe systemic VAD, as evidenced by low serum retinol concentrations, and increased severity of infectious morbidity (i.e. diarrhoea and respiratory infections) and mortality in children and pregnant women." Pgs 2-3.
- "Vitamin A deficiency (VAD) impairs body functions and may cause death. Adverse health consequences may also include xerophthalmia (dry eyes), susceptibility to infection, stunting, and anaemia (Sommer 1996; Rice 2004)." Imdad et al. 2017, Pg 8.
- WHO Global prevalence of vitamin A deficiency in populations at risk 2009:
- 8
WHO Global prevalence of vitamin A deficiency in populations at risk 2009:
- "The main underlying cause of VAD as a public health problem is a diet that is chronically insufficient in vitamin A that can lead to lower body stores and fail to meet physiologic needs (e.g. support tissue growth, normal metabolism, resistance to infection)." Pg 1.
- "Dietary deficiency can begin early in life, with colostrum being discarded or breastfeeding being inadequate, thereby denying infants of their first, critical source of vitamin A. Thereafter, into adulthood, a diet deficient in vitamin A lacks foods containing either preformed vitamin A esters, such as liver, milk, cheese, eggs or food products fortified with vitamin A or lacking its carotenoid precursors (mainly beta-carotene), such as green leaves, carrots, ripe mangos, eggs, and other orange-yellow vegetables and fruits. Where animal source or fortified foods are minimally consumed, dietary adequacy must rely heavily on foods providing beta-carotene. However, while nutritious in many ways, a diet with modest amounts of vegetables and fruits as the sole source of vitamin A may not deliver adequate amounts, based on an intestinal carotenoid-to-retinol conversion ratio of 12:1. This ratio reflects a conversion efficiency that is about half that previously thought, leading to greater appreciation for why VAD may coexist in cultures that heavily depend on vegetables and fruits as their sole or main dietary source of vitamin A.
"Usually, VAD develops in an environment of ecological, social and economical deprivation, in which a chronically deficient dietary intake of vitamin A coexists with severe infections, such as measles, and frequent infections causing diarrhoea and respiratory diseases that can lower intake through depressed appetite and absorption, and deplete body stores of vitamin A through excessive metabolism and excretion. The consequent 'synergism' can result in the body’s liver stores becoming depleted and peripheral tissue and serum retinol concentrations decreasing to deficient levels, raising the risks of xerophthalmia, further infection, other VADD and mortality." Pg 1.
- 9
- "WHO regional estimates indicate that the highest proportion of preschool-age children affected by night blindness, 2.0%, is in Africa, a value that is four times higher than estimated in South-East Asia (0.5%). This also means that Africa has the greatest number of preschool-age children affected with night blindness (2.55 million), and corresponds to almost half of the children affected globally (Table 10). A comparable and high proportion of pregnant women affected by night blindness are in Africa (9.8%) and South-East Asia (9.9%), each of which is estimated to have over 3 million pregnant women affected, or one third of the pregnant women affected globally. The estimates show that the Africa and South-East Asia regions also contain the highest proportions of preschool-age children with biochemical VAD, as indicated by a serum retinol concentration <0.70 µmol/l, with South-East Asia having the greatest number of children and pregnant women affected." WHO Global prevalence of vitamin A deficiency in populations at risk 2009, Pgs 10-11.
- See WHO regional offices for countries included in the Africa and South-East Asia Regions.
- 10
"Low vitamin A intake during nutritionally demanding periods in life, such as infancy, childhood, pregnancy and lactation, greatly raises the risk of health consequences, or vitamin A deficiency disorders (VADD)." WHO Global prevalence of vitamin A deficiency in populations at risk 2009, Pg 1.
- 11
- "Provision of high doses of vitamin A every 6 months until the age of 5 years was based on the principle that a single, large dose of vitamin A is well absorbed and stored in the liver, and then mobilized, as needed, over an extended period of time. A dose of 100 000 International Units (IU) in infants 6–11 months of age and 200 000 IU in children 12–59 months of age is considered to provide adequate protection for 4–6 months, with the exact interval depending on the vitamin A content of the diet and the rate of utilization by the body." WHO Guideline: Vitamin A supplementation in infants and children 6-59 months of age 2011, Pg 3.
- "Vitamin A is a term used for a subclass of retinoic acids, a family of lipid-soluble compounds (Bates 1995). Vitamin A is found in two main forms: provitamin A carotenoids and preformed vitamin A. Provitamin A carotenoids are found in plants; beta-carotene is the only one that is metabolised by mammals into vitamin A. Though fruits and vegetables are nutritious in other ways, normal dietary intake of plants may not deliver adequate amounts of vitamin A because the intestinal carotenoid-to-retinol conversion ratio varies with type of food, ranging from 6:1 to 26:1 (US Institute of Medicine, Food and Nutrition Board; Van Lieshout 2005). Consequently, VAD can exist in places with high vegetable and fruit consumption (West 2002). Preformed vitamin A (retinol, retinal, retinoic acid, and retinyl esters), is the most active form of vitamin A and is found in animal sources. Supplements usually use preformed vitamin A (Shenai 1993; Bates 1995)." Imdad et al. 2017, Pg 8.
- 12
- WHO Guideline: Vitamin A supplementation in infants and children 6-59 months of age 2011:
- "In settings where vitamin A deficiency is a public health problem, vitamin A supplementation is recommended in infants and children 6–59 months of age as a public health intervention to reduce child morbidity and mortality (strong recommendation). The quality of the available evidence for all-cause mortality was high, whereas for all other critical outcomes it was moderate to very low. The quality of the available evidence for outcomes in human immunodeficiency virus (HIV)- positive children was moderate for all-cause mortality." Pg 1.
- One dose of 100,000 IU of vitamin A is recommended for infants aged 6 to 11 months of age, and a 200,000 IU dose of vitamin A is recommended for children 12 to 59 months of age every four to six months. Table 1, Pg 5.
- WHO defines vitamin A deficiency to be of mild public health importance when rates of vitamin A deficiency (defined as a measure of serum or plasma retinol <0.70 µmol/l) among preschool-aged children or pregnant women are between 2% and 10%, moderate public health importance when rates of vitamin A deficiency among preschool-aged children or pregnant women are between 10% and 20%, and severe public health importance when rates of vitamin A deficiency among preschool-aged children or pregnant women are greater than or equal to 20%. WHO Global prevalence of vitamin A deficiency in populations at risk 2009, Pg 8, Table 5.
- WHO Guideline: Vitamin A supplementation in infants and children 6-59 months of age 2011:
- 13
"Mass distribution campaigns are the main delivery mechanism for VAS. These campaigns are organized at least every 6 months...
"Because mass campaigns take place only every 4 to 6 months, children who reach the age of 6 months between two campaigns, may have to wait several months before they get their first dose of Vitamin A despite being the most vulnerable age group.
"To remedy this, HKI is working closely with country-level health sector experts to add a contact point in national immunization calendars – at 6 months, when no other vaccination is scheduled.
"Additionally, HKI supports routine facility-based and outreach delivery of vitamin A for all children under 5 in countries where stronger health systems offer sufficient access to quality services. Few countries are ready for this approach and these still need to develop social mobilization actions to create demand to match the capacity to offer services." HKI VAS overview brochure, Pg 2.
- 14
- GiveWell's notes from a site visit with HKI to Conakry, Guinea, October 9-11, 2017:
- "In polio vaccination campaigns–also known as national immunization days (NIDs)–health workers go door-to-door providing oral polio vaccines. These campaigns generally occur one or more times per year. Because teams are already going door-to-door, it is relatively simple and inexpensive to add an additional person to each distribution team to deliver VAS to children aged 6 to 59 months." Pg 3.
- "Mobile CHDs [Child Health Days] involve health workers going door-to-door to provide communities with vitamin A supplements and other health services. This strategy is operationally very similar to polio NIDs." Pg 3.
- GiveWell's notes from a site visit with HKI to Conakry, Guinea, October 9-11, 2017:
- 15
- "Fixed-site distribution
- In fixed-site CHDs [Child Health Days], caregivers must bring their children to health centers or other fixed distribution sites to receive the package of health services.
- Many CHD programs utilize a 'fixed + outreach' strategy, in which they implement outreach activities to encourage caregivers to bring their children to the fixed site to receive health services."
GiveWell's notes from a site visit with HKI to Conakry, Guinea, October 9-11, 2017, Pg 3.
- "Fixed-site distribution
- 16
- David Doledec, HKI Regional VAS Program Manager, and Rolf Klemm, HKI Vice President of Nutrition, conversation with GiveWell, July 18, 2018
- We have not seen the social mobilization materials Helen Keller is using in Guinea, but Helen Keller has sent us some examples of social mobilization materials it has used in past campaigns:
- 17
- "For distribution sites visited by an independent HKI supervisor, 86% met the criteria for minimum quality threshold for service delivery defined as 1) health worker used scissors to cut the capsule 2) health worker asked the age of the child 3) health worker squeezed the drops into the child’s mouth 4) health worker used the correct dose of VAS and 5) were there no stock-outs of VAC." HKI VAS project year 1 report 2014
- See the guidelines for health workers in HKI VAS supervision checklist: universal and HKI Tanzania social mobilization toolkit: VAS administration guide.
- 18
- HKI Tanzania social mobilization toolkit: VAS administration guide:
- "Ask the age of the child to determine the appropriate dose of vitamin A (6-59 months) and whether the child is old enough for a deworming tablet (12-59 months)."
- "If the distribution point runs out of red (200,000 IU) capsules, two blue (100,000 IU) capsules can be given in place of one red capsule. If the distribution points runs out of blue capsules squeeze half the number of drops from a red capsule into the mouth of a child aged 6-11 months."
- See additional guidelines for dosage selection in HKI VAS supervision checklist: universal.
- HKI Tanzania social mobilization toolkit: VAS administration guide:
- 19
- "To date, HKI’s VAS project has undertaken three main types of activities, which can roughly be categorized as disbursing sub-grants to the government, providing technical assistance, and engaging in advocacy efforts." HKI External Evaluation and HKI Response - Canada DFATD VAS Project 2015, Pg 35.
- "HKI provides a package of interventions and services that include training, policy development, advocacy, monitoring & evaluation, service delivery, behavior change communication, social mobilization and supervision in all 13 countries where HKI assists host-country governments to implement universal preschool vitamin A supplementation programs." HKI country-level technical support related to vitamin A supplementation, Pg 1.
- "In concrete terms, HKI, in consultation with national government counterparts, directs its support to low performing areas to help local program managers identify and solve VAS coverage barriers. This involves organizing workshops with state and district health authorities to analyze what worked and what did not. HKI teams then spend time with health managers to help them identify feasible and cost-effective solutions to improve performance of the targeted services and accompany them through the whole programming cycle (i.e. planning, budgeting, implementation, real time supervision and monitoring, and finally evaluation of the progress made). One cycle sometimes proves insufficient so the HKI teams continue working with each targeted health district until minimum thresholds of performance are met. Funds are used to support deployment of HKI teams in remote areas, to support financing workshops and joint field supervisions, to provide training for field actors, or to organize coverage surveys and review meetings at the end of the exercise. In some cases, HKI provides funds directly to the local authorities to fill financial gaps they may experience ensuring rigorous financial accountability. When conditions for a change of approach are met, HKI provides technical assistance to local authorities to design, implement and monitor with them innovative approaches such as the 6-month contact point or SMS messaging." HKI VAS documents guide for GiveWell 2017, Pg 4.
- 20
- Coverage surveys:
- Helen Keller assists governments with implementing surveys to assess coverage (i.e., the percentage of targeted children who actually received vitamin A supplements) following VAS mass distribution campaigns:
- "Since 2010, HKI has developed a methodology to assess the true coverage of vitamin A supplementation and identify barriers and determinants of high coverage. Based on a cross sectional survey methodology, the Post-Event Coverage Surveys (PECS) are conducted by health system personnel using mobile phones and allow multiple indicators to be collected. More than 50 surveys have been conducted in 15 countries and provide data to improve performance of VAS programs and ensure that all children have equitable access to essential child survival services." HKI VAS overview brochure, Pg 2.
- See this spreadsheet for a summary of the results and methodology of Helen Keller's recent coverage surveys.
- Helen Keller assists governments with implementing surveys to assess coverage (i.e., the percentage of targeted children who actually received vitamin A supplements) following VAS mass distribution campaigns:
- Administrative data:
- "HKI helps to track national VAS coverage through the governments tally-sheet system (also referred to as 'Administrative Data')." HKI VAS documents guide for GiveWell 2017, Pg 6.
- We have not yet seen specific descriptions of how HKI assists governments with tracking administrative data.
- Process monitoring:
- Helen Keller recruits and organizes "independent" (not affiliated with countries' ministries of health) monitoring teams to conduct process monitoring during VAS campaigns. Process monitoring involves assessments (using checklists) of randomly-selected VAS distribution sites. Process monitors report their findings daily to Helen Keller using mobile phones. David Doledec, HKI Regional VAS Program Manager, and Rolf Klemm, HKI Vice President of Nutrition, conversation with GiveWell, July 18, 2018
- We have seen examples of checklists used by independent process monitors, but we have not yet seen documents reporting on data collected by process monitors:
- Helen Keller told us that it also provides technical support for process monitoring conducted by ministries of health. Like independent process monitoring, process monitoring conducted by ministries of health also involves visits to randomly selected VAS distribution sites, but checklists and formal reporting are not often required. David Doledec, HKI Regional VAS Program Manager, and Rolf Klemm, HKI Vice President of Nutrition, conversation with GiveWell, July 18, 2018
- Coverage surveys:
- 21
- Developing training materials:
- "In all countries, HKI developed comprehensive training packages to allow governments conduct training and organized training of trainers." HKI country-level technical support related to vitamin A supplementation, Pgs 1-2.
- "All of HKI’s work in VAS/CHDs programs focuses on alignment with and use of existing national systems. This requires significant engagement of human resources at national and decentralized levels and a sound understanding of national systems, and how they can be leveraged to achieve program scale. Critical entry points for HKI engagement include supporting development of national policy, catalyzing national and district level planning, training front-line delivery agents and program managers, supporting formative supervision and strengthening monitoring systems and encouraging use of data for program quality improvement and management for results." HKI VAS project year 3 report 2016, Pg 2.
- Specific examples we have seen of this type of activity:
- Direct training of health workers:
- "Facilitate refresher training of 62786 Community workers and health worker (24747 in 1st Round and 38039 in second Round)" HKI VAS project year 1 report 2014, Pg 42 (in list of HKI's activities in Democratic Republic of the Congo during the year).
- Developing training materials:
- 22
- Helen Keller assists governments with designing "6-month contact point" policies:
- "Because mass campaigns take place only every 4 to 6 months, children who reach the age of 6 months between two campaigns, may have to wait several months before they get their first dose of Vitamin A despite being the most vulnerable age group.
"To remedy this, HKI is working closely with country-level health sector experts to add a contact point in national immunization calendars – at 6 months, when no other vaccination is scheduled." HKI VAS overview brochure, Pg 2.
- See HKI 6-month contact point standard methodology for a detailed description of the policy.
- "Because mass campaigns take place only every 4 to 6 months, children who reach the age of 6 months between two campaigns, may have to wait several months before they get their first dose of Vitamin A despite being the most vulnerable age group.
- Helen Keller assists governments with designing "6-month contact point" policies:
- 23
- "In concrete terms, HKI, in consultation with national government counterparts, directs its support to low performing areas to help local program managers identify and solve VAS coverage barriers. This involves organizing workshops with state and district health authorities to analyze what worked and what did not. HKI teams then spend time with health managers to help them identify feasible and cost-effective solutions to improve performance of the targeted services and accompany them through the whole programming cycle (i.e. planning, budgeting, implementation, real time supervision and monitoring, and finally evaluation of the progress made). One cycle sometimes proves insufficient so the HKI teams continue working with each targeted health district until minimum thresholds of performance are met. Funds are used to support deployment of HKI teams in remote areas, to support financing workshops and joint field supervisions, to provide training for field actors, or to organize coverage surveys and review meetings at the end of the exercise. In some cases, HKI provides funds directly to the local authorities to fill financial gaps they may experience ensuring rigorous financial accountability. When conditions for a change of approach are met, HKI provides technical assistance to local authorities to design, implement and monitor with them innovative approaches such as the 6-month contact point or SMS messaging." HKI VAS documents guide for GiveWell 2017, Pg 4.
- Specific example of this type of work:
- "Meeting with State Director of Public Health to initiate the VAS workplan development in 8 States" and "Obtain annual costed workplan from HKI-supported states" are listed as activities completed by HKI in 2013 in Nigeria. HKI VAS project year 1 report 2014, Pg 96, Table 72.
- 24
- "Creating demand by promoting healthy behaviors:
"HKI promotes social mobilization campaigns that inform caregivers of children aged 6 to 59 months of the importance of VAS and that a supplementation campaign is taking place in their neighborhood. Some of HKI’s achievements include:- Using of SMS reminders sent to every caregiver;
- Cooperating with religious and traditional leaders;
- Involving community health workers and volunteers to organize regular population census that ensure that each child is reached at home;
- Developing with health authorities and rolling-out comprehensive social mobilization toolkits that include multi-media communication and sensitization tools and messages; and
- Associating social mobilization with comprehensive social & behavior change strategies."
HKI VAS overview brochure, Pg 3.
- Examples of social mobilization and marketing materials:
- Helen Keller told us that it uses more time and funding on social mobilization in countries where caregivers bring children to receive vitamin A supplements at fixed sites than in countries using door-to-door distributions. Among countries where Helen Keller is currently supporting VAS mass distribution campaigns, Guinea uses fixed-site distributions and Mali and Burkina Faso use door-to-door distribution. David Doledec, HKI Regional VAS Program Manager, and Rolf Klemm, HKI Vice President of Nutrition, conversation with GiveWell, July 18, 2018.
- "Creating demand by promoting healthy behaviors:
- 25
- "HKI teams work closely with national governments to support the policy, strategy and tool development mentioned above, but HKI’s major added value is its capacity to rapidly deploy technical support to the sub national level to assist local health authorities with implementing national VAS strategies. HKI focus its efforts sub-nationally because local level (at state and/or district level) health system performance is key to ensuring high VAS coverage. It also allows HKI to support other health system functions that also improve the delivery of other maternal and child health services.
"In concrete terms, HKI, in consultation with national government counterparts, directs its support to low performing areas to help local program managers identify and solve VAS coverage barriers. This involves organizing workshops with state and district health authorities to analyze what worked and what did not. HKI teams then spend time with health managers to help them identify feasible and cost-effective solutions to improve performance of the targeted services and accompany them through the whole programming cycle (i.e. planning, budgeting, implementation, real time supervision and monitoring, and finally evaluation of the progress made). One cycle sometimes proves insufficient so the HKI teams continue working with each targeted health district until minimum thresholds of performance are met. Funds are used to support deployment of HKI teams in remote areas, to support financing workshops and joint field supervisions, to provide training for field actors, or to organize coverage surveys and review meetings at the end of the exercise. In some cases, HKI provides funds directly to the local authorities to fill financial gaps they may experience ensuring rigorous financial accountability. When conditions for a change of approach are met, HKI provides technical assistance to local authorities to design, implement and monitor with them innovative approaches such as the 6-month contact point or SMS messaging." HKI VAS documents guide for GiveWell 2017, Pgs 3-4.
- See this spreadsheet, "HKI population targets" sheet, for a list of the regions Helen Keller is supporting in current programs supported by GiveWell-directed funds in Guinea, Mali, and Burkina Faso.
- Helen Keller told us that it selected regions in Guinea, Mali, and Burkina Faso that it judged would be most in need of technical support. UNICEF is providing technical support to the remainder of the regions in each country. David Doledec, HKI Regional VAS Program Manager, and Rolf Klemm, HKI Vice President of Nutrition, conversation with GiveWell, July 18, 2018.
- "HKI teams work closely with national governments to support the policy, strategy and tool development mentioned above, but HKI’s major added value is its capacity to rapidly deploy technical support to the sub national level to assist local health authorities with implementing national VAS strategies. HKI focus its efforts sub-nationally because local level (at state and/or district level) health system performance is key to ensuring high VAS coverage. It also allows HKI to support other health system functions that also improve the delivery of other maternal and child health services.
- 26
"In most countries, HKI teams spent around 10% of their time working with the national government to advocate for VAS. HKI advocated for domestic budgets to take a greater proportion of the costs of VAS, to integrate VAS in national health and nutrition policy documents and in pluriannual strategies or action plans, supporting coordination between actors and sectors and promoting monitoring of VAS at national level to provide the government with a comprehensive vision of the services for the whole country." HKI country-level technical support related to vitamin A supplementation, Pg 1.
- 27
"Because mass campaigns take place only every 4 to 6 months, children who reach the age of 6 months between two campaigns, may have to wait several months before they get their first dose of Vitamin A despite being the most vulnerable age group.
"To remedy this, HKI is working closely with country-level health sector experts to add a contact point in national immunization calendars – at 6 months, when no other vaccination is scheduled." HKI VAS overview brochure, Pg 2.
- 28
- "In concrete terms, HKI, in consultation with national government counterparts, directs its support to low performing areas to help local program managers identify and solve VAS coverage barriers. This involves organizing workshops with state and district health authorities to analyze what worked and what did not. HKI teams then spend time with health managers to help them identify feasible and cost-effective solutions to improve performance of the targeted services and accompany them through the whole programming cycle (i.e. planning, budgeting, implementation, real time supervision and monitoring, and finally evaluation of the progress made). One cycle sometimes proves insufficient so the HKI teams continue working with each targeted health district until minimum thresholds of performance are met. Funds are used to support deployment of HKI teams in remote areas, to support financing workshops and joint field supervisions, to provide training for field actors, or to organize coverage surveys and review meetings at the end of the exercise. In some cases, HKI provides funds directly to the local authorities to fill financial gaps they may experience ensuring rigorous financial accountability." HKI VAS documents guide for GiveWell 2017
- "To date, HKI’s VAS project has undertaken three main types of activities, which can roughly be categorized as disbursing sub-grants to the government, providing technical assistance, and engaging in advocacy efforts." HKI External Evaluation and HKI Response - Canada DFATD VAS Project 2015, Pg 35.
- For VAS programs Helen Keller supported between 2013 and 2016, spending categorized as "Service Delivery" is funding Helen Keller has granted to governments for program implementation. See this spreadsheet, "By category" sheet, for details.
- Helen Keller's budgets for VAS programs between 2018 and 2020 are in this spreadsheet, "HKI three-year budget" sheet. Budgets for "sub-agreements" are funds that Helen Keller plans to grant to governments for program implementation.
- 29
- "Micronutrient Initiative (MI) (the name of the organization changed ~1 month ago to Nutrition International or NI) is only active in 4 of the 13 countries were HKI is operational, however MI provides the needed number of vitamin A capsules to all countries where HKI works. MI’s role essentially takes place at the national level, providing technical and policy guidance to governments. In most cases, MI delivers the vitamin A capsules to UNICEF, who organizes their management with the national government and ensures that they reach the field. UNICEF’s role is mainly at national level to support all aspects of maternal and child health. This large portfolio gives them the capacity to weigh strongly on decisions at national level but also prevents them from providing specific technical assistance, especially at the sub-national and district levels, where needed. HKI, being more flexible and specialized, takes on this technical support role, and builds evidence, and adjusts its activities to the evolving needs of the program." HKI country-level technical support related to vitamin A supplementation, Pg 2.
- For example, see details of UNICEF's support to Helen Keller-supported countries in 2020 in Helen Keller, GiveWell Narrative Report, April 2021, pg. 15, table 10.
- 30
GiveWell-directed funding, including donations from Open Philanthropy and other funders, supported at least 81% of Helen Keller's VAS campaign work in 2018, at least 78% in 2019, and at least 95% in 2020. See this spreadsheet, sheet "Source: VAS 2018 Expense Summary," cell C43; sheet "Source: VAS 2019 Annual Report," cells B45:D45; and sheet "Source: GiveWell Financial Report_April 2021," cell I68.
- 31
In November 2019, GiveWell recommended that Open Philanthropy grant funding to support Helen Keller's expansion to DRC; this expansion was delayed in 2020 by the Covid-19 pandemic:
- "COVID-19 related travel restrictions also delayed a scoping visit to DRC postponing Helen Keller support to VAS in DRC until the first semester of 2021." Helen Keller, GiveWell Narrative Report, April 2021, pg. 3.
- "In DRC, the travel ban associated with COVID-19 prevented Helen Keller from opening an office in March 2020, as originally planned. However, a scoping visit was conducted in September 2020, and preparations are underway to establish an office, hire staff and provide support to the VAS program in the first semester of 2021 in three high-need provinces--Kongo Central, Kasai Oriental and Kinshasa. " Helen Keller, GiveWell Narrative Report, April 2021, pg. 13.
- 32
In some locations, Helen Keller provides funding for VAS campaigns through sub-agreements with regional or district-level governments. Rolf Klemm, HKI Vice President of Nutrition, and David Doledec, HKI Regional VAS Program Manager, conversation with GiveWell, March 30, 2020.
- 33
See this spreadsheet, sheet "Summary [2020]," section "Actual spending by category, 2020" for a detailed breakdown of spending between different activities.
- 34
"In 2020 the COVID-19 pandemic caused major disruptions to Helen Keller VAS programs in all countries. The only country that maintained its first semester VAS campaign was Mali (March 2021) which was implemented just days prior to a partial lockdown. VAS campaigns in all other countries were delayed by 1 to 5 months due to the rapid increase of COVID-19 cases and measures taken by governments to mitigate vital spread. Countries resumed VAS campaigns after precautionary measures were implemented…
The delay in first semester campaigns created difficulties in scheduling second semester campaigns. In Niger, for example, the first semester campaign was delayed until September, hence no second round was implemented for the remainder of 2020, although a campaign is planned for March 2021. Similarly, Nigeria implemented only one VAS campaign round in 2020. Cote d’Ivoire, Burkina Faso, and Guinea implemented their distribution second rounds in January 2021. COVID-19 related travel restrictions also delayed a scoping visit to DRC postponing Helen Keller support to VAS in DRC until the first semester of 2021.
Because of the postponed VAS campaigns, Helen Keller’s spending levels in 2020 were ~$1 m lower ($8.4 m budgeted vs $7.6 m spent) compared with expected levels as reflected in budgets shared with GiveWell in April 2020. However, because some second semester VAS campaigns were implemented in January 2021, expenditures planned for calendar year 2020 were spent in calendar year 2021. While the annual spending levels were lower, the cost of the VAS campaigns implemented in 2020 were about 15% more costly funds due to the procurement of masks and hand sanitizers, the need to organize a greater number of training sessions of smaller groups instead of large group training sessions." Helen Keller, GiveWell Narrative Report, April 2021, pgs. 2-3.
- 35
- See this spreadsheet, sheet "Source: GiveWell Financial Report_April 2021," table 4.
- "These donations were used to conduct operations research focusing on maintaining high VAS coverage without campaigns. In Senegal, the project provides training and support to facility personnel to plan and monitor routine VAS delivery. In Sierra Leone, the study measures the impact of adding food demonstrations to VAS distribution. In Cameroon, the study uses Community Volunteers to conduct a community census of children and provide 6-monthly reminders to caregivers about the next VAS eligibility date." Helen Keller, GiveWell Narrative Report, April 2021, pgs. 6-7.
- 36
- “Vitamin A was associated with a 24% reduction in all-cause mortality (RR = 0.76 (95% CI 0.69 to 0.83)), though there was moderate heterogeneity.” Imdad et al. 2010, Pg 18.
- "One [additional randomized trial] reported no events [i.e. deaths] (Lin 2008)” and therefore had zero weight in the analysis. Pg 18.
- "Post hoc, we included two studies in which participants were assigned using a quasi-random method (Herrera 1992; Stansfield 1993)." Pg 10.
- Only one of these, Herrera et al. 1992, was included in the analysis of all-cause mortality. Pg 18.
- The quasi-randomized trial included in the all-cause mortality meta-analysis, Herrera et al. 1992, "reported no effect (RR = 1.06 (95% CI 0.92 to 1.37)), indicating that these trials were not likely to influence [Cochrane’s] results in a positive direction." Pg 19.
- 37
- Awasthi et al. 2013:
- “Deaths per child-care centre at ages 1.0–6.0 years during the 5-year study (the primary trial endpoint) were 3.01 retinol versus 3.15 control (absolute reduction 0.14 [SE 0.11], mortality rate ratio [RR] 0.96, 95% CI 0.89–1.03, p=0.22), suggesting absolute risks of death between ages 1.0 and 6.0 years of approximately 2.5% retinol versus 2.6% control. Although this finding suggests that overall child mortality was 4% lower in vitamin A than in control blocks, this 4% reduction includes the possibility of no benefit and the possibility of appreciable benefit (95% confidence limit for reduction 11%).” Pg 1473.
- "In these 72 blocks, 8338 child-care centres were followed up, with total population at ages 1·0–6·0 years 1 million and 5 million child-years at risk in the 5 years between May, 1999, and April, 2004." Pg 1470.
- "DEVTA trial 2013...
Eligibility: children aged 1-6 years were eligible for inclusion in the review
Sample: total clusters were 72, of which 36 clusters received vitamin A supplementation while 36 acted as control. Authors claimed to include 1 million children in the trial." Imdad et al. 2017, Pg 55.
- Awasthi et al. 2013:
- 38
Imdad et al. 2017, Pg 18, Figure 3.
- 39
- "At longest follow-up, there was a 12% observed reduction in the risk of all-cause mortality for vitamin A compared with control using a fixed-effect model (risk ratio (RR) 0.88, 95% confidence interval (CI) 0.83 to 0.93; high-quality evidence)." Pg 2.
- "A sensitivity analysis using a random-effects model found a 24% reduction in mortality, essentially the same as our original estimate (RR 0.76, 95% CI 0.69 to 0.83), published previously (Imdad 2010a)." Pg 25.
- 40
Cochrane Handbook section 9.5.4: Incorporating heterogeneity into random-effects models:
- "A fixed-effect meta-analysis provides a result that may be viewed as a ‘typical intervention effect’ from the studies included in the analysis. In order to calculate a confidence interval for a fixed-effect meta-analysis the assumption is made that the true effect of intervention (in both magnitude and direction) is the same value in every study (that is, fixed across studies). This assumption implies that the observed differences among study results are due solely to the play of chance, i.e. that there is no statistical heterogeneity."
- "When there is heterogeneity that cannot readily be explained, one analytical approach is to incorporate it into a random-effects model. A random-effects meta-analysis model involves an assumption that the effects being estimated in the different studies are not identical, but follow some distribution. The model represents our lack of knowledge about why real, or apparent, intervention effects differ by considering the differences as if they were random. The centre of this distribution describes the average of the effects, while its width describes the degree of heterogeneity. The conventional choice of distribution is a normal distribution. It is difficult to establish the validity of any distributional assumption, and this is a common criticism of random-effects meta-analyses. The importance of the particular assumed shape for this distribution is not known."
- "If variation in effects (statistical heterogeneity) is believed to be due to clinical diversity, the random-effects pooled estimate should be interpreted differently from the fixed-effect estimate since it relates to a different question. The random-effects estimate and its confidence interval address the question ‘what is the average intervention effect?’ while the fixed-effect estimate and its confidence interval addresses the question ‘what is the best estimate of the intervention effect?’ The answers to these questions coincide either when no heterogeneity is present, or when the distribution of the intervention effects is roughly symmetrical. When the answers do not coincide, the random-effects estimate may not reflect the actual effect in any particular population being studied."
- 41
The DEVTA researchers conducted a meta-analysis of DEVTA and eight previous large trials where pre-school children were provided with multiple doses of VAS per year. They found “heterogeneity between DEVTA and subtotal of eight previous trials p = 0.0010.” Awasthi et al. 2013, Pg 1475.
- 42
See our vitamin A intervention report for sources and details.
- 43
- “The biggest specific cause of death that VAS reduces is diarrhea. Deaths from diarrhea are falling but still a leading cause of childhood mortality globally.” GiveWell's non-verbatim summary of a conversation with Evan Mayo-Wilson, June 10, 2013, Pg 2.
- “In a reanalysis of one of the original eight trials, the beneficial effect was limited to unvaccinated children and there were strong sex-differential effects of vitamin A supplementation in vaccinated children. Hence, the roll-out of the vaccination programme might be one environmental factor that has modified the effect of vitamin A.” Benn, Fisker, and Aaby 2013, Pg 593.
- 44
- Beaton et al. 1993:
- "The second consideration might be overall mortality rates. Figure 5.3 portrays the relative effectiveness of vitamin A supplementation in relation to control group mortality rates (a poor proxy for baseline mortality rate). No particular relationship is apparent and none could be detected in statistical analyses involving a variety of models in which individual projects were weighted (see Technical Annex)." Pg 67.
- See Figure 5.3, Pg 68.
- Beaton et al. 1993's analysis includes eight VAS trials. We have not completed an up-to-date analysis of this type for all the VAS trials that measured all-cause mortality included in Imdad et al. 2017.
- Beaton et al. 1993:
- 45
- "Coverage was ascertained from logbooks of overworked government community workers (anganwadi workers), and verified by a small number of supervisors who periodically visited randomly selected anganwadi workers to question and examine children who these workers gathered for them. Both anganwadi worker self-reports, and the validation procedures, are fraught with potential bias that would inflate the actual coverage . . . Although 76% of children aged 0–71 months in 2005–06 lived in areas covered by an anganwadi worker, only 22% of children received any service from the anganwadi worker. Thus, it is hard to understand how DEVTA ramped up coverage to extremely high levels (and if it did, why so little of this effort was sustained). DEVTA provided the anganwadi workers with less than half a day’s training and minimal if any incentive." Sommer, West, and Martorell 2013, Pg 591.
- 46
- In our vitamin A supplementation intervention report, we note that DEVTA did not target children in remote areas, who may have been more likely than other children to suffer from VAD (see here and here). We also note that some control group members may have received some doses of vitamin A (see here).
- Additionally, Helen Keller told us the following:
- "DEVTA represented an earnest attempt to evaluate the impact of Anganwadi delivery of vitamin A capsules on preschool child mortality and vitamin A deficiency. The DEVTA trial included about a million children and found a small mortality benefit (~4%) for vitamin A supplementation, although not statistically significant. The DEVTA findings generated controversy because many experts believe that the methods for the delivery of the intervention and the assessment of the primary outcome (i.e. all-cause mortality) were not rigorous (Habicht 2013; Mannar 2013; Mayo-Wilson 2013; Sloan 2013; Sommer 2013). For example, investigators did not count children at baseline or obtain informed consent, and methods of follow up and data collection were not [r]igorous (Mannar 2013; Sommer 2013). In this cluster-randomized trial, vitamin A capsules were distributed by Anganwadi workers who had contact with only 26% of the children living in the study area (Sommer 2013). In reply to [t]his extensive criticism, authors of DEVTA emphasized that results of this trial need to be interpreted alongside previously published studies (Peto 2013)." HKI responses to GiveWell's questions May 2017, Pg 6.
- We have not yet vetted the sources cited in the bullet point above.
- 47
- See our vitamin A supplementation intervention report for details about rates of VAD among DEVTA participants.
- "There is likely a threshold of VAD prevalence below which VAS is unlikely to have much impact on mortality. If there is high-quality data showing low VAD in a region, HKI thinks it is reasonable not to expect VAS to have a mortality impact there.
"Organizations in the Global Alliance for Vitamin A (GAVA) currently use 10% VAD as the threshold at or above which VAS programs ought to be maintained in a region. The World Health Organization (WHO) classifies VAD rates of 20% or greater among preschool-aged children as a serious public health problem. VAD rates of less than 5% are accepted as not much of a concern." GiveWell's non-verbatim summary of a conversation with Helen Keller International, June 1, 2017, Pg 2.
- WHO only recommends VAS programs in areas where VAD is a public health concern. WHO Guideline: Vitamin A supplementation in infants and children 6-59 months of age 2011:
- "In settings where vitamin A deficiency is a public health problem, vitamin A supplementation is recommended in infants and children 6–59 months of age as a public health intervention to reduce child morbidity and mortality (strong recommendation). The quality of the available evidence for all-cause mortality was high, whereas for all other critical outcomes it was moderate to very low. The quality of the available evidence for outcomes in human immunodeficiency virus (HIV)- positive children was moderate for all-cause mortality." Pg 1.
- One dose of 100,000 IU of vitamin A is recommended for infants 6 to 11 months of age, and a 200,000 IU dose of vitamin A is recommended for children 12 to 59 months of age every four to six months. Table 1, Pg 5.
- WHO defines vitamin A deficiency to be of mild public health importance when rates of vitamin A deficiency (defined as a measure of serum or plasma retinol <0.70 µmol/l) among preschool-aged children or pregnant women are between 2% and 10%, moderate public health importance when rates of vitamin A deficiency among preschool-aged children or pregnant women are between 10% and 20%, and severe public health importance when rates of vitamin A deficiency among preschool-aged children or pregnant women are greater than or equal to 20%. WHO Global prevalence of vitamin A deficiency in populations at risk 2009, Pg 8, Table 5.
- 48
- "A threshold like this might not be observed if vitamin A had a pharmacological effect (i.e., if a large dose of vitamin A directly primed the immune system in some way, regardless of deficiency). However, Dr. Klemm thinks there is not any clear evidence to substantiate this hypothesis." GiveWell's non-verbatim summary of a conversation with Helen Keller International, June 1, 2017, Pg 2.
- "Studies from the 1980s and early 1990s showed that vitamin A deficiency (VAD) was associated with increased overall child mortality and high-dose vitamin A supplementation (VAS) reduced overall mortality. This has led to the long-lived and strong assumption that VAS works by preventing VAD. Though intuitive, this assumption is contradicted by several facts.
"First, high-dose VAS has no sustained effect on VAD, as measured by serum retinol or other biochemical markers. Frequent intakes of vitamin A in physiological doses—e.g., through food-based approaches, including fortification, and through regular low-dose supplementation—are highly effective in increasing serum retinol and reducing VAD. However, when the dose of vitamin A is as high as 200,000 IU (about 100 times the daily allowance), the liver may not be able to store it, and the excess is broken up and excreted. Thus, the rise in serum retinol resulting from 6-monthly VAS is small, transient, and lasts only for 1–3 months.
"Second, if VAS worked by preventing VAD, then one would expect a clear linear association between the degree of underlying VAD and the effect of VAS: the higher the prevalence of VAD in a community, the larger the effect of VAS. However, this is not the case. Already, the first meta-analysis of the initial eight studies of the mortality effect of VAS noted that there was no association between the effect of VAS on mortality and the degree of underlying VAD at the population level. As presented in a recent review, this conclusion is substantiated when more recent studies are included." Benn 2017, Pg 1.
- 49
- "The main objective of assessing vitamin A status is to determine the magnitude, severity and distribution of VAD in a population. Most surveys assess its prevalence in young children and, with increasing frequency, in pregnant or lactating women, as reported here. Although VAD is likely to be widespread following the preschool years, few data exist to reveal the extent of VAD in school-age and young adolescent children (16). Estimating the national prevalence is to be encouraged as such data aids in targeting regions for interventions, and provides baseline values for monitoring population trends and intervention programme impact over time.
"Two sets of indicators of VAD are commonly used for population surveys: clinically assessed eye signs and bio-chemically determined concentrations of retinol in plasma or serum. The term xerophthalmia encompasses the clinical spectrum of ocular manifestations of VAD, from milder stages of night blindness and Bitot’s spots, to potentially blinding stages of corneal xerosis, ulceration and necrosis (keratomalacia) (17), as listed in Table 1. The stages of xerophthalmia are regarded both as disorders and clinical indicators of VAD, and thus can be used to estimate an important aspect of morbidity and blinding disability as well as the prevalence of deficiency. As corneal disease is rare, the most commonly assessed stages are night blindness, obtainable by history, and Bitot’s spots, observable by handlight examination of the conjunctival surface. Standard procedures exist for assessing xerophthalmia (17). Although night blindness and Bitot’s spots are considered mild stages of eye disease, both represent moderate-to-severe systemic VAD, as evidenced by low serum retinol concentrations (19), and increased severity of infectious morbidity (i.e. diarrhoea and respiratory infections) and mortality in children (5) and pregnant women (6, 20).
"Measuring serum retinol concentrations in a population constitutes the second major approach to assessing vitamin A status in a population, with values below a cut-off of 0.70 μmol/l representing VAD (21), and below 0.35 μmol/l representing severe VAD. Although there is not yet international consensus, a serum retinol concentration below a cut-off of 1.05 μmol/l has been proposed to reflect low vitamin A status among pregnant and lactating women (22). While the distribution of serum retinol concentrations below appropriate cut-offs are considered to reflect inadequate states of vitamin A nutriture, a low biochemical concentration of retinol in circulation is not considered a VADD. Also, while an inadequate dietary intake of vitamin A or beta-carotene likely reveals an important and preventable cause of VAD in a population, it is not an indicator of vitamin A status." WHO Global prevalence of vitamin A deficiency in populations at risk 2009, Pg 2.
- Measures of the concentration of serum retinol-binding protein (RBP) are used as a "proxy" for concentrations of serum retinol. Complications of using RBP as a proxy for serum retinol are described in Tanumihardjo et al. 2016:
- "Serum RBP is used as a proxy for serum retinol concentrations in the identification of vitamin A deficiency. As discussed above, serum retinol correlates with liver vitamin A stores only when liver stores are very low. When stores are replete, serum retinol concentrations are homeostatically regulated and do not correlate with liver stores. Because the RBP-retinol complex is released by the liver as part of this homeostatic process, serum RBP correlates closely with serum retinol concentrations, at least in subjects with normal kidney function who are not obese." Pg 19S.
- "RBP is not always 100% saturated with retinol; therefore, a 1:1 molecular equivalence between retinol and RBP in the blood does not usually occur. Thus, one cannot generally use the retinol cutoffs for RBP unless liver stores are hypervitaminotic, as discovered in Zambian preschool children (85) in whom the ratio was 1.0 (144). In addition, the added variability in differences in kidney function (e.g., low glomerular filtration rate can cause an increase in RBP but not retinol) among subjects as well as the apparent contribution of adipose tissue to serum RBP (which may not reflect tissue stores in the same way as liver-derived RBP) make it unlikely that the same retinol-RBP correlation that might be observed in 1 population would be appropriate for another. It is possible that certain populations, such as young children not at risk of obesity and with normal kidney function, may be relatively homogeneous with regard to this association, but such associations have not been systematically examined." Pg 19S.
- See Table 6, Pg 15S, for a list of all vitamin A biomarkers.
- "The main objective of assessing vitamin A status is to determine the magnitude, severity and distribution of VAD in a population. Most surveys assess its prevalence in young children and, with increasing frequency, in pregnant or lactating women, as reported here. Although VAD is likely to be widespread following the preschool years, few data exist to reveal the extent of VAD in school-age and young adolescent children (16). Estimating the national prevalence is to be encouraged as such data aids in targeting regions for interventions, and provides baseline values for monitoring population trends and intervention programme impact over time.
- 50
"Measuring serum retinol concentrations in a population constitutes the second major approach to assessing vitamin A status in a population, with values below a cut-off of 0.70 µmol/l representing VAD (21), and below 0.35 µmol/l representing severe VAD." WHO Global prevalence of vitamin A deficiency in populations at risk 2009, Pg 2.
- 51
Our process for creating our weighted average estimate of VAD prevalence in populations studied in VAS trials is as follows:
- We downloaded Imdad et al. 2017 RevMan data to find the weight of each study included in Analysis 1.1. Comparison 1 Vitamin A versus Control, Outcome 1 All-cause mortality at longest follow-up when analyzed as a random-effects model.
- "A meta-analysis for all-cause mortality included 19 trials (1,202,382 children). At longest follow-up, there was a 12% observed reduction in the risk of all-cause mortality for vitamin A compared with control using a fixed-effect model (risk ratio (RR) 0.88, 95% confidence interval (CI) 0.83 to 0.93; high-quality evidence). This result was sensitive to choice of model, and a random-effects meta-analysis showed a different summary estimate (24% reduction: RR 0.76, 95% CI 0.66 to 0.88); however, the confidence intervals overlapped with that of the fixed-effect model." Imdad et al. 2017, Pg 2.
- Imdad et al. 2017 completed a random-effects meta-analysis on all-cause mortality (see bullet point above, but did not report on the weights of each individual study in the meta-analysis.
- See our most recent cost-effectiveness analysis of Helen Keller for a description of why we prefer the random-effects estimate of the mortality effect of VAS.
- We then reviewed the original papers for the trials included in Imdad et al. 2017 to see whether the researchers had taken any measurements of serum retinol levels among trial participants at baseline, or in the control group at baseline or during the course of the study. We also noted if measures of the prevalence of xerophthalmia among trial participants had been recorded.
- For trials for which serum retinol concentrations among trial participants had not been measured, we used a combination of the following sources to create a best-guess estimate of the prevalence of VAD:
- Rates of xerophthalmia, if measured in the trial.
- Data on the most recent (as of 1995, close to the time of many of the trials) national-level surveys on serum retinol levels recorded in WHO Global Prevalence of Vitamin A Deficiency 1995.
- Regional-level (e.g., sub-Saharan Africa) estimates of the prevalence of VAD in 1991 (close to the time of many of the trials) in Stevens et al. 2015.
- We then created a weighted average of the VAD prevalence estimates, weighting each estimate by its weight in the overall estimate of the effect of VAS on mortality in the random-effects meta-analysis.
- We downloaded Imdad et al. 2017 RevMan data to find the weight of each study included in Analysis 1.1. Comparison 1 Vitamin A versus Control, Outcome 1 All-cause mortality at longest follow-up when analyzed as a random-effects model.
- 52
See this spreadsheet, "VAD where HKI works (or plans to work)" sheet.
- 53
- See this spreadsheet, "VAD where HKI works (or plans to work)" sheet.
- "For countries reporting VAD prevalence, we used the WHO guidelines [33] to classify the severity of the public health problem in children 6–59 months, which considers a VA prevalence of 2%–9% a mild public health problem, 10%–19% a moderate public health problem, and ≥20% a severe public health problem." Wirth et al. 2017, Pg 4.
- See WHO Global prevalence of vitamin A deficiency in populations at risk 2009, Pg 8, Table 5 for "Prevalence cut-offs to define vitamin A deficiency in a population and its level of public health significance."
- 54
See this spreadsheet, Sheet "VAD where HKI works (or plans to work)."
- 55
See this spreadsheet, Sheet "VAD in other countries in sub-Saharan Africa."
- 56
- "Repeated measures of a population’s SROL distribution provide an effective tool for tracking the adequacy of dietary VA intakes over time. High-potency VA supplementation is intended to boost liver stores, enabling the gradual release and delivery of VA to tissues in children with dietary VA deficits. However, semi-annual supplementation does not resolve underlying dietary inadequacies. Thus we see only a transient shift in the SROL distribution. Overall, experimental data suggest that high-potency VA supplements protect children aged 6–59 months from hyporetinolaemia for approximately 8 to 10 weeks(19–23)." Palmer et al. 2012, Pg 1207.
- See Palmer et al. 2012, Pgs 1202-1207, for details on the data from trials of vitamin A supplementation used to support this claim.
- "Repeated measures of a population’s SROL distribution provide an effective tool for tracking the adequacy of dietary VA intakes over time. High-potency VA supplementation is intended to boost liver stores, enabling the gradual release and delivery of VA to tissues in children with dietary VA deficits. However, semi-annual supplementation does not resolve underlying dietary inadequacies. Thus we see only a transient shift in the SROL distribution. Overall, experimental data suggest that high-potency VA supplements protect children aged 6–59 months from hyporetinolaemia for approximately 8 to 10 weeks(19–23)." Palmer et al. 2012, Pg 1207.
- 57
- "Serum retinol distribution curves are used to evaluate program impact (111). However, the lack of change in serum retinol distribution over time in several countries that have sustained >70% coverage with vitamin A supplementation has raised the concern about the appropriate indicator (219). For this reason, the impact of supplementation programs is not measured by a change in the prevalence of low serum retinol concentrations but may be better served by evaluating coverage rates. Retinol concentrations may respond to sustained, improved dietary intakes and therefore can guide programmatic decisions about whether to maintain or change interventions (219). Thus, the use of serum retinol distributions among preschool children from cross-sectional surveys to assess the need for vitamin A interventions is still recommended." Tanumihardjo et al. 2016, Pgs 16S-17S.
- "There is a growing interest in measuring the impact of VA programs in countries that have implemented national-scale programs for several years. Serum retinol concentrations do not respond to VAS, except in a transient manner (ie, for 1-2 months). While the kinetics of this transient effect have not been well characterized, it presumably reflects the rapid use of VA to support its biological functions when background dietary intake is low and/or VA losses resulting from infections. Serum retinol concentration is therefore not recommended as an impact indicator where VAS is the only strategy for addressing VAD. For this reason, the impact of VAS programs is not measured by a change in VAD prevalence in the population, and the mortality impact is instead modeled using coverage data. Serum retinol concentrations are, however, responsive to improved dietary intakes, sustained over time, and therefore can guide programmatic decisions about whether to maintain or change intervention mixes. Thus, using serum retinol distributions among preschool-aged children— in conjunction with other vitamin A status markers or demographic/ecologic risk factors—from cross-sectional surveys to assess the need for VA interventions is still recommended, even in countries that have sustained high semiannual VAS coverage over several years." Klemm et al. 2016, Pgs 5-6.
- 58
Incidence of Bitot's spots was significantly lower in treatment groups in trials of VAS included in the meta-analysis Imdad et al. 2017: RR 0.42, 95% CI 0.33 to 0.53. Pg 5.
- 59
- "We collated 134 population-representative data sources from 83 countries with measured serum retinol concentration data. We used a Bayesian hierarchical model to estimate the prevalence of vitamin A deficiency, defined as a serum retinol concentration lower than 0·70 μmol/L. We estimated the relative risks (RRs) for the effects of vitamin A deficiency on mortality from measles and diarrhoea by pooling effect sizes from randomised trials of vitamin A supplementation. We used information about prevalences of deficiency, RRs, and number of cause-specific child deaths to estimate deaths attributable to vitamin A deficiency. All analyses included a systematic quantification of uncertainty." Pg e528.
- "The hierarchical model shares information to a greater degree where data are non-existent or weakly informative (ie, have large uncertainty), and to a lesser degree in countries or regions and in years with more data. We modelled trends over time as a linear trend. We did not include a non-linear term, as done for stunting, underweight, or anaemia,28–30 because fewer countries had several data sources for vitamin A deficiency than for other nutritional indicators; this data scarcity limits robust estimation of non-linear trends. The estimates were also informed by covariates that might help to predict vitamin A deficiency at the population level, including national income (logarithm of per-person gross domestic product [GDP] in inflation-adjusted international dollars), maternal education, proportion of population that lived in urban areas, mean weight-for-age Z score, and an aggregate metric of availability of calories and animal-source foods.31,32 The model included a variance term that accounted for unobserved design factors (sample design, season, retinol measurement method, etc) that led to variability in the data beyond that expected because of sample size. Finally, the model accounted for the fact that subnational data might have larger variation than national data by including an additional, empirically estimated, random effect for subnational data." Pg e530.
- 60
- "Regional prevalences in 1991 ranged from more than 40% in sub-Saharan Africa, south Asia, and east and southeast Asia and Oceania, to less than 25% in Latin America and the Caribbean, and in the region of central Asia, the Middle East, and north Africa. Nationally, the prevalence of vitamin A deficiency was at least 8% in every country; 100 countries had a prevalence of at least 20%, and hence would be classified as having a public health problem by WHO. Trends in the prevalence of deficiency from 1991 to 2013 varied by region, with a slight improvement at the worldwide level to 29% (17–42; PP of being a true decline=0·81). Deficiency significantly decreased in only one region: east and southeast Asia and Oceania, from 42% (19–70) to 6% (1–16; PP=0·99). The prevalence of deficiency might have decreased in Latin America and the Caribbean to 11% (4–23) in 2013 (PP=0·89) and in central Asia, Middle East, and north Africa to 11% (2–27) in 2013 (PP=0·76). In sub-Saharan Africa and south Asia, little change in prevalence occurred during the analysis period; both regions had prevalences of more than 40% for all years during the analysis period." Pg e532.
- "In 1991, 39% (95% credible interval 27–52) of children aged 6–59 months in low-income and middle-income countries were vitamin A deficient. In 2013, the prevalence of deficiency was 29% (17–42; posterior probability [PP] of being a true decline=0·81). Vitamin A deficiency significantly declined in east and southeast Asia and Oceania from 42% (19–70) to 6% (1–16; PP>0·99); a decline in Latin America and the Caribbean from 21% (11–33) to 11% (4–23; PP=0·89) also occurred. In 2013, the prevalence of deficiency was highest in sub-Saharan Africa (48%; 25–75) and south Asia (44%; 13–79). 94 500 (54 200–146 800) deaths from diarrhoea and 11 200 (4300–20 500) deaths from measles were attributable to vitamin A deficiency in 2013, which accounted for 1·7% (1·0–2·6) of all deaths in children younger than 5 years in low-income and middle-income countries. More than 95% of these deaths occurred in sub-Saharan Africa and south Asia." Pg e528.
- 61
See footnote above and results for Sierra Leone, Malawi, and Kenya in this spreadsheet
- 62
See Wirth et al. 2017, Pgs 6-7, for a list of countries in which biofortified crop programs have been implemented.
- 63
See this spreadsheet, Sheet "VAD where HKI works (or plans to work)" for sources and details.
- 64
See this spreadsheet, Sheet "VAD where HKI works (or plans to work)," Cells K4, K5, and K12 for sources and details.
- 65
- "We conducted representative surveys in Yaoundé and Douala, Cameroon, 2 years before and 1 year after the introduction of a mandatory national program to fortify cooking oil with VA. In each survey, 10 different households were selected within each of the same 30 clusters (n = ~300). Malaria infection and plasma indicators of inflammation and VA (retinol-binding protein, pRBP) status were assessed among women aged 15–49 years and children aged 12–59 months, and casual breast milk samples were collected for VA and fat measurements. Refined oil intake was measured by a food frequency questionnaire, and VA was measured in household oil samples post-fortification." Pg 1.
- Adjusted prevalence of VAD among preschool-aged children (26.6%) and unadjusted prevalence of VAD among preschool-aged children (41.2%) in 2012 reported in Engle-Stone et al. 2017, Pg 10, Table 4.
- Differences between 2009 and 2012 surveys of VAD prevalence and mean RBP among preschool-aged children were not statistically significant.
- 66
"There is likely a threshold of VAD prevalence below which VAS is unlikely to have much impact on mortality. If there is high-quality data showing low VAD in a region, Helen Keller thinks it is reasonable not to expect VAS to have a mortality impact there.
"Organizations in the Global Alliance for Vitamin A (GAVA) currently use 10% VAD as the threshold at or above which VAS programs ought to be maintained in a region. The World Health Organization (WHO) classifies VAD rates of 20% or greater among preschool-aged children as a serious public health problem. VAD rates of less than 5% are accepted as not much of a concern.
"Despite a lack of recent micronutrient analyses in many African countries, HKI is confident that VAD is prevalent enough in many places for VAS to remain an impactful intervention. For instance, while HKI is not aware of any recent micronutrient deficiency data in Mali, it would be surprising if VAD were not prevalent there, given Mali's child mortality and malnutrition rates." GiveWell's non-verbatim summary of a conversation with Helen Keller International, June 1, 2017, Pg 2.
- 67
"Despite the lack of data, Dr. Tanumihardjo thinks it is unlikely that oil fortification programs across sub-Saharan Africa are working well enough to render VAS programs unnecessary in most countries, given that many of the oil fortification programs are relatively new. Over the next few years, we may gain enough data on rates of VAD to make an informed decision about whether to continue or scale back VAS programs. If there were strong evidence that a country's vitamin A fortification program was effectively fortifying food and reaching target populations, it may be appropriate to scale back the programs. Dr. Tanumihardjo thinks it would be premature to start scaling back VAS programs before we have these data." GiveWell's non-verbatim summary of conversations with Sherry Tanumihardjo, October 17 and 27, 2017, Pg 2.
- 68
See our estimates in this spreadsheet, "VAD where HKI works (or plans to work)" sheet, column N.
- 69
- GiveWell's non-verbatim summary of a conversation with the Institute for Health Metrics and Evaluation, April 5, 2019:
- "In its Global Burden of Disease (GBD), IHME models VAD as both a direct cause of years lived with disability (YLDs) and as a risk factor for three other diseases (diarrheal diseases, lower respiratory tract infections (LRTIs), and measles)." Pg 1.
- "WHO collects results from VAD surveys in its Vitamin and Mineral Nutrition Information System (VMNIS). IHME uses these results, along with additional survey results from Demographic and Health Surveys (DHS) and other sources, as inputs for its VAD prevalence estimations.
"For many countries, there is either no VAD survey data available or the available data is more than 10 years old. To estimate VAD prevalence for countries and years without available survey data, IHME uses the following covariates in a predictive model (all of which are inversely related to VAD prevalence):
- VAS coverage – IHME uses UNICEF data on the proportion of targeted populations of preschool-aged children that receive vitamin A supplements.
- Socio-demographic Index (SDI) – IHME developed SDI as a composite of income levels, educational attainment, and fertility rates.
- Vitamin A availability in food – In collaboration with the Food and Agriculture Organization of the United Nations, IHME developed a global database (encompassing all 195 GBD countries) for the availability of 170 different nutrients. In its model of VAD prevalence, IHME treats vitamin A availability in national food supplies as a proxy for vitamin A consumption, but it does not account for consumption of vitamin A fortified foods—fortification data is often either unavailable or incomplete." Pg 2.
- GiveWell's non-verbatim summary of a conversation with the Institute for Health Metrics and Evaluation, April 5, 2019:
- 70
"WHO collects results from VAD surveys in its Vitamin and Mineral Nutrition Information System (VMNIS). IHME uses these results, along with additional survey results from Demographic and Health Surveys (DHS) and other sources, as inputs for its VAD prevalence estimations.
"For many countries, there is either no VAD survey data available or the available data is more than 10 years old. To estimate VAD prevalence for countries and years without available survey data, IHME uses the following covariates in a predictive model (all of which are inversely related to VAD prevalence):
- VAS coverage – IHME uses UNICEF data on the proportion of targeted populations of preschool-aged children that receive vitamin A supplements.
- Socio-demographic Index (SDI) – IHME developed SDI as a composite of income levels, educational attainment, and fertility rates.
- Vitamin A availability in food – In collaboration with the Food and Agriculture Organization of the United Nations, IHME developed a global database (encompassing all 195 GBD countries) for the availability of 170 different nutrients. In its model of VAD prevalence, IHME treats vitamin A availability in national food supplies as a proxy for vitamin A consumption, but it does not account for consumption of vitamin A fortified foods—fortification data is often either unavailable or incomplete." GiveWell's non-verbatim summary of a conversation with the Institute for Health Metrics and Evaluation, April 5, 2019, Pg 2.
- 71
- See "External validity by country" sheet here.
- Note that IHME does not directly estimate VAD prevalence for children aged 6 to 59 months. It estimates VAD prevalence for "post-neonatal" (28-364 days of age) and 1- to 4-year-old children. We have used IHME's estimates to calculate a rough estimate of VAD prevalence for 6- to 59-month-old children (see this spreadsheet, sheet "External validity by country," rows 3-5).
- As of 2019, Helen Keller is supporting VAS campaigns in Guinea, Mali, Burkina Faso, Côte d'Ivoire, Niger, and Kenya:
- "Since GiveWell recommended HKI Vitamin A Supplementation (VAS) program as a Top Charity at the end of 2017, HKI has received an additional ~USD $7.3 million from various donors, bringing the total to ~$USD 21 including the USD $13.7 million received from GiveWell over the past two years.
"This funding has been used to support VAS programs in 6 countries to date: Burkina Faso, Côte d’Ivoire, Guinea, Kenya, Mali and Niger." HKI room for more funding report July 2019, Pg 2.
- "Since GiveWell recommended HKI Vitamin A Supplementation (VAS) program as a Top Charity at the end of 2017, HKI has received an additional ~USD $7.3 million from various donors, bringing the total to ~$USD 21 including the USD $13.7 million received from GiveWell over the past two years.
- 72
"In collaboration with the Food and Agriculture Organization of the United Nations, IHME developed a global database (encompassing all 195 GBD countries) for the availability of 170 different nutrients. In its model of VAD prevalence, IHME treats vitamin A availability in national food supplies as a proxy for vitamin A consumption, but it does not account for consumption of vitamin A fortified foods—fortification data is often either unavailable or incomplete." GiveWell's non-verbatim summary of a conversation with the Institute for Health Metrics and Evaluation, April 5, 2019, Pg 2.
- 73
"For many countries, there is either no VAD survey data available or the available data is more than 10 years old. To estimate VAD prevalence for countries and years without available survey data, IHME uses the following covariates in a predictive model (all of which are inversely related to VAD prevalence):
- VAS coverage – IHME uses UNICEF data on the proportion of targeted populations of preschool-aged children that receive vitamin A supplements.
- Socio-demographic Index (SDI) – IHME developed SDI as a composite of income levels, educational attainment, and fertility rates.
- Vitamin A availability in food – In collaboration with the Food and Agriculture Organization of the United Nations, IHME developed a global database (encompassing all 195 GBD countries) for the availability of 170 different nutrients. In its model of VAD prevalence, IHME treats vitamin A availability in national food supplies as a proxy for vitamin A consumption, but it does not account for consumption of vitamin A fortified foods—fortification data is often either unavailable or incomplete." GiveWell's non-verbatim summary of a conversation with the Institute for Health Metrics and Evaluation, April 5, 2019, Pg 2.
- 74
See this spreadsheet, "Child mortality rates by country" sheet, for our calculations.
- 75
See the "Improved overall health conditions" and "Interpreting the evidence in light of DEVTA" sections of our vitamin A supplementation intervention report for more information on baseline child mortality rates in VAS trials.
- 76
See this spreadsheet, Sheet “Child mortality rates by country,” Row 20 for full details.
- 77
Imdad et al. 2017, Pgs 111-112, Analysis 1.1.
- 78
“Deaths per child-care centre at ages 1.0–60 years during the 5-year study (the primary trial endpoint) were 3.01 retinol versus 3.15 control (absolute reduction 0.14 [SE 0.11], mortality rate ratio [RR] 0.96, 95% CI 0.89–1.03, p=0.22), suggesting absolute risks of death between ages 1.0 and 6.0 years of approximately 2.5% retinol versus 2.6% control.” Awasthi et al. 2013, Pg 1473.
- 79
- 80
- Table 2, Ross et al. 1993, Pg. 10.
- "The 21 906 children who entered the Survival Study were followed up for 33 287 child-years (16 508 vitamin A group, 16 779 placebo group)." Ross et al. 1993, Pg. 10.
- "There were 892 deaths among the children in the Survival Study, which gave an overall mean mortality rate for all clusters of 27.11 per 1,000 child-years of follow-up. 397 of the deaths were in vitamin A clusters (mean mortality rate 24.4 per 1000 child-years) and 495 in placebo clusters (29.9 per 1000 child-years)." Ross et al. 1993, Pg 10.
- 81
Table III, West et al. 1991, Pg. 68.
- 82
- Table III, Herrera et al. 1992, Pg. 269.
- "During the 18 months of follow-up, there were 120 deaths (8.4/1000) in the vitamin A group and 112 deaths (7.9/1000) in the placebo group (RR 1.06, 95% CI 0.82-1.37) (table II)." Herrera et al. 1992, Pg. 269.
- 83
Table III, Daulaire et al. 1992, Pg. 208.
- 84
- Table VI, Sommer et al. 1986, Pg. 1171.
- "Teams first visited villages between September, 1982, and August, 1983, and follow-up visits were made by the same team in the same sequence 9-13 months later." Sommer et al. 1986, Pg. 1169.
- 85
"Nine trials reported mortality due to diarrhoea and showed a 12% overall reduction for VAS (RR 0.88, 95% CI 0.79 to 0.98; 1,098,538 participants; high-quality evidence). There was no significant effect for VAS on mortality due to measles, respiratory disease, and meningitis. Imdad et al. 2017, Pg 2.
- 86
"There was no significant effect for VAS on mortality due to measles, respiratory disease, and meningitis. VAS reduced incidence of diarrhoea (RR 0.85, 95% CI 0.82 to 0.87; 15 studies; 77,946 participants; low-quality evidence) and measles (RR 0.50, 95% CI 0.37 to 0.67; 6 studies; 19,566 participants; moderate-quality evidence)." Imdad et al. 2017, Pg 2.
- 87
See this spreadsheet, sheet "Comprehensiveness (2018-19)" for details.
- 88
See this spreadsheet, sheet "Comprehensiveness (2018-19)" for details.
- 89
See this spreadsheet, sheet "Comprehensiveness (2018-19)," cell D83.
- 90
See this spreadsheet, sheet "Comprehensiveness (2018-19)."
Helen Keller has shared a report from an evaluation it conducted in Kenya of a separate program: HKI, Final evaluation of Every Child Thrives (ECT) Project in Kenya, 2020. This evaluation included a limited coverage survey that assessed VAS coverage in three sub-counties within the eight counties supported by Helen Keller. We have low confidence in the representativeness of these results and thus have not reviewed this report in depth.
- 91
See the most recent version of the model here, line "Misappropriation without monitoring results."
- 92
See this spreadsheet, sheet "Results analysis (2013-19)" for details.
- 93
We have seen coverage surveys (and estimates of total vitamin A supplements delivered, provided by administrative data for corresponding distributions) representing around 19% of the total vitamin A supplements delivered with Helen Keller support between 2013 and 2016:
- See our summary of the results of recent coverage surveys we have seen in this spreadsheet, "Results analysis (2013-19)" sheet. The total number of vitamin A supplements monitored through coverage surveys (for which we have also seen administrative data) in Helen Keller's recent 2013-2016 Global Affairs Canada grant is 35,673,646 (cell B89).
- The total number of vitamin A supplements delivered in catchment areas receiving direct Helen Keller support during Helen Keller's recent 2013-2016 Global Affairs Canada grant is 192,281,849. Calculated from HKI VAS summary table, "VAS coverage" sheet.
- 35,673,646 / 192,281,849 = 18.6%.
- Note that we are only counting "catchment areas receiving direct HKI support" in our denominator. HKI VAS summary table, "VAS coverage" sheet, also reports on total vitamin A supplements delivered at a national level, but our understanding is that Helen Keller only supports coverage surveys in regions where it directly supports VAS programs.
- Note that there are several coverage surveys that we have seen results from, but for which we have not seen the corresponding administrative data providing estimates of the number of VAS doses delivered (see spreadsheet linked above). Supplements delivered in distributions monitored by these coverage surveys are not included in our estimate of the total number of vitamin A supplements monitored through coverage surveys (35,673,646).
- Our understanding is that the totals included in HKI VAS summary table, "VAS coverage" sheet, include vitamin A supplements delivered through routine distributions, which are not monitored through post-event coverage surveys. We don't know what proportion of the totals listed were delivered through routine mechanisms.
- 94
- HKI analysis of PECS data March 2017 includes a column stating the primary reason for each survey. We have copied this information into this spreadsheet, "Results analysis (2013-19)" sheet. The listed reason for conducting many of the surveys that occurred prior to 2018 was "Low performance," indicating that Helen Keller expected coverage to be low in the areas selected. We have not seen more detailed descriptions of the reasons why these areas were chosen for surveys. We note that the stated reason for a survey in Ekiti and Katsina States reported in HKI analysis of PECS data March 2017 differs from the description in the report we have seen (see below).
- We have seen detailed reports on two coverage surveys from distributions conducted under Helen Keller's most recent grant from Global Affairs Canada. See our summary of the methodologies of these surveys in this spreadsheet, "Methods (2014-18)" sheet.
- Ekiti and Katsina states in Nigeria were chosen to be surveyed in 2014-2015 because they had not yet been surveyed by Helen Keller:
- "Ekiti and Katsina are among the states supported by HKI for VAS implementation during MNCHW in Nigeria. According to tally sheet data the two states have recorded a considerably good VAS coverage rate over a 5 year period. However, there has not been any validation of this data before. Therefore, in order to validate VAS coverage in Ekiti and Katsina, PECS was conducted in January 2015 among caregivers of children aged 6-59 months who attended the November 2014 MNCH Week." HKI post-event coverage survey report Nigeria - Ekiti and Katsina states 2014, Pg 8.
- The city of Dar es Salaam in Tanzania was chosen to be surveyed in 2015 because it had a history of low VAS coverage:
- "In 2014, we opted to target the PECS data collection to areas which had historically performed poorly with VASD. Dar es Salaam, the countries business capital and largest city has a history of low VAS coverage, and 2014 proved to be no exception." HKI post-event coverage survey report Tanzania 2015, Pg 6.
- We have seen results for 31 surveys taking place under Helen Keller's most recent grant from Global Affairs Canada (see this spreadsheet, "Results analysis (2013-19)" sheet, but, with the exceptions of the Ekiti and Katsina states survey and the Dar es Salaam survey mentioned above, we do not know why Helen Keller or its partners chose to conduct surveys in those particular areas.
- Helen Keller notes: "The reasons can vary from one country to another. In some countries, PECS are undertaken to validate coverage in HKI-assisted regions. In others, the scope of a PECS depends on host country government and national working group interests or requests which might result in a survey implemented to provide a national, sub-national or area-specific (e.g.hard-to-reach) coverage estimate. PECs are NOT implemented for all VAS distribution rounds partly due to funding limitations but also because they are not warranted after each round. For example, if a PECs reveals low VAS coverage, only when demonstrable steps are taken to address the reasons for low coverage would a follow-on PECs be justified." Comment provided in response to a draft of this review in August 2017.
- 95
- 96
Rolf Klemm, HKI Vice President of Nutrition, and David Doledec, HKI Regional VAS Program Manager, conversation with GiveWell, March 30, 2020.
- 97
See the most recent version of the model here, line "False monitoring results."
- 98
For details of standard sampling procedure, see HKI, Post-event coverage survey guide, 2019, Pgs 18-24.
- 99
See this spreadsheet, sheet "Methods (2019)," row "Was the sample stratified at the regional/district level? If so, how were units selected?"
- 100
See this spreadsheet, sheet "Methods (2019)," row "Was the sample stratified at the village (or similar) level? If so, how were units selected?"
- 101
“This first step will consist in listing all the eligible households in each cluster. The maps of sampled clusters will be handed to the enumerators who, once in the cluster, will enumerate all the households in the cluster and enter the identification number of each identified household on their door and on the household census form. . . . Each evening, all the team leaders will report the households surveyed by cluster to the senior supervisor, indicating the number of eligible households identified per cluster. A random sampling using the function RANDBETWEEN (min, max) of Excel will be used for the household sampling. It's a simple matter of entering as minimum value 1 and maximum value the number of eligible households in the cluster and then draw the function on the number of households to be surveyed. Thus, we have a list of number of households and only these households will be surveyed (since each household in the cluster is numbered from 1 to n). An inventory form of households selected in this way will be established for monitoring.” HKI, Post-event coverage survey guide, 2019, pgs. 30-31.
- 102
See this spreadsheet, sheet "Methods (2019)," row "What was the targeting method for individual respondents within villages (or similar)?"
Our understanding that all eligible children in selected households are surveyed comes from Rolf Klemm, HKI Vice President of Nutrition, and David Doledec, HKI Regional VAS Program Manager, conversation with GiveWell, March 30, 2020.
- 103
"Note that supervisors accompany the data collection teams during the census and survey, which one might assume would minimize this potential for 'convenience' bias. Also, it should be noted that the national statistics office provides an estimate of the expected average number of households per cluster which is compared with the census number of households before survey households are selected. Wide disparities between the two estimates are flagged." Helen Keller, comments on a draft of this page, October 2020.
- 104
“If the respondent is absent at the first visit, return at least twice more.” HKI, Post-event coverage survey guide, 2019, pg. 31.
- 105
See this spreadsheet, sheet "Methods (2019)," rows 7 and 8.
- 106
See this spreadsheet, sheet "Methods (2019)," rows 7 and 8.
- 107
See this spreadsheet, sheet "Methods (2019), row "What proportion of those who were targeted for interviews were interviewed?"
- 108
See example here: HKI, Post-event coverage survey questionnaires, 2019.
- 109
See this spreadsheet, sheet "Methods (2019)," row "How well-designed is the questionnaire? Are questions unambigous? Was the questionnaire piloted and updated before the survey? Is the questionnaire short?"
- 110
- See this spreadsheet, sheet "Methods (2019)," row "How objective are responses?"
- See also HKI, Post-event coverage survey questionnaires, 2019.
- 111
See this spreadsheet, sheet "Methods (2019)," row "How objective are responses?" An exception is the coverage survey for the first 2019 campaign in Guinea, where data collection occurred up to two months after the campaign (cell E9).
- 112
“(Show capsules or a picture of vitamin A)” HKI, Post-event coverage survey questionnaires, 2019, pg. 3.
“(Show a tablet or deworming photo).” HKI, Post-event coverage survey questionnaires, 2019, pg. 4. - 113
See this spreadsheet, sheet "Methods (2019)," row "Who are the individuals who were involved in the survey (enumerators, supervisors, and managers)? What personal interest might they have in the outcome of the survey?"
- 114
“Is it correct that the 10% re-survey procedure was used in all surveys, including those for which it is not explicitly mentioned in reports? Yes the 10% re-survey procedure was used in all surveys, indeed, the procedure for revisiting the 10% of households is part of the methodology used for the PECS surveys.
What are the details of this procedure (How are re-survey households selected? A quality control of 10% of the data collected by the interviewers is carried out by the supervisor, thus, in each locality the supervisor randomly selects one (01) household already surveyed and asks some essential questions (i.e. linked with coverage) from the household questionnaire and adapted for a double interview in order to evaluate the coverage of services provided to these surveyed households. The household responses from the first interview will be compared to those from the second interview. The household identification number writen on their door by the interviewers helps the supervisor to easily locate the drawn households.
Are supervisors blinded to initial results? Yes, The supervisor does not have access to the initial results before going to the field to draw the 10% of households to be surveyed. The random sampling of the 10% households is done once in the cluster by the supervisor.
What is the process for correcting issues? If both the interviewer and the supervisor are in the cluster, the supervisor conducts the verification and provides feedback to the interviewer to return to the household if necessary or to improve future surveys. If the interviewer and the supervisor are not in the cluster together, the verification data are sent to the platform and the ONA platform manager provides daily feedback on the concordance of the data to return to improve future surveys. In all cases, the household responses from the first interview will be compared to those from the second interview.” HKI, answers to GiveWell’s questions, September 30, 2020
- 115
See this spreadsheet, sheet "Methods (2019)," row "Are there methods in place for assessing the accuracy of a random sample of each enumerator's entries? Does the enumerator know that auditing will occur but does not know which entries will be monitored? Were high levels of discrepancies found? What is the process for correcting issues found?"
- 116
See this spreadsheet, sheet "Methods (2019)," row "For data captured directly in digital format, was any data lost to theft or technical problems? For data captured in paper format, were any forms lost or discarded before entry? How do we know whether the full data set was received?"
- 117
See this spreadsheet, sheet "Methods (2019)," rows 8 and 15.
- 118
See this spreadsheet, sheet "Results summary," cell B12.
- 119
See this spreadsheet, sheet "Results summary," cell B13, and sheet "Coverage (2019)," cell E18.
- 120
See this spreadsheet, sheet "Results summary," cell B14, and sheet "Coverage (2019)," cell E20.
- 121
See this spreadsheet, sheet "Results summary," cell B4.
- 122
This is our understanding from multiple conversations with Helen Keller.
- 123
"HKI teams work closely with national governments to support the policy, strategy and tool development mentioned above, but HKI’s major added value is its capacity to rapidly deploy technical support to the sub national level to assist local health authorities with implementing national VAS strategies. HKI focus its efforts sub-nationally because local level (at state and/or district level) health system performance is key to ensuring high VAS coverage. It also allows HKI to support other health system functions that also improve the delivery of other maternal and child health services.
"In concrete terms, HKI, in consultation with national government counterparts, directs its support to low performing areas to help local program managers identify and solve VAS coverage barriers. This involves organizing workshops with state and district health authorities to analyze what worked and what did not. HKI teams then spend time with health managers to help them identify feasible and cost-effective solutions to improve performance of the targeted services and accompany them through the whole programming cycle (i.e. planning, budgeting, implementation, real time supervision and monitoring, and finally evaluation of the progress made). One cycle sometimes proves insufficient so the HKI teams continue working with each targeted health district until minimum thresholds of performance are met. Funds are used to support deployment of HKI teams in remote areas, to support financing workshops and joint field supervisions, to provide training for field actors, or to organize coverage surveys and review meetings at the end of the exercise. In some cases, HKI provides funds directly to the local authorities to fill financial gaps they may experience ensuring rigorous financial accountability. When conditions for a change of approach are met, HKI provides technical assistance to local authorities to design, implement and monitor with them innovative approaches such as the 6-month contact point or SMS messaging." HKI VAS documents guide for GiveWell 2017, Pg 2.
- 124
"Many African countries are facing funding shortfalls around VAS, and some planned VAS mass campaigns have had to be cancelled. For instance, in Mali (which HKI does not currently have funds to support, but which received support from HKI for VAS programs in 2013-16), it is not clear whether VAS mass campaigns will occur at all without external technical assistance from HKI. HKI still expects vitamin A capsules to be provided to countries in sufficient numbers, but there is a risk of millions of capsules remaining undistributed if campaigns are underfunded." GiveWell's non-verbatim summary of a conversation with Helen Keller International, June 1, 2017, Pg 7.
- 125
- As evidence that its support of VAS program leads to higher coverage rates, Helen Keller has sent us several examples of cases in which it provided support to a Child Health Day VAS mass distribution program, and in which VAS coverage rates above 80% were achieved. In Rolf Klemm, HKI Vice President of Nutrition, email to GiveWell, October 19, 2017, Helen Keller pointed us to:
- A 2014 Child Health Day program in Bas Congo Province, DRC, that achieved 91.1% VAS coverage using a fixed distribution strategy, according to Helen Keller's coverage survey:
- See row 12 in the "Full results" sheet in this spreadsheet.
- Details (in French) in HKI DRC PECS report 2014. We have not reviewed this report carefully.
- A 2015 Child Health Day program in Kasai Oriental, DRC, that achieved 90% coverage using a fixed strategy and 89% coverage using a door-to-door strategy, according to Helen Keller's coverage surveys:
- See rows 13-14 in the "Full results" sheet in this spreadsheet.
- Details (in French) in HKI DRC PECS report 2015. We have not reviewed this report carefully.
- Increases in coverage rates in the Littoral Region in Cameroon, where Helen Keller supported door-to-door VAS mass distributions, between 2011 and 2014. In 2011, Helen Keller's coverage survey found 53% coverage of VAS, and its coverage survey in 2014 found 90% coverage.
- See HKI analysis of PECS data March 2017 for coverage survey results.
- These surveys are also discussed in HKI lessons learned on VAS in six urban health districts in Cameroon 2014. We have not reviewed this report carefully.
- Helen Keller's national-level coverage surveys in Mozambique, which found that coverage levels were above 80% through a Child Health Day fixed distribution strategy:
- See rows 20-21 in the "Full results" sheet in this spreadsheet.
- A 2014 Child Health Day program in Bas Congo Province, DRC, that achieved 91.1% VAS coverage using a fixed distribution strategy, according to Helen Keller's coverage survey:
- We believe these examples are useful for showing that coverage rates above 80% can be achieved with Helen Keller's support in Child Health Day programs using a fixed and outreach distribution strategy. But we do not find this evidence to be convincing, on its own, that Helen Keller's support causes VAS coverage rates to increase above what they would be in Helen Keller's absence, since we lack appropriate comparisons for these examples (e.g., coverage rates in similar districts or regions that did not have support from Helen Keller).
- As evidence that its support of VAS program leads to higher coverage rates, Helen Keller has sent us several examples of cases in which it provided support to a Child Health Day VAS mass distribution program, and in which VAS coverage rates above 80% were achieved. In Rolf Klemm, HKI Vice President of Nutrition, email to GiveWell, October 19, 2017, Helen Keller pointed us to:
- 126
"We reanalyzed the data to explore the hypothesis that VAS reduces mortality in children who had bacille Calmette-Guerin or measles vaccine as their most recent vaccine but increased mortality when diphtheria-tetanus-pertussis vaccine (DTP) was the most recent vaccine. On the basis of previous studies, we expected the effects to be strongest in girls." Benn et al. 2009, Pg 629.
- 127
"As hypothesized, the reanalysis suggests important interactions between VAS, sex, and vaccines. VAS was associated with a strong beneficial effect in children with no record of vaccination, whereas there was almost no effect for those who had been vaccinated. This differential effect was due to a difference in girls, in whom VAS was associated with a decrease in mortality in the unvaccinated but in whom VAS was associated with a nonsignificant increase in mortality in the vaccinated (Table 2). This was due to a differential effect of VAS according to vaccination type. Among girls who had already received MV at enrollment, VAS was associated with significantly higher mortality. This was only seen in girls who were missing doses of DTP at enrollment and were therefore likely to receive them during follow-up (Table 5)." Benn et al. 2009, Pg 635.
- 128
- "We have hypothesized that the effect of VAS is modified by vaccines, VAS amplifying the non-specific immune-modulating effects of vaccines, thus being beneficial when provided with live vaccines but potentially harmful with inactivated vaccines." Pg e740.
- "As prespecified, all analyses considered interaction between VAS and gender and, in addition, previous VAS and season." Pg e741.
- 129
"Between August 2007 and November 2010, 7587 children were enrolled. Within 6 months of follow-up 80 non-accident deaths occurred (VAS: 38; placebo: 42). The mortality rate ratio (MRR)comparing VAS versus placebo recipients was 0.91 (95% confidence interval 0.59–1.41) and differed significantly between boys (MRR1.92 [0.98–3.75]) and girls (MRR 0.45 [0.24–0.87]) (P= .003 for interaction between VAS and gender). At enrollment, 42% (3161/7587) received live measles vaccine, 29% (2154/7587) received inactivated diphtheria-tetanus-pertussis–containing vaccines, and 21% (1610/7587)received both live and inactivated vaccines. The effect of VAS did not differ by vaccine group." Fisker et al. 2014, Pg e739.
- 130
See this document for our research on the biological plausibility of interactions between vitamin A supplementation and vaccine effectiveness.
- 131
"When the correct age-specific dose of vitamin A is given with immunization, mild side-effects or adverse events may be observed. However, they are rare and transient. Occasionally, some children experience loose stools, headache, irritability, fever, nausea, and vomiting. Depending on age and the dosage given, the excess rate of occurrence of these mild symptoms of intolerance has shown be in the range of 1.5-7% (Florentino et al., 1990; West et al., 1992; Agoestina et al., 1994). These side-effects disappear in practically all children within 24-48 hours (Florentino et al., 1990; West et al., 1992; Agoestina et al., 1994)." WHO vitamin A supplements adverse events, Pgs 1-2.
- 132
"When the correct age-specific dose of vitamin A is given with immunization, mild side-effects or adverse events may be observed. However, they are rare and transient. Occasionally, some children experience loose stools, headache, irritability, fever, nausea, and vomiting. Depending on age and the dosage given, the excess rate of occurrence of these mild symptoms of intolerance has shown be in the range of 1.5-7% (Florentino et al., 1990; West et al., 1992; Agoestina et al., 1994). These side-effects disappear in practically all children within 24-48 hours (Florentino et al., 1990; West et al., 1992; Agoestina et al., 1994)." WHO vitamin A supplements adverse events, Pgs 1-2.
- 133
WHO vitamin A supplements adverse events:
- "The administration of excessive amounts of vitamin A can lead to toxicity, known as hypervitaminosis A. The amount required to cause toxicity will vary among individuals." Pg 1.
- "Worldwide, the incidence of hypervitaminosis A is a very minor problem compared with the incidence and effects of vitamin A deficiency. An estimated 200 cases of hypervitaminosis A occurs annually…" Pg 1.
- "Hypervitaminosis does not result from public health intervention programs. Rather toxicity has been associated with the abuse of vitamin A supplements and with diets extremely high in preformed vitamin A (i.e., foods of animal origin). Toxic reactions provoked by large doses of vitamin A are well-known to occur following either intake of liver rich in vitamin A (e.g., polar bear, halibut or whale) or by excessive administration of vitamin A preparations (Miller & Hayes, 1982)." Pg 2.
- "Acute vitamin A toxicity (single ingestion of 25,000 IU per kg or more): Signs and symptoms may be delayed for 8 to 24 hours and include manifestations such as nausea, vomiting, diarrhea, changes in humour (irritability, drowsiness, dizziness, lethargy), increased intracranial pressure (headache, bulging of fontanelle, diplopia, papilloedema), skin changes (erythema, pruritus, desquamation). Peeling of skin around mouth may be observed from 1 to several days after ingestion and may spread to the rest of the body (Miller & Hayes, 1982; Bendich & Langseth, 1989; Hathcock et al., 1990; CPS, 1999; Parfit, 1999)." Pg 2.
- 134
- "Hypervitaminosis does not result from public health intervention programs. Rather toxicity has been associated with the abuse of vitamin A supplements and with diets extremely high in preformed vitamin A (i.e., foods of animal origin). Toxic reactions provoked by large doses of vitamin A are well-known to occur following either intake of liver rich in vitamin A (e.g., polar bear, halibut, or whale) or by excessive administration of vitamin A preparations (Miller & Hayes, 1982)." WHO vitamin A supplements adverse events, Pg 2.
- Helen Keller told us that receiving two doses of vitamin A supplements within a short time period would not meet toxicity thresholds:
- "[GiveWell:] In countries where six-month contact points have been initiated, is there a risk of a child receiving a 'double dose' of VAS in a short time period (one from a facility visit when the infant is six months old, and another at the next biannual Child Health Day or door-to-door campaign)? Would receiving a double-dose potentially be dangerous? (Even if they aren't dangerous, we're also concerned about double-doses because they wouldn't be an effective use of resources.)
"[HKI:] This is a legitimate question and one we have had to think about carefully as we started to promote and support the 6 month contact point (6MCP). First, receiving two doses in a short time frame poses some, but minimal, risks for children as the toxicity thresholds go far beyond receiving two doses (see attached document on Adverse events following administration of VAS)."
HKI responses to GiveWell's questions May 2017
- "[GiveWell:] In countries where six-month contact points have been initiated, is there a risk of a child receiving a 'double dose' of VAS in a short time period (one from a facility visit when the infant is six months old, and another at the next biannual Child Health Day or door-to-door campaign)? Would receiving a double-dose potentially be dangerous? (Even if they aren't dangerous, we're also concerned about double-doses because they wouldn't be an effective use of resources.)
- 135
For example, see discussion of GiveWell staff's observations in October 2017 Maternal and Child Health Week in Guinea, GiveWell's notes from a site visit with HKI to Conakry, Guinea, October 9-11, 2017, Pgs 11-14.
- 136
For example, see discussion of GiveWell staff's observations in October 2017 Maternal and Child Health Week in Guinea, GiveWell's notes from a site visit with HKI to Conakry, Guinea, October 9-11, 2017, Pgs 11-14.
- 137
See the "HKI 2018-2019 spending" sheet in our 2020 cost per supplement analysis for Helen Keller.
- 138
See the "Budgets of other organizations" sheet in our 2020 cost per supplement analysis for Helen Keller.
- 139
See the "In-kind government costs" sections on the "Cost per supplement" sheets for Guinea, Mali, Burkina Faso, and Niger of our 2020 cost per supplement analysis for Helen Keller.
- 140
See the "Supplements delivered in HKI-supported areas" sheet in our 2020 cost per supplement analysis for Helen Keller.
- 141
See our 2020 cost per supplement analysis spreadsheet, "HKI budgets of other organizations" sheet.
- 142
See our 2020 cost per supplement analysis spreadsheet, "Cost per supplement" sheets for Guinea, Mali, Burkina Faso, and Niger.
- 143
See this section of our review of the Schistosomiasis Control Initiative for details.
- 144
See our 2020 cost per supplement analysis spreadsheet, "Supplements delivered in HKI-supported areas" sheet.
- 145
- See our 2020 cost per supplement analysis, "HKI 2018-2019 spending" sheet.
- The sheet linked above also reports Helen Keller's spending in Sierra Leone in 2018 and 2019. Helen Keller's spending of GiveWell-directed funding in Sierra Leone supported routine VAS distribution, not VAS mass campaigns:
- "In Sierra Leone, HKI supports the scale up of routine delivery of VAS as campaigns are phasing out. This program, funded by Irish Aid and UNICEF and implemented by HKI and the MoH, consists of a package of services delivered through health facilities beginning when children reach 6 months of age: VAS, deworming, counseling on family planning, reproductive health services, counseling on infant and young child feeding, growth monitoring and promotion and routine immunization. After 1 year of implementation, a survey conducted in October 2018 showed VAS coverage of between 70 and 90% for all children under five in the three districts where the package has been piloted. Givewell funds were also allocated to fill a gap of funding for this program between the ending of one and signature of a new grant from UNICEF." HKI annual report to GiveWell 2018, Pg 4.
- "Some funds from small donations supported operations research efforts in Sierra Leone focusing on integrating gender equity components within the country’s routine delivery system." HKI, VAS 2019 annual report, Pg 2.
- 146
- We attempted to calculate a cost per supplement delivered estimate for Helen Keller-supported VAS campaigns in Côte d'Ivoire. We arrived at an estimate of $0.60 per supplement delivered, which is substantially lower than several of our cost per supplement delivered estimates for other countries. (See this document for more details.) Helen Keller has told us that it thinks its costs per supplement delivered in countries in West Africa are roughly similar, and that it is not plausible that costs are so low in Cote d'Ivoire—it expects that some type of cost was omitted.
- "We are confident in the coverage measured by PECS surveys, and are planning to conduct a cost effectiveness assessment of the campaign as soon as the situation allows, most likely first round of 2021. We are currently assessing the costs and will come back to you soon, but as indicated we are assuming that some data must be missing. We are expecting the cost per child to be closer to 1 – 1.5 usd like other countries." HKI, Responses to GiveWell's questions, October 10, 2020, Pg. 5.
- We also calculated a cost per supplement delivered estimate for Helen Keller-supported VAS campaigns in Kenya of $0.49. (See this document for more details.) We have low confidence in this estimate because it relies on a coverage survey that may not be representative of all Helen Keller-supported areas in Kenya.
- See this cell in our "Helen Keller's coverage surveys, methods and results [2020]" spreadsheet.
- We are also not very certain that we have a full understanding of spending from other organizations at a national level in Kenya that may have contributed to the delivery of vitamin A supplements in areas supported by Helen Keller.
- We attempted to calculate a cost per supplement delivered estimate for Helen Keller-supported VAS campaigns in Côte d'Ivoire. We arrived at an estimate of $0.60 per supplement delivered, which is substantially lower than several of our cost per supplement delivered estimates for other countries. (See this document for more details.) Helen Keller has told us that it thinks its costs per supplement delivered in countries in West Africa are roughly similar, and that it is not plausible that costs are so low in Cote d'Ivoire—it expects that some type of cost was omitted.
- 147
See this spreadsheet for the list of interventions provided in Guinea, Burkina Faso, Côte d'Ivoire, Niger, Kenya, Mali, and Nigeria in 2020.
- 148
On the "inclusion/exclusion" sheet in our cost-effectiveness analysis, we include a rough estimation of the impact these additional interventions would have on Helen Keller's cost-effectiveness. See our most recent cost-effectiveness analysis here.
- 149
For a discussion of why we consider funding a charity's work up to three years in the future, see this blog post.
- 150
Some of our top charities have a policy of holding funding reserves. In our room for more funding analyses, we typically include reserved funding as funding available to support program activities. We do this both to ensure consistency across top charities (as not all top charities hold reserves) and to understand the true effect of granting additional funding (i.e. whether additional funding would support undertaking additional program activities versus building or maintaining reserves).
- 151
GiveWell maintains a list of all charities that meet our criteria, along with a recommendation to donate to our Top Charities Fund (we updated the name of this fund in September 2022; more information here). Some donors give based on our top charity list but do not follow our donation recommendation. In our projections of future funding, we typically count only one year of funding that an organization receives as a result of being on our list of top charities in order to retain the flexibility to change our recommendations in future years.
- 152
We update a top charity's room for more funding analysis more frequently if we grant funding to it more frequently.
- 153
We update a top charity's room for more funding analysis more frequently if we have reason to believe that its funding and budgets have changed substantially.
- 154
For a list of grants we have made from our Top Charities Fund, see this page, section "Past recipients of the Top Charities Fund." (We updated the name of this fund in September 2022; more information here.)
- 155
Open Philanthropy, a philanthropic organization with which we work closely, is the largest single funder of our top charities. The vast majority of Open Philanthropy's current giving comes from Good Ventures. We make recommendations to Open Philanthropy each year for how much funding to provide to our top charities and how to allocate that funding among them. An example of these recommendations from November 2020 can be found on this page.
- 156
This includes donations made to charities on our checkout page, donations made directly to the organizations, and donations through other third-party organizations that share GiveWell’s recommendations (e.g., One for the World).
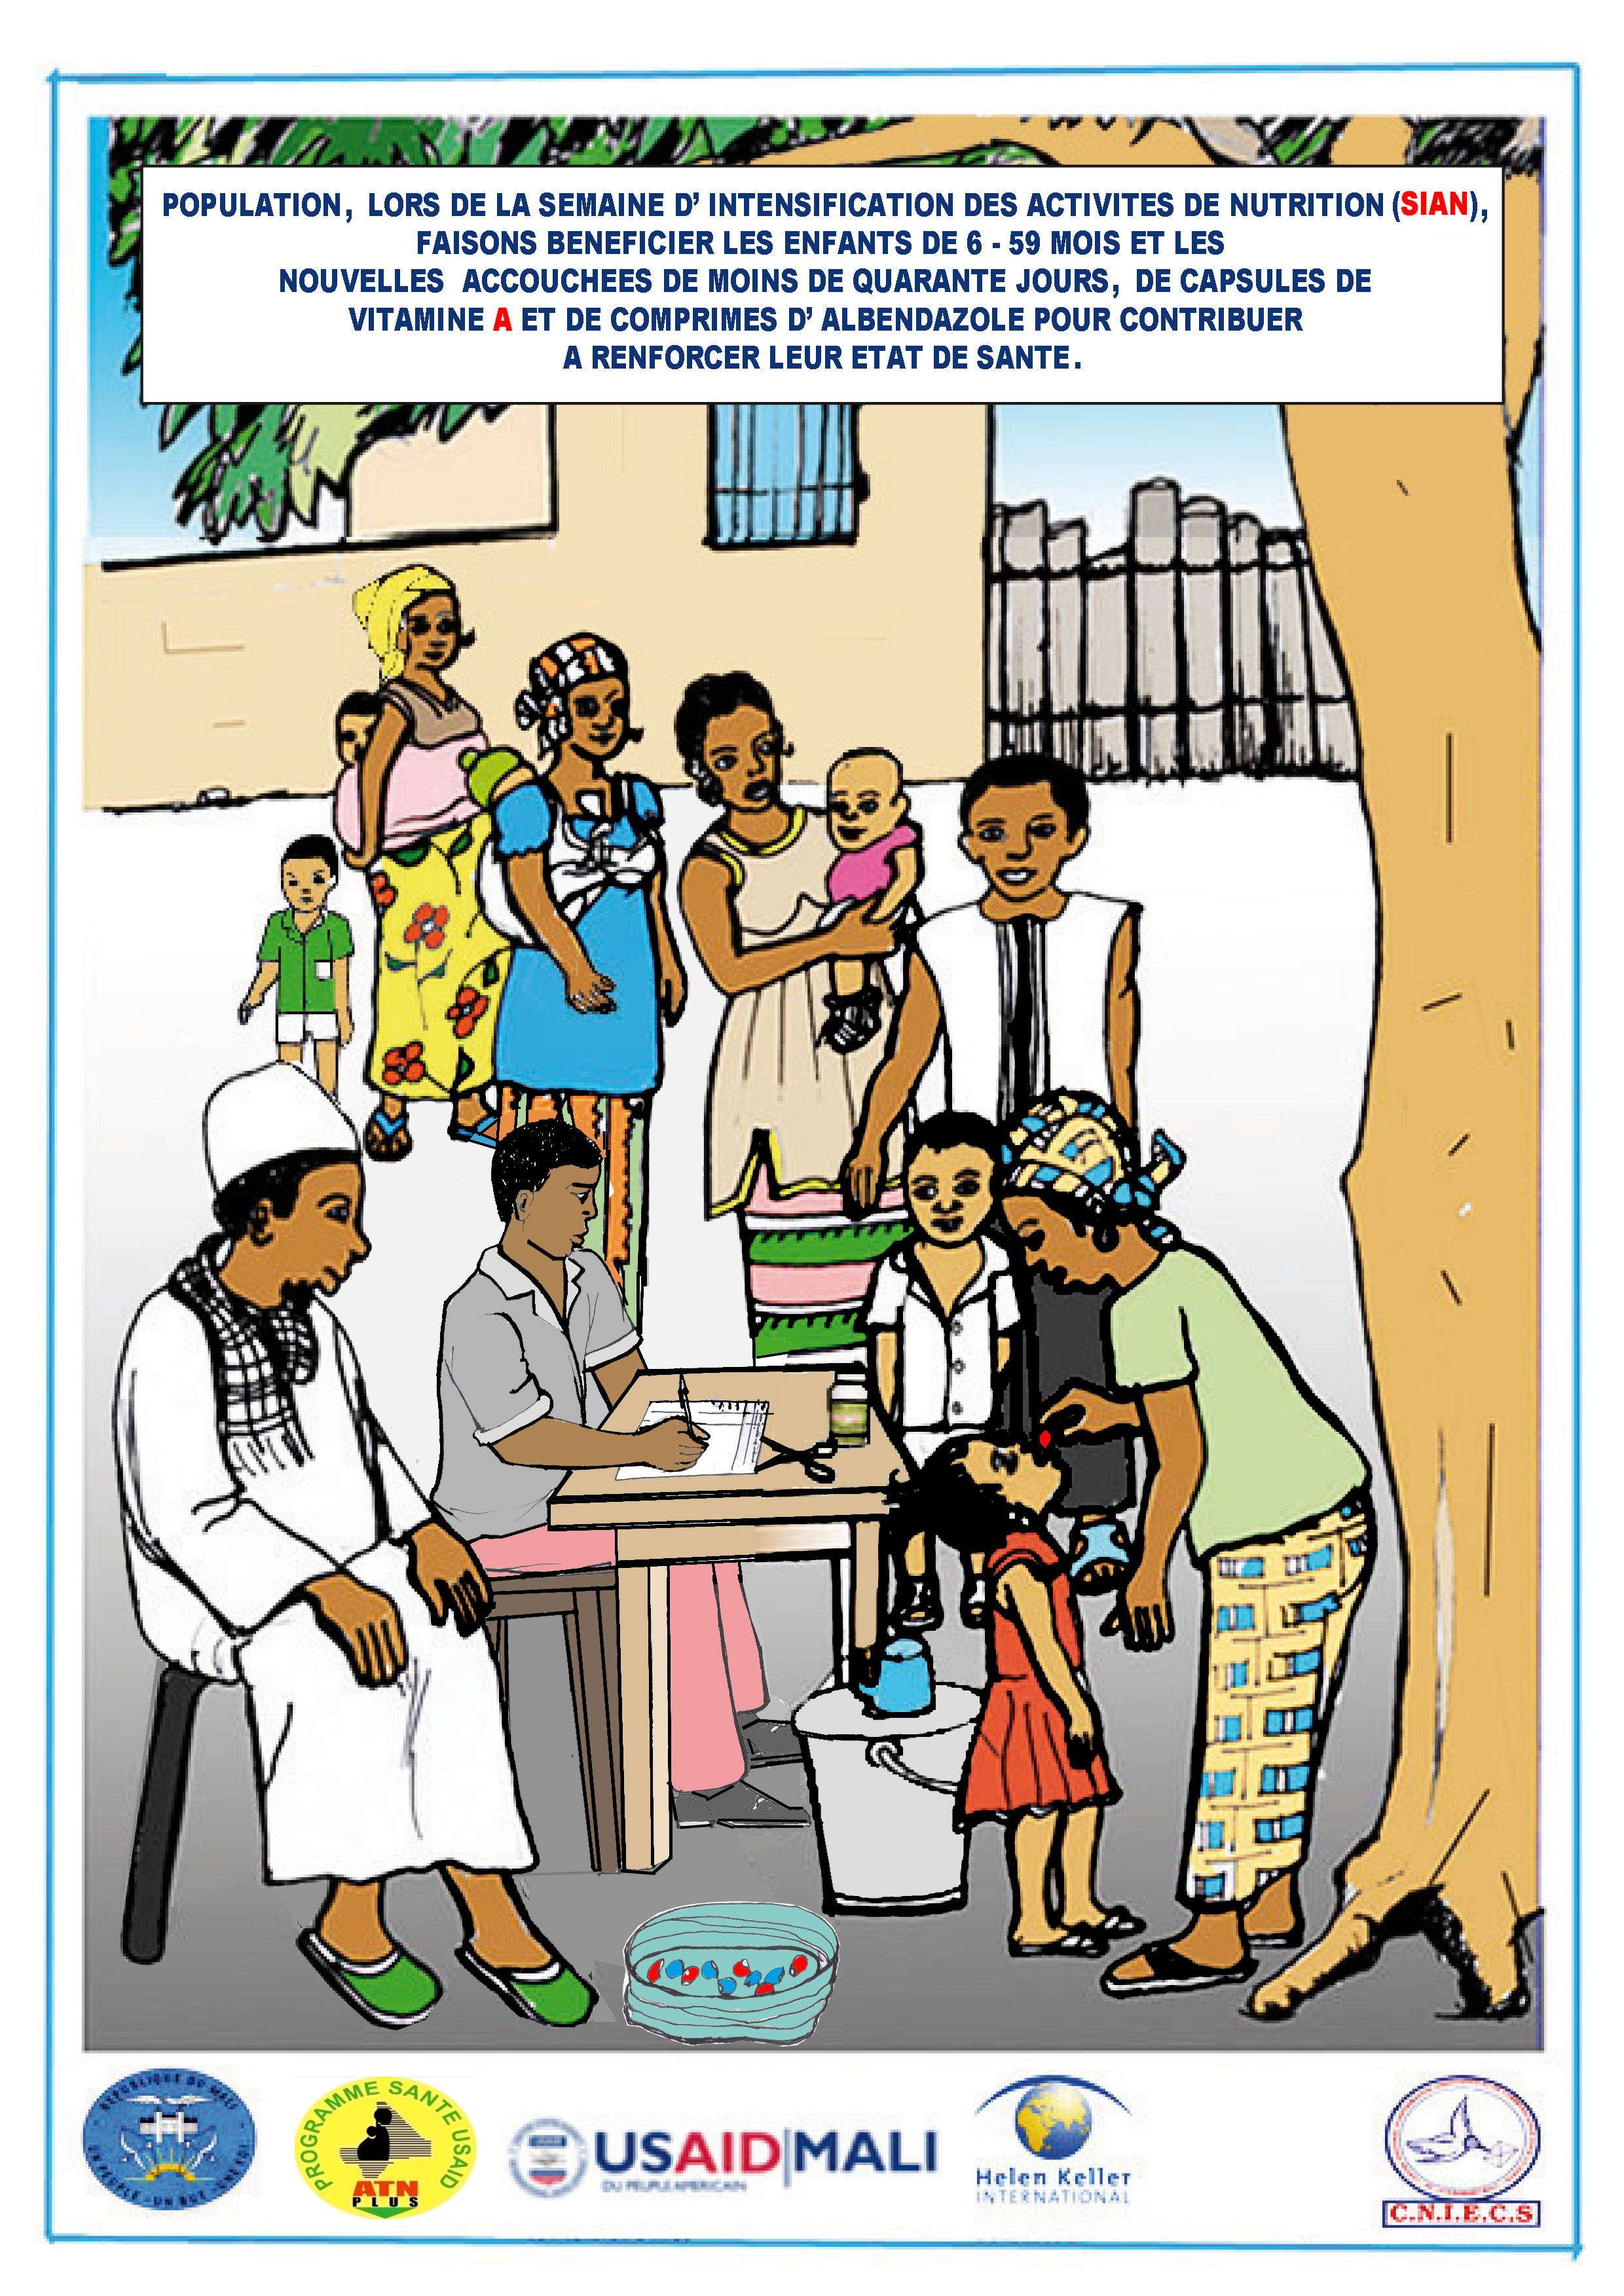
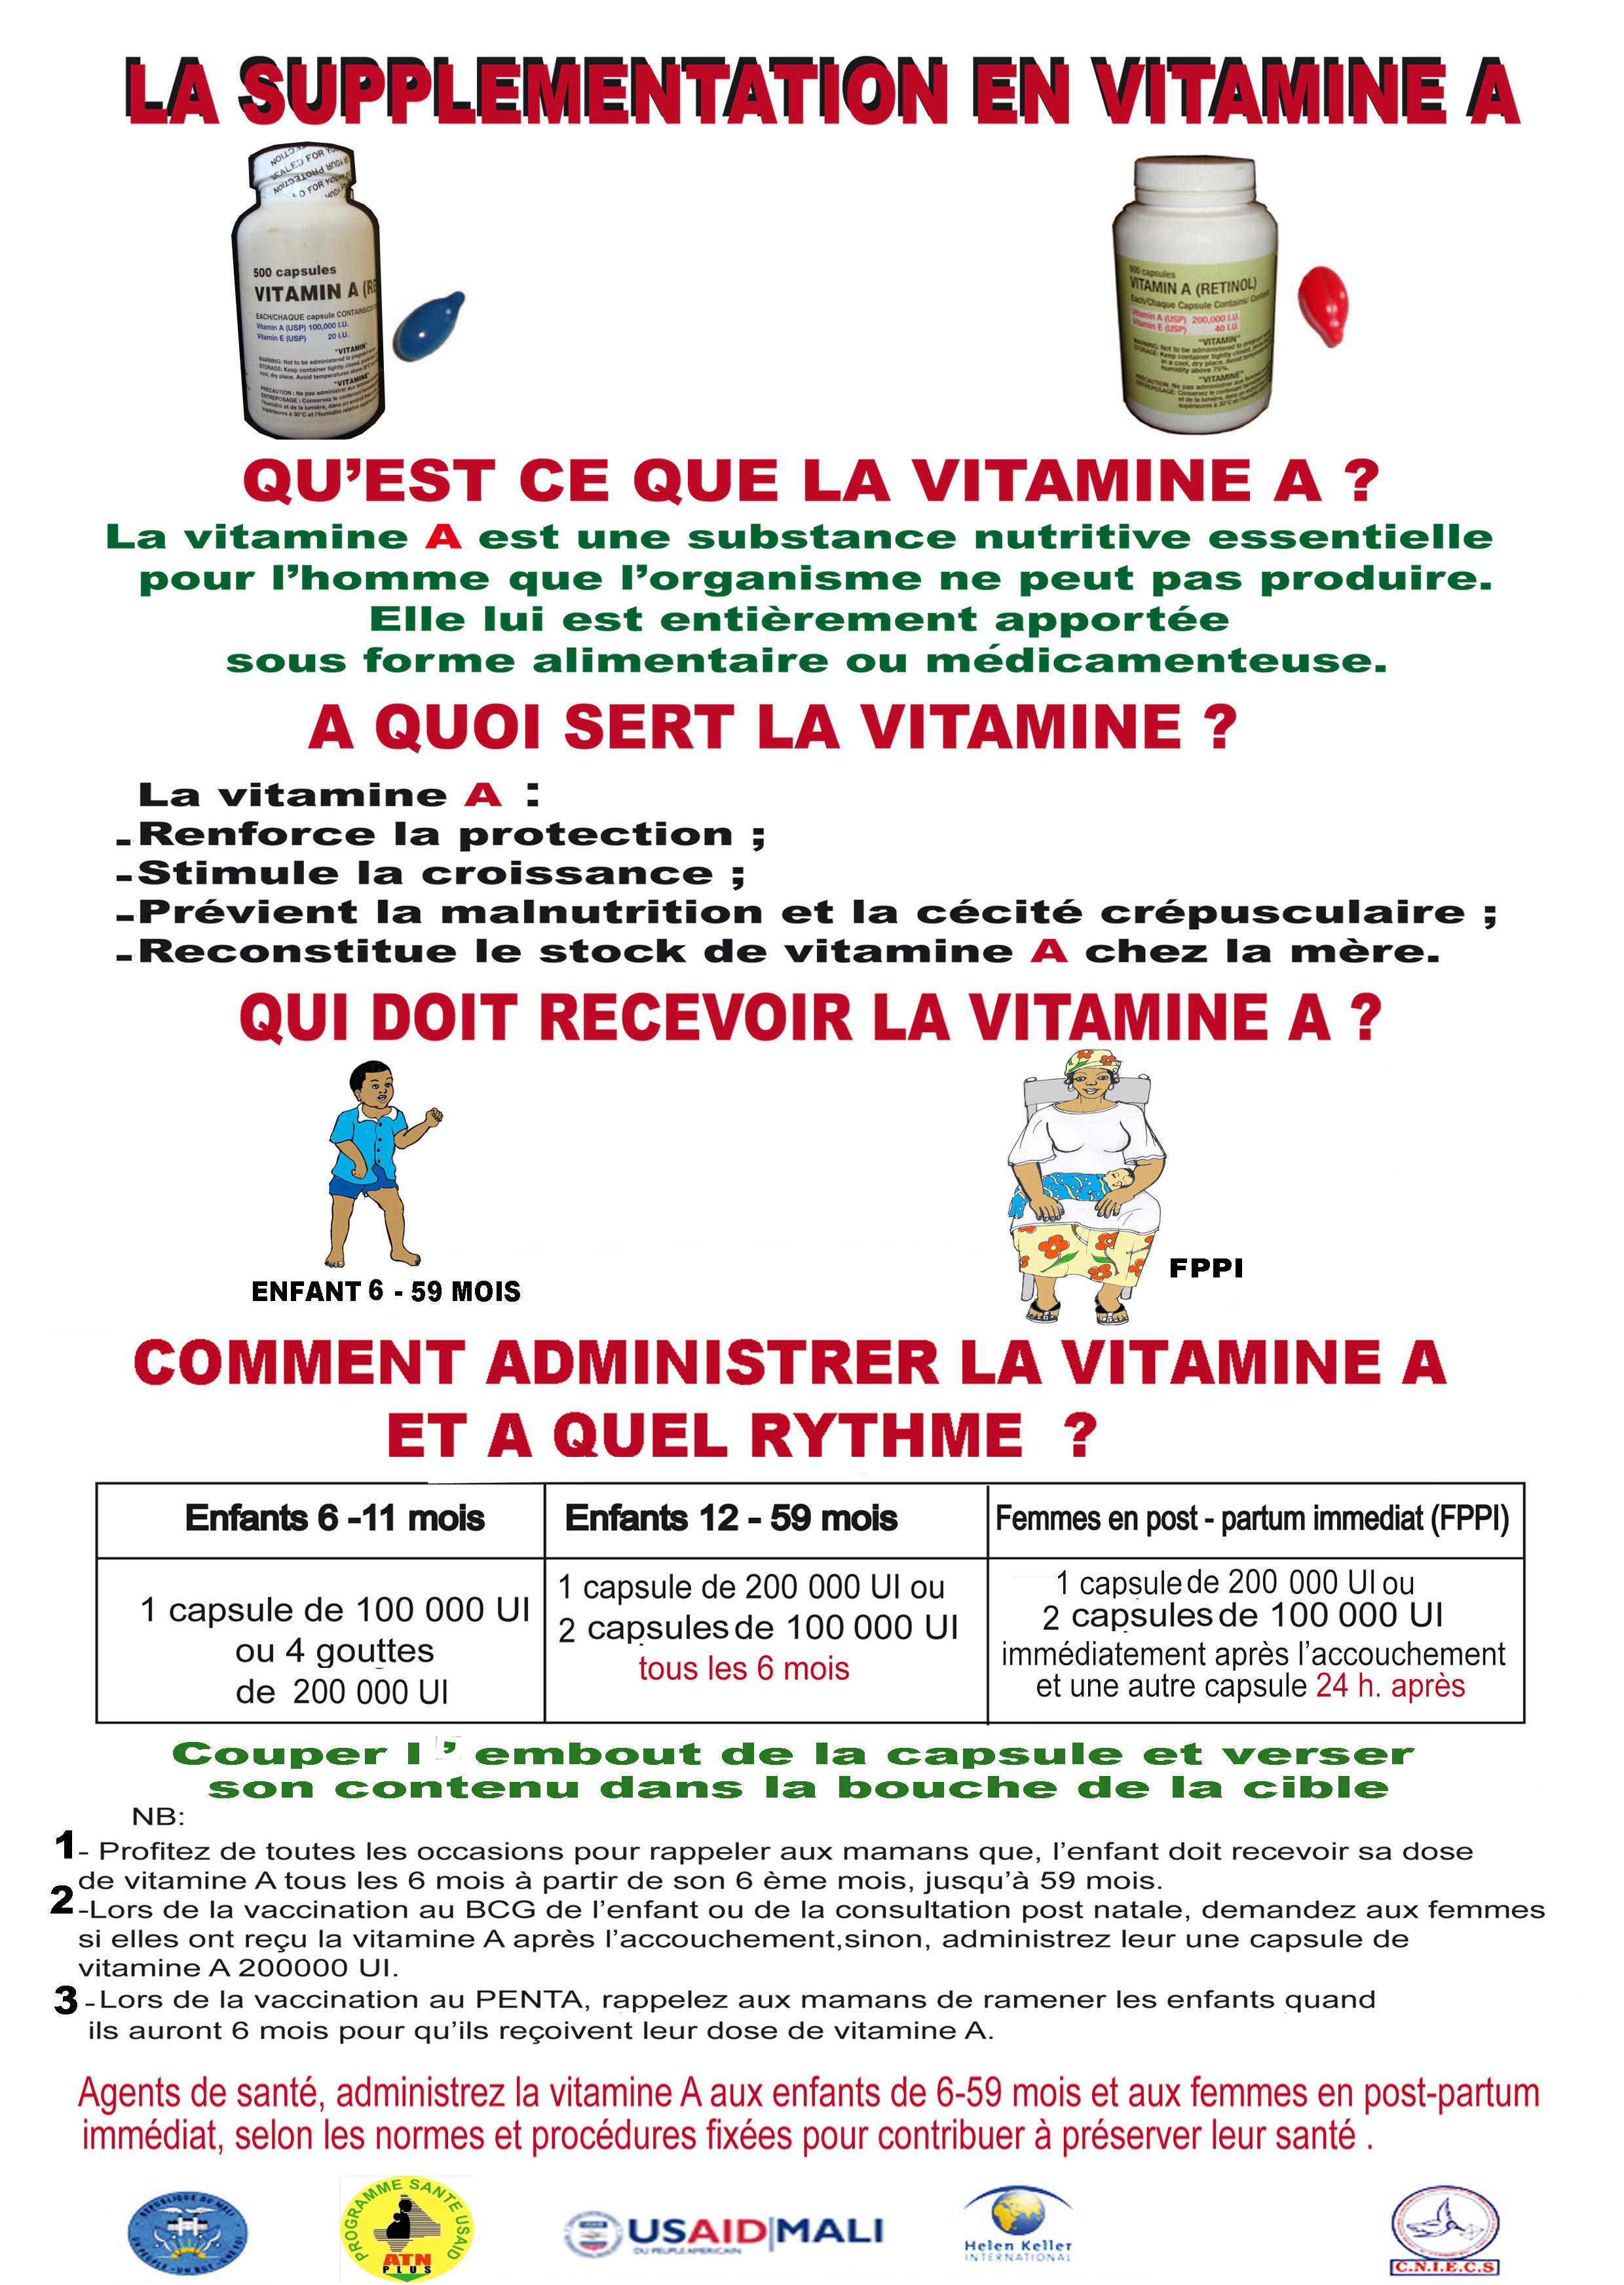
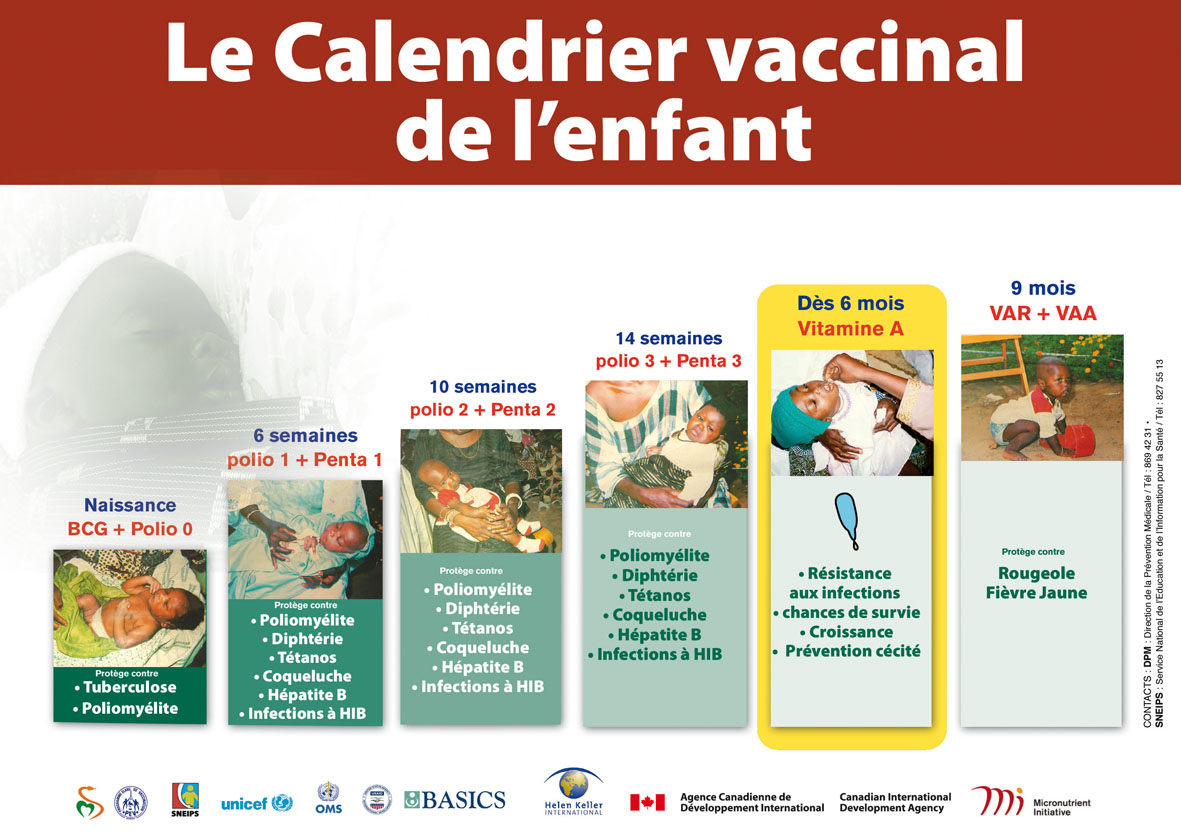
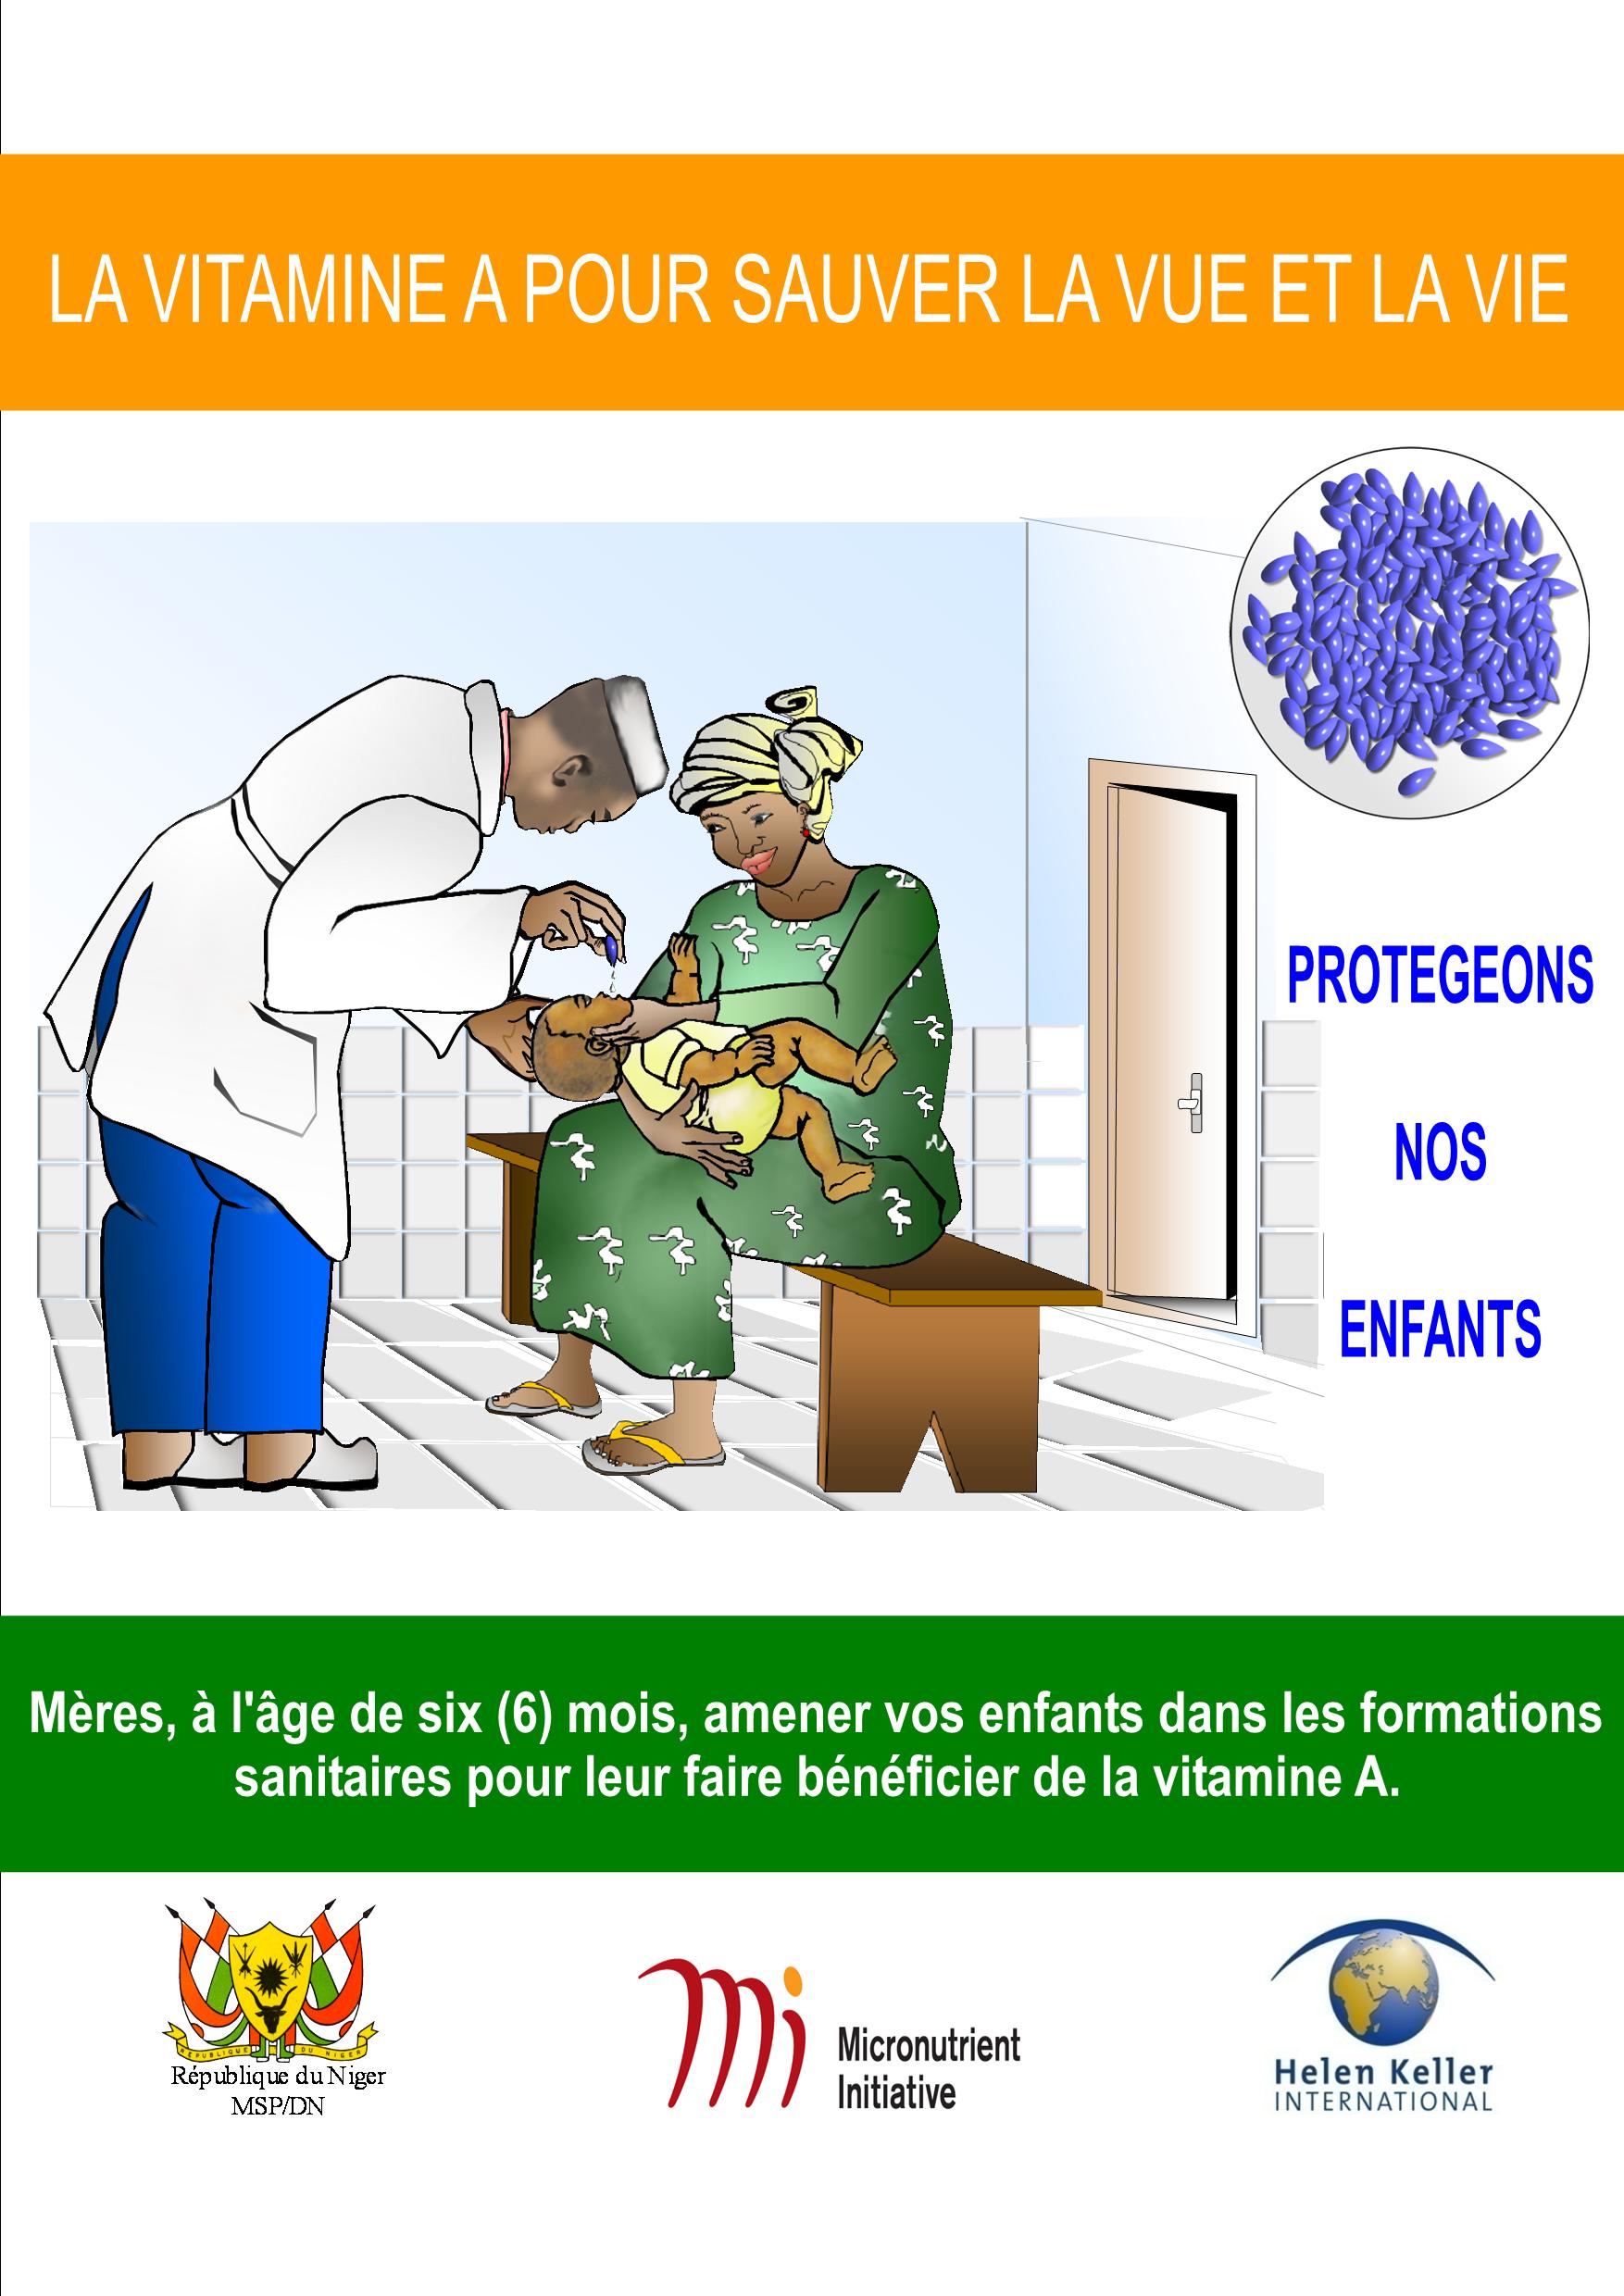
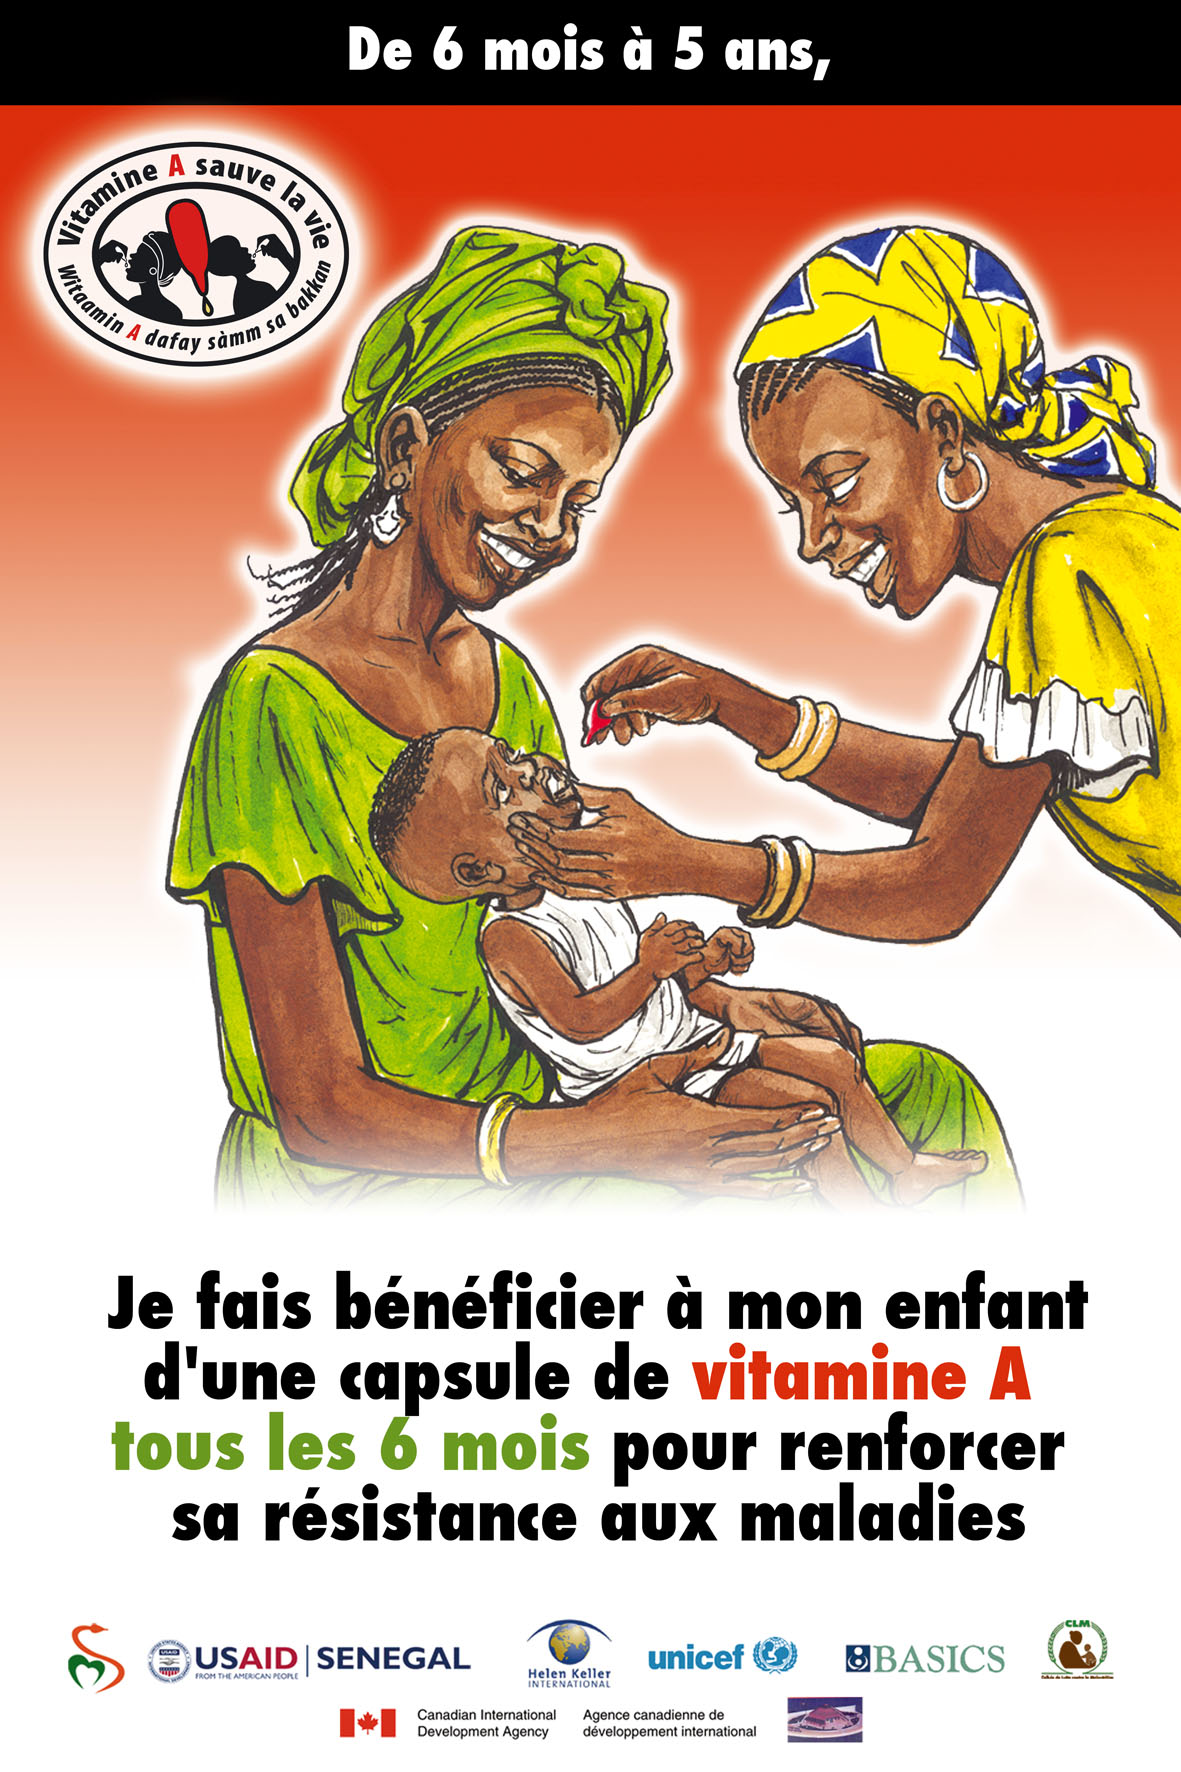
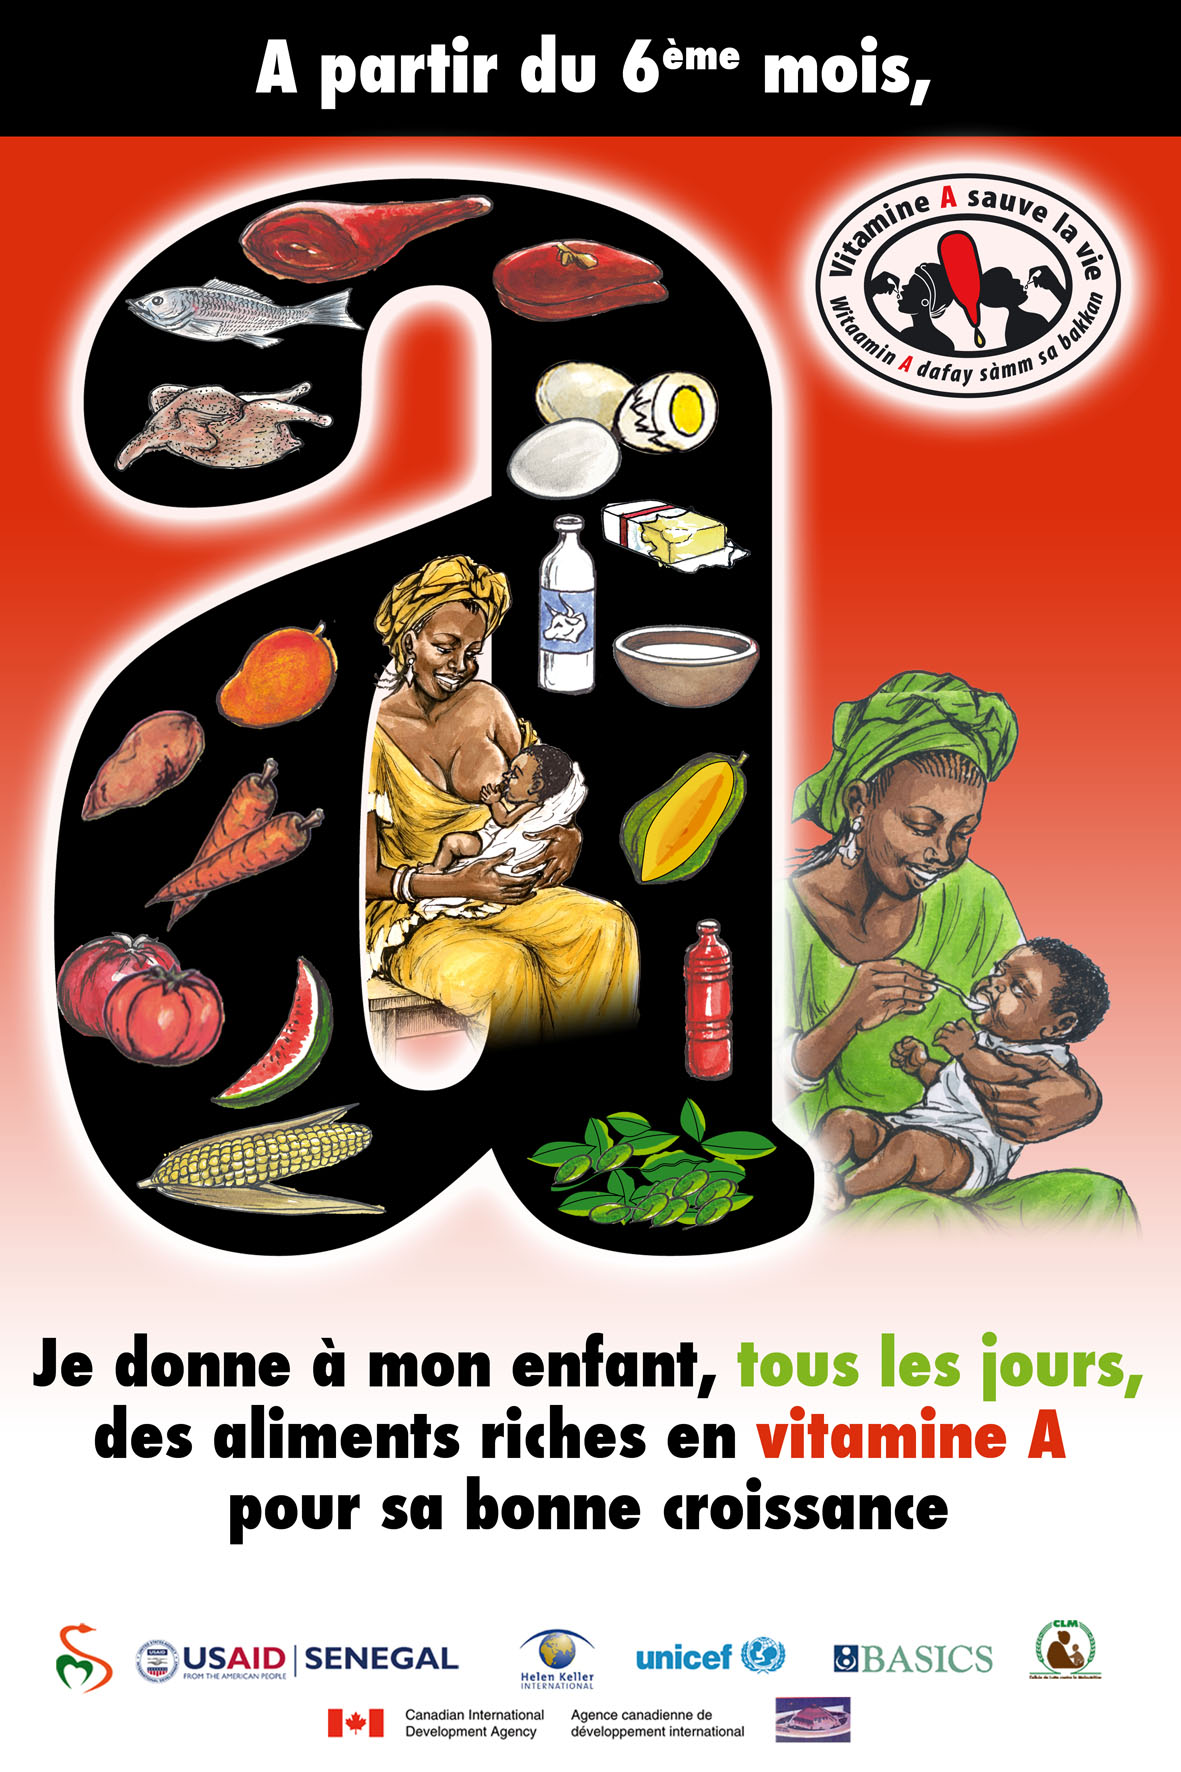
Organization's Response
Helen Keller Intl wrote the following in response to GiveWell's interim review of Helen Keller Intl. We have since updated our review of Helen Keller Intl so the below may not fully be up-to-date.
Published: November 2017
Helen Keller International (HKI) appreciates GiveWell’s invitation to be considered for a top charity recommendation for its vitamin A supplementation program. We have appreciated the transparency and thoroughness of GiveWell’s investigative process thus far. We also appreciate being named a standout charity based on the interim review while GiveWell undertakes additional investigation to determine if HKI qualifies as a top-rated charity.
We would like to offer the following statements in response to points made in GiveWell’s interim review:
- Does vitamin A supplementation (VAS) work? This is an important question and one that has received recent attention considering the shifting epidemiologic and programmatic landscape. The epidemiologic landscape has changed since the first VAS trials were published in the early 1990s. Overall, child mortality rates have declined by 49% since 1990 (Unicef 2014), but the rate of decline has been slowest in Oceania, sub-Saharan Africa and Asia. Likewise, the proportionate cause-specific mortality has also changed. In 1990, the three main killers were pneumonia (21% of under-5 mortality; U5MR), diarrhea (20%), and measles (7%) (van den Ent et al 2011), while in 2010 the main killers were pneumonia (18%), diarrhea (11%) and malaria (7%) (Liu L et al 2012).
There is no question that in contexts exhibiting public health levels of vitamin A deficiency (VAD) and UFMR, VAS (and other interventions that improve the underlying vitamin A status of risk groups) is both sight- and life-saving. This conclusion stems from the results of large, rigorously conducted community trials in South Asia and Africa, which collectively provide incontrovertible evidence that vitamin A interventions, including 6-monthly VAS, reduce early childhood mortality and blindness in undernourished populations (Mayo-Wilson et al 2011). The impact is particularly striking on fatality not only from measles but also from more common diseases such as diarrhea, dysentery and other infectious illnesses. In contexts where uncertainly exists about deficiency and mortality levels (due to the lack of recent data or other reasons) stopping or modifying VAS targets potentially puts children’s lives at risk.
But even in countries with marked mortality declines and changes in causes of death, one cannot rule out a child survival benefit in many contexts. In all, 54 countries globally had a high U5MR (defined as ≥50 per 1000 live births) in 2012 (Unicef 2014). A large proportion of these deaths are caused by infections. Furthermore, in these high-mortality countries VAD is also likely to be high (Schultink 2002), thus reinforcing the need to maintain VAS and other vitamin A interventions. Where U5MR, VAD and infectious disease rates are low, the mortality effect of VAS will likely be reduced. Nevertheless, we must bear in mind two important facts (1) the original VAS studies observed mortality impacts in settings with a wide range of mortality and morbidity rates (Beaton et al 1993), and (2) one cannot rule out the role of VAS in helping to bring down U5MR (Bishai et al 2005; Masanja et al 2008).
- How to think about the Deworming and Enhanced Vitamin A (DEVTA) program evaluation? GiveWell’s report mentions several times the disputed and controversial DEVTA program evaluation study which suffered from important methodological limitations related to supplementation adherence and vital event monitoring systems, as acknowledged by other scientists (Mannar et al 2013; Mayo-Wilson et al 2013; Habicht et al 2013; Sommer et al 2013; Sloan et al 2013). In addition to weighing the methodological flaws of DEVTA, we feel the results of the DEVTA study should be viewed within the context of the larger body of evidence on VAS and child survival. Recently, the WHO examined evidence from all 17 trials (11 in Asia, 5 in Africa and 1 in Latin America) conducted to date for all-cause mortality. Findings revealed that VAS reduces the overall risk of death by 24% (risk ratio (RR) 0.76; 95% confidence interval (CI) 0.69–0.83). When adding the DEVTA findings to the analysis, the all-cause mortality benefit of VAS remained statistically and clinically significant at 12% (RR 0.88; 95% CI 0.84–0.94) (Mayo-Wilson et al 2011)
- The current best evidence indicates that VAD remains prevalent in south Asia and sub-Saharan Africa, but there is a need for more current, reliable and valid estimates of VAD prevalence. GiveWell raises the question, “How prevalent is vitamin A deficiency in areas where HKI works?”. While HKI recognizes the urgent need for updated and valid estimates of vitamin A status in the countries and sub-regions where we work, HKI relies on the best available evidence from scientific sources to ensure that its VAS programs are targeting at risk populations. The most recent global and region-specific estimates of VA deficiency prevalence come from a pooled analysis of population-based surveys from 138 low- and middle-income countries between 1991 and 2013 and published in the Lancet Global Health Journal in 2015. In this publication, the authors estimated the prevalence of deficiency in 2013 to be highest in sub-Saharan Africa (48%) and south Asia (44%) (Stevens et al 2015). Region and country-specific VAD prevalence estimates should be updated as new data become available. Currently, many countries implementing VAS programs have no VAD data or the data do exist are >10 years old (Wirth et al 2017). Clearly, there is an urgent need to fill this data gap and for funders and host-country governments to invest in high-quality surveys to assess VA (and other micronutrient) status and program coverage in children.
- Achieving and sustaining high VAS coverage through HKI’s technical assistance. We provided GiveWell with evidence from two countries (Cameroon and Kenya) which demonstrated that HKI’s technical assistance contributed to significantly higher coverage rates. We appreciate GiveWell’s desire to understand HKI’s added value by assessing VAS program performance using a counterfactual paradigm. Unfortunately, due to the lack of funding in Mali and Cote d’Ivoire in 2017, HKI has been unable to provide VAS technical support to either country providing counterfactual examples. Sadly, both countries missed a VAS distribution round in the first semester of 2017 suggesting that in the absence of HKI’s support the VAS programs in both countries were negatively affected. During their planned country visit, we encourage GiveWell to look further into the added value HKI provides to VAS coverage.
- Cost per supplement delivered and cost-effectiveness of VAS. We feel it is important to note that VAS often serves as the driver behind Child Health Days (CHDs) and Child Health Weeks onto which other vital health and nutrition services (such as deworming, measles immunization, distribution of insecticide-treated bednets, screening for acute malnutrition, and others) are piggy-backed. For example, CHDs delivered nearly half of all global deworming treatments to preschool children in 2013, thus illustrating the strategic importance of this delivery mechanism for attaining high coverage of vital services targeting preschool-age children (Kumapley et al 2015). The design of CHDs and the package of interventions offered can be tailored to the local contexts; and in fragile health systems, CHDs serve as a major delivery platform for high-impact interventions targeted to preschool age children. Because the semi-annual delivery of VAS to preschool children is often the main driver behind CHDs, we feel it is important for cost per supplement delivered and cost-effectiveness models to consider these added benefits. The CHD delivery platform was largely propelled by the need to reach preschool-age children twice each year with a large dose of vitamin A.
- Questions that need more information. HKI appreciates the rigor that GiveWell applies to organizations that are being considered for “top charity” selection. GiveWell’s interim report identifies many remaining questions related to VAS and HKI that it hopes to answer or about which it wants to develop a deeper understanding. Some of these questions will require investments in new data collection. For example, the only way to assess levels of VA deficiency or U5MR in countries or sub-regions where HKI works is to measure these using reliable and valid methods. In low-resource and low-capacity settings, this will require significant investment by the global community and should be done. It is even more difficult to answer the question about the expected child survival impact of VAS given the changing epidemiologic landscape, especially since conducting placebo-controlled trials to address this question would be unethical given the weight of evidence of the benefit of VAS. HKI’s view is to trust the scientific community’s best estimates of benefit based on thoughtful and systematic meta-analyses. HKI keeps abreast of new scientific evidence as it emerges. If and when estimates of benefit are revised, HKI will revise impact expectations and program approaches.
The question of HKI’s added value with respect to VAS programs is, in our view clear. HKI remains a global leader, innovator, advocate and technical support to VAS programs in countries and contexts where VAS should remain a priority intervention. We look forward to GiveWell’s site visits so they can learn more about the important role HKI has provided to VAS programs especially in Sub-Saharan Africa and the support it wishes to continue to provide until the scourge caused by VAD no longer plagues vulnerable populations. VAD will not disappear until vulnerable populations have achieved normal vitamin A status by sustained changes in dietary vitamin A intake. HKI strives to improve the diets through its fortification, nutrition education and food production programs. Until the time when the diets of vulnerable populations are replete with adequate intake of vitamin A, HKI believes periodic high-dose vitamin A has a vital public health role in protecting child health and survival, and thus remains committed to this sight- and life-saving intervention.
References
Beaton GH, Martorell R, Aronson KJ, Edmonston B, McCabe G, Ross AC, Harvey B. Effectiveness of Vitamin A Supplementation in the Control of Young Child Morbidity and Mortality in Developing Countries. Geneva, Switzerland: Administrative Committee on Coordination–Subcommittee on Nutrition (ACC/SCN); 1993.
Bishai D, Kumar K C S, Waters H, Koenig M, Katz J, Khatry SK, West KP Jr. The impact of vitamin A supplementation on mortality inequalities among children in Nepal. Health Policy Plan. 2005 Jan;20(1):60-6.
Habicht JP, Victora C. Vitamin A supplementation in Indian children. Lancet. 2013 Aug 17;382(9892):592.
Kumapley RS, Kupka R, Dalmiya N. The Role of Child Health Days in the Attainment of Global Deworming Coverage Targets among Preschool-Age Children. PLoS Negl Trop Dis. 2015 Nov 6;9(11).
Liu L, Johnson HL, Cousens S, et al. Global, regional, and national causes of child mortality: an updated systematic analysis for 2010 with time trends since 2000. Lancet 2012;379:2151-61.
Mannar V, Schultink W, Spahn K. Vitamin A supplementation in Indian children. Lancet. 2013 Aug 17;382(9892):591-2.
Masanja H, de Savigny D, Smithson P, Schellenberg J, John T, Mbuya C, Upunda G, Boerma T, Victora C, Smith T, Mshinda H. Child survival gains in Tanzania: analysis of data from demographic and health surveys. Lancet. 2008 Apr 12;371(9620):1276-83.
Mayo-Wilson E, Imdad A, Herzer K, Yakoob MY, Bhutta ZA. Vitamin A supplements for preventing mortality, illness, and blindness in children aged under 5: systematic review and meta-analysis. BMJ 2011; 343.
Mayo-Wilson E, Imdad A, Herzer K, Bhutta ZA. Vitamin A supplementation in Indian children. Lancet. 2013 Aug 17;382(9892):594
Schultink W. Use of under-five mortality rate as an indicator for vitamin A deficiency in a population. J Nutr 2002;132:2881S-3S.
Sloan NL, Mitra SN. Vitamin A supplementation in Indian children. Lancet. 2013 Aug 17;382(9892):593. .
Sommer A, West KP Jr, Martorell R. Vitamin A supplementation in Indian children. Lancet. 2013 Aug 17;382(9892):591.
Stevens GA, Bennett JE, Hennocq Q, et al. Trends and mortality effects of vitamin A deficiency in children in 138 low-income and middle-income countries between 1991 and 2013: a pooled analysis of population-based surveys. Lancet Glob Health. 2015;3:e528-e536.
UNICEF. The State of the World’s Children 2014 In Numbers: Every Child Counts. New York 2014.
UNICEF, WHO, Bank W, UN. Levels & Trends in Child Mortality. Report 2014. New York: UNICEF;
2014.
van den Ent MM, Brown DW, Hoekstra EJ, Christie A, Cochi SL. Measles mortality reduction contributes substantially to reduction of all cause mortality among children less than five years of age, 1990-2008. The Journal of infectious diseases 2011;204 Suppl 1:S18-23.
Wirth JP, Petry N, Tanumihardjo SA, Rogers LM, McLean E, Greig A, Garrett GS, Klemm RD, Rohner F. Vitamin A Supplementation Programs and Country-Level Evidence of Vitamin A Deficiency. Nutrients. 2017 Feb 24;9(3).