Our Report
Published: April 2024; Last Updated: January 2025
Summary
What do they do? This review focuses on Helen Keller Intl (“Helen Keller”)’s vitamin A supplementation (VAS) program in sub-Saharan Africa. Helen Keller provides funding to governments to deliver VAS campaigns for preschool age children. It also provides technical support on various aspects of these campaigns including planning, training of distributors, and promoting awareness of the campaign, and conducts monitoring to understand how many children are reached (more).
We recommend Helen Keller Intl’s VAS program as a top charity because:
- We believe that VAS is a highly cost-effective program. (More)
- Helen Keller has a long track record of supporting VAS, which positions it well to carry out and expand VAS programs. (More)
- Transparency—Helen Keller shares significant information about its work with us. (More)
Our main reservations about Helen Keller Intl’s VAS program are:
- While we think it is valuable overall, we have some reservations about Helen Keller’s monitoring. This reduces our confidence that its programs are reaching a high proportion of targeted children. (More)
- We have sometimes found information from Helen Keller hard to interpret. This means that we have not been able to understand differences between the delivery models used in different locations in as much detail as we would like. (More)
This assessment of Helen Keller is based on the following components:
What do you get for your dollar? GiveWell believes that Helen Keller’s VAS program is one of the most cost-effective programs that donors can support. As of February 2024, we estimate that it costs between ~$1,000 and ~$8,500 (varying by country) to avert a death through Helen Keller-supported VAS campaigns. We think VAS is cost-effective because there is evidence that it reduces child mortality and it is very cheap to deliver.
We have a number of uncertainties about the evidence for VAS in general, including whether it is still effective in the context of improved child health since the studies we use in our analysis were conducted and some studies unexpectedly finding small or no effects. See our separate VAS report for more details.
What information has Helen Keller shared on its program? We ask organizations that we fund to share monitoring data and other detailed information on their programs. We use the data as inputs in our cost-effectiveness analysis, and its quality and reliability also inform our overall assessment of the program. For Helen Keller, this includes post-campaign surveys to estimate the proportion of children reached, cost data, and information on other actors’ likely spending on future campaigns in the countries where it supports VAS. (More)
We think this information is valuable overall, and provides some evidence that Helen Keller’s programs are reaching a relatively high proportion of targeted children at low cost. However, we have some reservations that reduce our confidence in it:
- Helen Keller’s surveys have only covered some campaign rounds, and in some surveys only some regions or districts are included. We do not have a strong understanding of why these rounds and locations were selected. Implementers may also know which locations will be surveyed in advance, and have a stronger incentive to ensure high coverage in the surveyed locations. This raises concerns that the monitoring data we’ve seen may not be representative, and that non-surveyed locations might have lower coverage rates. (More)
- Our analysis of Helen Keller’s cost and coverage data suggests a wide variation in costs between different locations where its program operates. We think it’s possible that this is because the cost information we received from Helen Keller was not comprehensive of all costs from other actors contributing to its campaigns, although Helen Keller has also suggested other explanations that we think are plausible. (More)
What is GiveWell’s qualitative assessment of Helen Keller? We make qualitative assessments of our top charities alongside our cost-effectiveness analyses to inform our grantmaking. Overall, our assessment of Helen Keller on most criteria is average, and we have not assessed it as standing out in any dimension (although we see all GiveWell top charities as exceptional relative to the majority of organizations). Factors informing our assessment include (more):
- Our impression has been that Helen Keller is not as concerned as GiveWell about the monitoring issues we identify above.
- Helen Keller has a long track record of delivering VAS, with in-country presence and relationships with ministries of health in many high-priority countries.
- The information Helen Keller has shared with GiveWell is detailed, but we have sometimes found it challenging to fully understand and interpret.
1. What do they do?
1.1 In a nutshell
Helen Keller Intl (Helen Keller) supports programs focused on reducing malnutrition and averting blindness and poor vision in countries in Africa and Asia. It also provides vision screenings and distributes eyeglasses at schools in the United States.1
In this review, we focus only on Helen Keller's vitamin A supplementation (VAS) programs in a set of countries in sub-Saharan Africa where Helen Keller operates with funding from GiveWell donors.2
The World Health Organization (WHO) recommends that children aged 6 to 59 months in areas where vitamin A deficiency (VAD) is a public health problem receive vitamin A supplements two to three times per year to reduce child mortality.3 Helen Keller supports countries' VAS programs mainly by providing funding to support government-run campaigns and providing technical assistance on these campaigns.
1.2 What is Vitamin A supplementation (VAS)?
Vitamin A deficiency (VAD) is a common condition in low and middle income countries that can cause stunting, anemia, and blindness. It can also increase susceptibility to infection and lead to death.4 Deficiency is most common where diets include few animal products and little vitamin A-fortified food.5
Vitamin A supplementation (VAS) involves distributing vitamin A capsules to children aged 6 - 59 months in areas with high rates of deficiency. The World Health Organization recommends that children in high risk settings should receive VAS every four to six months.6
As of February 2024, VAS is one of GiveWell’s top recommended programs. We think VAS is highly cost-effective because:
- There is evidence that VAS significantly reduces child mortality (we estimate ~4% to ~12% in countries where GiveWell supports Helen Keller for VAS).
- VAS is very cheap to deliver (around $1 per capsule delivered).
- In addition to preventing deaths, we think VAS probably provides additional benefits like increased income in later life, vision benefits, and costs averted from treatment of illness.
We discuss the evidence for VAS in detail in our separate report on VAS.
1.3 How VAS distribution works
VAS distributions use one of two main approaches7 :
- Mass campaigns involve large-scale distribution of VAS to households in a short period of time. In these campaigns, VAS is often co-delivered with other public health interventions by community health workers, including deworming, polio vaccination, "mop-up" immunizations (for children who have missed scheduled immunizations), and screening for severe acute malnutrition and moderate acute malnutrition.8 The campaigns we have seen occur twice a year.9
- Routine delivery of VAS involves giving children VAS at primary health facilities and at other touchpoints they might have with the national healthcare system (e.g. during routine immunizations).
Helen Keller supports both kinds of VAS delivery, but focuses on supporting campaigns. The specific delivery model used in VAS campaigns supported by Helen Keller varies by location. The main types of delivery we have seen are:
- Door-to-door campaigns: Community distributors go door-to-door in target communities to deliver VAS to children in their homes. As of February 2024, this is the main strategy used in eight of the 10 countries where GiveWell has funded Helen Keller to support VAS campaigns.10
- Fixed + outreach campaigns: In these campaigns, caregivers bring their children to health centers or other fixed distribution sites to receive VAS (often with a package of other health services). These campaigns are often delivered alongside outreach strategies to inform caregivers that a campaign is happening and encourage them to bring their children to the distribution site.11 As of February 2024, this is the main strategy used in two of the 10 countries where GiveWell funds Helen Keller’s VAS work (Nigeria and Kenya).12
This spreadsheet lists the distribution methods and co-delivered interventions for VAS mass distribution campaigns that Helen Keller supported with GiveWell-directed funding in 2018 through 2021.
Historically, GiveWell asked Helen Keller to use GiveWell-directed funding for mass campaigns only, since we are most confident that campaigns are a reliable way to achieve high levels of VAS coverage.
More recently, Helen Keller has begun experimenting with new delivery models to reduce costs while maintaining high coverage (examples in footnote).13 Helen Keller has also reported that it is planning to transition towards greater integration of VAS in the routine healthcare system in some locations. Our understanding is that this shift has generally been in response to requests from national ministries of health. The most specific example we’ve seen is in Côte d’Ivoire, where Helen Keller reports it plans to gradually transition some districts to a routine-only delivery model (without campaigns) between 2023 and 2027, although we do not have a strong understanding of what this process will involve (details in footnote).14 As of February 2024, we expect this shift could play a role in our understanding of Helen Keller’s VAS program in the future in some locations, but we haven’t yet seen evidence to know how significant a change this will be.
Other relevant information about how VAS distributions work:
- VAS has often been “piggybacked” onto existing public health campaigns, and historically polio vaccination campaigns have been a common vehicle for this.15 Our understanding from Helen Keller is that polio campaigns have been decreasing in frequency in recent years16 , and therefore we expect that this will become less common in the future.
- Health workers implementing VAS programs are instructed to cut vitamin A capsules open with scissors and squeeze the contents of the capsules directly into children's mouths.17 Health workers are also instructed to ask caregivers about the age of the child in order to provide the correct dosage of vitamin A: 100,000 IU (international units) for 6-11 month-old infants, and 200,000 IU to 12-59 month-old children.18
1.4 Helen Keller’s role in VAS campaigns
Overview of activities
Helen Keller provides grants to governments to fund the delivery of VAS campaigns (more) and gives technical assistance to assist with various aspects of campaign delivery (more). It also conducts monitoring after campaigns to understand what proportion of children were reached (more) and advocates for the importance of VAS to national governments (more).
In the countries where Helen Keller works, it collaborates with national and regional governments and two other VAS implementing organizations (UNICEF and Nutrition International) to support VAS.19
- National and regional governments manage the VAS campaigns and are responsible for each country’s overall VAS strategy. Our understanding is that the workers implementing VAS programs are employees (or volunteers paid a stipend) recruited by the government, usually referred to as “community distributors”.20 When delivering VAS campaigns, community distributors are usually organized in pairs.21
- Helen Keller, UNICEF, and Nutrition International typically focus on providing funding and technical support for different regions or activities within each country.22 Our understanding is that this process is coordinated in part by the Global Alliance for Vitamin A (GAVA), a forum in which Helen Keller, UNICEF and Nutrition International are the three core partner agencies.23
- The vitamin A capsules used in the campaigns are donated by Nutrition International, using funding from the Government of Canada.24
From 2018 through 2021, Helen Keller supported VAS campaigns in nine countries25 using GiveWell funding. This spreadsheet summarizes the campaign locations, interventions, and methods used in that period. In April 2023, GiveWell also recommended a $6 million grant to Helen Keller to expand its VAS program in Madagascar (more details in our grant page).
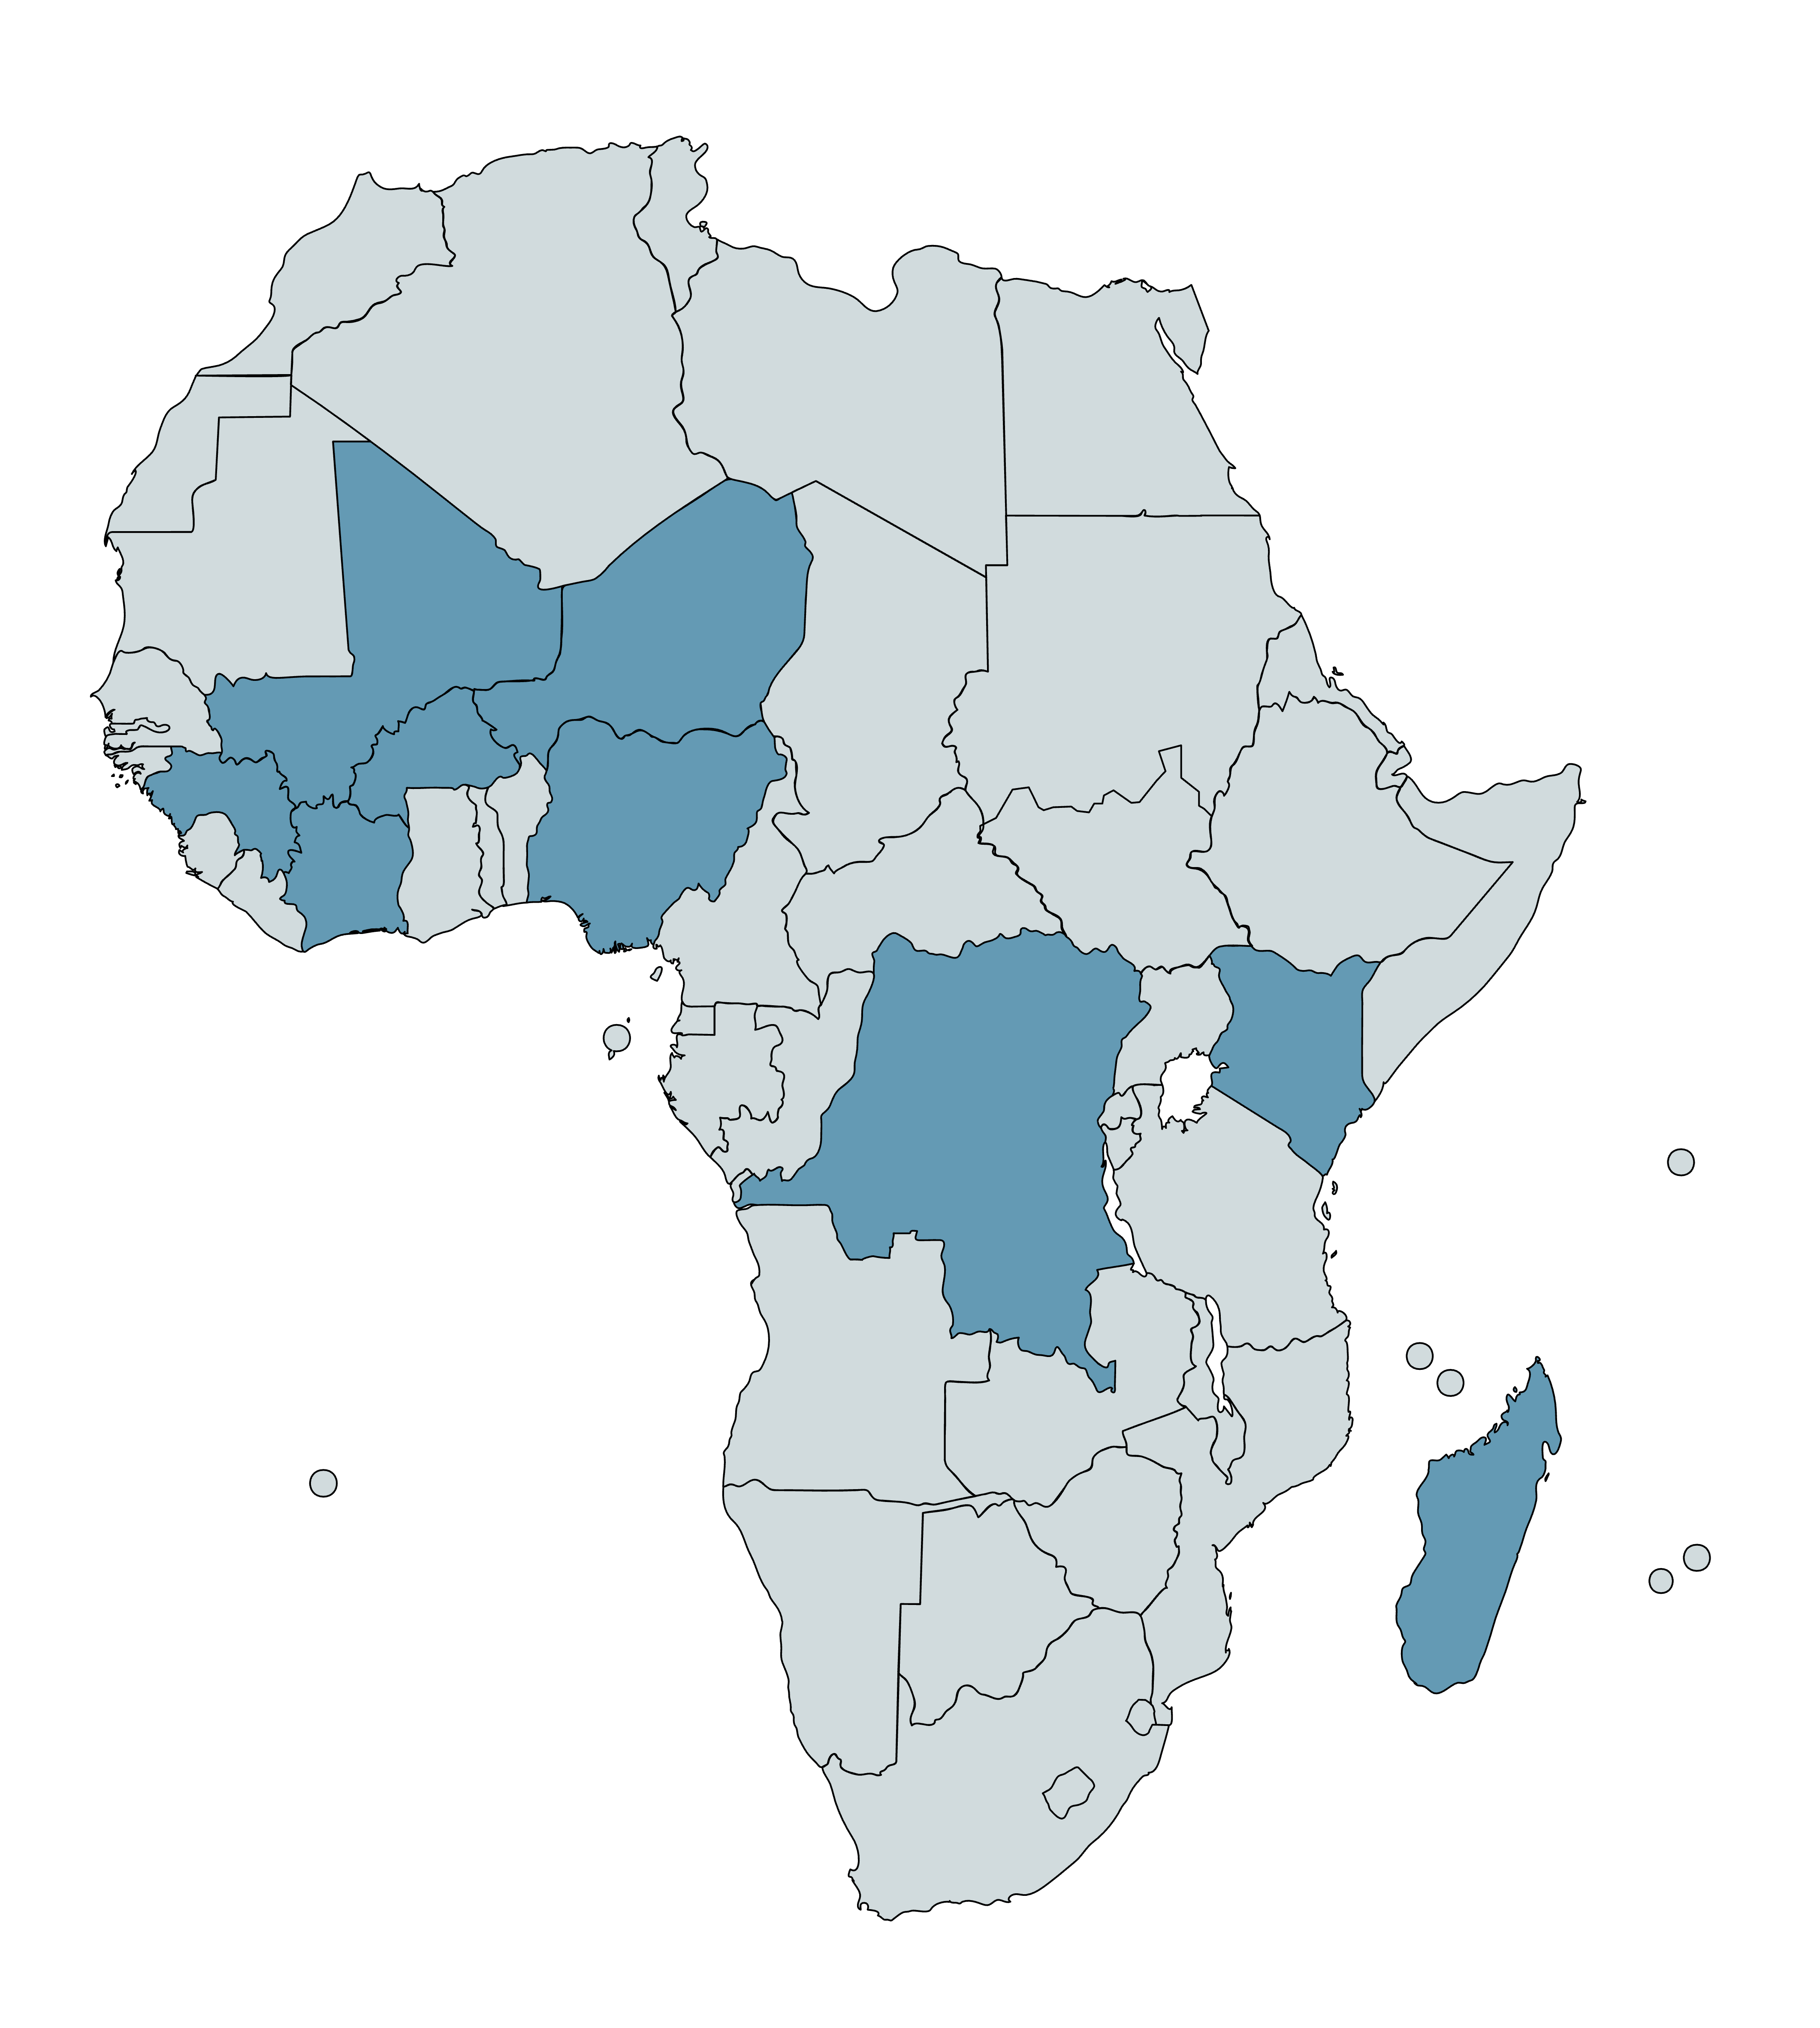
Countries with Helen Keller-supported VAS campaigns between 2018-21, plus Madagascar, are highlighted in blue.26
Funding campaigns
In the specific regions it supports, Helen Keller provides grants to governments (either national or regional) to fund the cost of delivering VAS campaigns.27 The funding is used for various activities needed to deliver the campaign (e.g., training health workers, and health worker per diems), as set out in “sub agreements” that dictate the legal responsibilities of the government and Helen Keller.28 The level of funding and the specific activities covered have varied across countries and over time—see this spreadsheet for a breakdown of Helen Keller’s spending on grants (‘Sub agreements’) from 2018 to 2021, by country.
Technical assistance
Helen Keller provides technical assistance to national and local governments to support the effective delivery of campaigns.29 Our understanding is that this assistance has taken different forms in different locations and over time, although we don’t have a strong understanding of exactly which activities Helen Keller has conducted in each location. Activities include:
- Micro planning: Helen Keller reports that it works with governments to develop “micro plans” approximately six weeks before campaigns take place. These contain plans for the target populations, staffing requirements, logistics processes, and other operational aspects of the campaign.30
- Training: Helen Keller works with national and local health authorities to coordinate and deliver the training for VAS campaigns. Our understanding is that this usually takes the form of a training of trainers (TOT) model, with Helen Keller training supervisors at a national level, who cascade the training down to district health management teams, health workers, and the community distributors who deliver the campaigns. Helen Keller’s role also includes developing and editing training tools, building on lessons from previous campaigns.31
- Social mobilization: Helen Keller conducts (and/or funds the health authorities to conduct) several activities to promote upcoming campaigns. These activities usually last for 5 days, beginning 3 days before the start of a campaign and running into the first 2 days of the campaign. Helen Keller reports that the mobilization campaigns used vary by country, but can include radio, town criers, banners and posters, and communication with traditional and religious leaders.32
Monitoring and evaluation
Helen Keller conducts monitoring to assess whether campaigns are being conducted effectively and reaching children as intended. The monitoring we have engaged with are its post-campaign coverage surveys to understand what proportion of children were reached with VAS. See the section below for a detailed discussion of these surveys.
Helen Keller also reports that it funds independent monitors to assess whether distributors are reaching all the locations they are supposed to reach, and supervision activities (jointly delivered with teams from national and local health authorities) to monitor progress during the campaign (details in footnote).33 We have not engaged with these processes in detail and we do not have a strong understanding of what kind of information they produce.
Advocacy
Helen Keller encourages national governments to prioritize budgeting for and implementing VAS mass campaigns,34 and advocates for routine distribution of vitamin A supplements through health facilities.35
1.5 Helen Keller’s spending on VAS campaigns
Helen Keller's work on VAS campaigns in 2018 through 2021 was primarily funded by GiveWell-directed funding.36 This spreadsheet contains a summary. In short, in 202137 :
- Helen Keller spent a total of $15.1 million on VAS campaigns, up from $7.6 million in 2020 and $5.8 million in 2019.38
- By location, Helen Keller spent between roughly $1 and $2 million each in Burkina Faso, Cameroon, Côte d'Ivoire, the Democratic Republic of the Congo (DRC), Guinea, Kenya, Mali, Niger, and Nigeria.39
- By category, Helen Keller spent around 42% on grants to governments for program implementation ("sub-agreements"),40 50% on direct program costs (including campaign logistics, training, monitoring, personnel, travel, equipment, and supplies), and 8% on overhead costs.41
- Helen Keller also spent $0.5 million on delivery of VAS through approaches other than campaigns: around $100,000 to $200,000 per country in Cameroon, Senegal, and Sierra Leone.42
2. Monitoring and information sharing
2.1 Overview
GiveWell asks organizations that we fund to share detailed information on their programs. The aim of reviewing this information is to assess how much the program costs, whether the program is being conducted to a high quality, and whether it is reaching recipients as intended. We use data from these reviews as inputs in our cost-effectiveness analyses, and the quality and reliability of the information we’ve seen also inform our qualitative assessment of the program.
Helen Keller has shared detailed information that we use to evaluate its VAS program including:
- Monitoring data from previous campaigns, to estimate the proportion of children reached (more).
- Information on costs incurred on previous Helen Keller-supported campaigns (both Helen Keller’s and other actors’) (more).
- Information on other actors’ likely spending on future campaigns in the countries where Helen Keller supports VAS (more).
Overall, we think the information we have seen provides some evidence that:
- Helen Keller-supported campaigns are reaching a reasonably high proportion of children. The median reported percentage of children reached for Helen Keller’s previous campaigns is 85% (more).
- Helen Keller-supported campaigns are being delivered at low cost. Based on data on the proportion of children reached and the cost information that Helen Keller shares, we estimate that it costs around $1 in total (including both Helen Keller spending and other actors’ spending) to deliver each VAS capsule to a child in Helen Keller-supported campaigns (more).
- Helen Keller’s funding would probably not have been fully replaced by other actors in Helen Keller’s absence. As of February 2024, we roughly estimate that there is approximately a 20% - 45% chance (varying by country) that Helen Keller’s VAS funding would have been replaced by other actors (national governments and/or other NGOs) in Helen Keller’s absence. We adjust our cost-effectiveness analysis to account for the likelihood that Helen Keller’s funding is causing other actors to spend more or less on VAS than they otherwise would (more).
We have some reservations about this information that somewhat limit our confidence in it. We think that its main shortcomings are:
- Lack of comprehensive or fully representative monitoring. VAS campaigns take place twice a year, but Helen Keller normally only conducts post-campaign coverage surveys after one campaign round in each country (and sometimes only in certain regions or districts). This is a concern because our best guess is that VAS coverage is likely to be lower in campaigns without coverage surveys than those with them, and that surveyed areas may not be representative. We account for this with a downward adjustment in our cost-effectiveness analysis of -17% (as of February 2024). This is a rough guess. (More).
- Possible lack of information on costs from other actors. We think that our estimates of the cost per supplement delivered in some countries are implausibly low. Our best guess is that this is because some other actors’ costs are not included in our analysis, although Helen Keller has also suggested reasons that we think are plausible. We therefore do not use our cost estimates from these countries in our analysis. We use an average cost per supplement figure from across other countries in our analysis instead (more).
- Limited results from supervisor audit procedure. Helen Keller surveys use an audit procedure, where a sample of households are re-visited by supervisors to check their responses against the original data. We think this procedure is a methodological strength, because it allows Helen Keller to check the accuracy of the data and because it is likely to encourage more accurate data collection. The results from this procedure that we have seen (based on a shallow review only) have been promising, but only about half of the coverage surveys report we reviewed in 2021 and 2022 reported results from the procedure (more).43
- Relatively non-detailed information on other actors’ likely future spending. While Helen Keller shares some information about other actors’ likely spending on future campaigns in the countries where Helen Keller supports VAS, this is less detailed than the information we have seen for some other programs. As a result, we think of our adjustments for other actors’ spending as very rough guesses (more).
2.2 Monitoring and evaluation
Overview
Helen Keller conducts coverage surveys to determine what proportion of children received VAS in previous campaigns. We use this data to understand whether the program is reaching children as intended, and as part of our estimates of the costs to deliver each capsule of VAS (discussed in our separate report on VAS).
Comprehensiveness
This spreadsheet contains all the results we have seen from coverage surveys of previous Helen Keller-supported VAS campaigns. We have reviewed coverage surveys from 2018 (the year Helen Keller began supporting VAS with GiveWell-directed funds) through 2021. We have also reviewed some surveys from 2022, although these are not comprehensive because not all 2022 surveys were available at the point we updated our analysis.44
Overall, the surveys we have seen in this period were for campaigns that represent approximately 54% of Helen Keller's total spending on VAS campaigns in 2018 - 2021.45 While this constitutes substantial evidence for the impact of Helen Keller's VAS campaigns, we note that these surveys are not comprehensive. This is a concern because our best guess is that VAS coverage is likely to be lower in campaigns without coverage surveys than those with them:
- Helen Keller usually conducts monitoring for only one of the two campaign rounds it delivers per country per year.46 Our understanding from Helen Keller is that VAS implementers may be aware of which campaign rounds will be surveyed in advance of the campaign.47 This raises a concern that implementers would be more incentivized to ensure high coverage in surveyed campaigns than non-surveyed campaigns (which have less oversight). This could result in overall coverage estimates being biased upwards.
- In some of Helen Keller’s surveys, only certain regions or districts are surveyed.48 We do not have a good understanding of how these specific regions or districts are selected, and what factors are used to determine this.49 This raises a concern that surveyed locations are not nationally representative, and therefore are not an accurate guide to measuring coverage. If VAS implementers know which locations will be surveyed in advance, they may also be more incentivized to ensure high coverage in surveyed compared to non-surveyed locations (the same concern as for non-surveyed campaign rounds discussed above). Helen Keller has previously told us about one example of managers dedicating extra attention to areas they knew would be surveyed, which increases our concern about this issue.50 Helen Keller has told us it is planning to pilot an approach in some locations whereby implementing teams will not know in advance whether a coverage survey will be conducted in their area,51 which we expect to mitigate this concern to some degree.
- We have heard feedback from Helen Keller that, in countries which have rainy seasons, its monitoring surveys tend to take place in the non-rainy season.52 This raises a concern that, if coverage is lower during campaigns conducted in the rainy season (e.g., because roads are flooded and some communities are harder to reach), the results we see may be systematically overestimating coverage.
As of February 2024, we account for these concerns in our cost-effectiveness analysis with a -17% adjustment for the quality of Helen Keller’s monitoring and evaluation (more below). Helen Keller has told us it is planning a change in its approach to improve survey representativeness and (as of November 2023) is actively working on what this will entail.53
One method we could use to corroborate Helen Keller’s monitoring data is to cross reference it with independent survey data (from the Demographic and Health Surveys) on the proportion of caregivers whose children received VAS. As of February 2024, we have begun this work but not yet finalized or published our analysis. We hope to investigate this question in more detail in the future.
Methodology
In Helen Keller's coverage surveys, data collectors visit a sample of households and ask household members whether the eligible children in those households received VAS during the relevant campaign. We have focused on understanding the methodology used in the coverage surveys conducted for campaigns in 2018 to 2021 that were supported with GiveWell-directed funds. Full details on the methodology used in those surveys are in this spreadsheet (‘Methods’ sheets).
In 2019, Helen Keller developed a revised coverage survey guide,54 with a new sampling methodology.55 Our understanding is that this methodology was used for most of the coverage surveys conducted from 2019 onwards, with exceptions noted in this footnote.56 The remainder of this section focuses on this methodology because it has been most commonly used in recent surveys and because we expect it to be used for the majority of future surveys we will receive from Helen Keller.
Key features of the coverage survey methodology are:
- Respondent selection: Helen Keller's 2019 - 2022 coverage surveys employed two-stage cluster sampling of households in the relevant study area.57
- In each survey, the study area was subdivided into smaller "enumeration areas," which were stratified as either urban or rural and in some cases by an additional quality (e.g., Helen Keller-supported or non-Helen Keller-supported).58 Enumeration areas were then selected randomly, generally with probability proportional to size, from each stratum.59
- Next, data collectors performed a census of all eligible households in selected enumeration areas.60 Census data was sent to the central supervision team, which randomly selected five to 15 eligible households (i.e., households that contained at least one child aged 6-59 months) per enumeration area.61
- We expect this selection protocol to result in a sample that is generally representative of the target population.
- Enumerators were instructed to survey all eligible children in selected households.62 To determine a child's age (and therefore if they are eligible to be surveyed), data enumerators are instructed to ask the child's caregiver for a health card or birth certificate that states the child's birth date. If documentation is not available, data collectors ask caregivers if they remember the child's birth date, and if the caregiver doesn't know the birth date, they ask about local events to estimate when the child was born.63
- If a selected household is unavailable, data collectors are instructed to return up to two additional times to attempt to interview that household.64 In nearly all the surveys we have reviewed, approximately 95% or higher of the targeted number of households were interviewed.65
- Survey design: Helen Keller has developed standard questionnaires,66
which it adapts for use in each country and translates into local languages. Each of the 2019-2021 coverage surveys we have reviewed included a pilot survey, during which questionnaires were tested and updated prior to survey implementation.67
The adaptation, translation, and piloting of questionnaires in each setting increases our confidence that they are administered appropriately and consistently across contexts.
- A potential source of bias in Helen Keller's coverage surveys is their heavy reliance on caregiver-reported responses. The questionnaire used during household interviews instructs data collectors to ask caregivers questions about VAS and other interventions received by children in their household, such as deworming.68 We believe that these responses are at risk of recall bias, as respondents must answer questions about multiple interventions and possibly multiple children. In many cases, the recall period for these responses was relatively short, about one month, while some surveys were conducted two months after the campaign.69 Caregiver-reported responses are also at risk of social desirability bias that could lead respondents to overreport VAS administration if they believe that this is the preferred response of data collectors.
- We would have more confidence in a survey that tested the reliability of reported responses against some objective measure. The questionnaire instructs data collectors to show household members vitamin A capsules and deworming tablets (or photos of these items) when asking questions about these treatments,70 but while these visual aids may improve accurate recall, they are not used to verify responses (for example, by asking respondents to identify these items before they are asked if eligible children received them).
- Survey implementation: Helen Keller contracts with independent consultants that recruit data collectors and supervisors and oversee survey implementation. Generally, data collectors and supervisors were not involved in VAS campaign implementation, though sometimes Helen Keller staff members are involved in survey implementation.71 Helen Keller's coverage surveys from 2019 to 2022 (we have not reviewed more recent surveys) included an auditing procedure in which supervisors were instructed to randomly select and then re-survey 10% of households in order to assess the accuracy of initial results, to which they were blinded.72 We see the inclusion of such a procedure as a methodological strength, both because it may encourage accurate data collection and because it provides a check on the accuracy of results. Generally speaking, the results from this procedure that we have seen (based on a light-touch review only) have found similar VAS coverage to the initial results and high correspondence (% agreement) between the audited data on VAS coverage and the main results (90+% correspondence). Correspondence on other audited measures (e.g., child age) has tended to be somewhat lower (~80% to ~100% depending on the measure and survey).73 These results generally increase our confidence in the accuracy of the data, although we have some open questions we have not fully investigated (details in footnote).74 However, not all coverage surveys have reported these results consistently—five of the nine surveys we reviewed in 2021 and 2022 reported audit results (of which only three reported correspondence), and four did not.75 Helen Keller has informed us it will include results from these audits in all future coverage survey reports.76
- Data capture: Data was collected electronically.77 One concern we have about coverage surveys in general is that data may be lost after being collected or that errors in aggregation at each level may be introduced. Electronic data collection enables data to be checked and aggregated centrally. We would guess that this reduces the chance of significant data loss or errors in aggregation, although we haven’t seen data on the proportion of data lost in Helen Keller’s surveys.
Detailed results
Overall, in coverage surveys we have reviewed from 2018 - 202278 :
- The median coverage rate for campaigns that were supported by Helen Keller using GiveWell-directed funds was 85%.79
- The lowest campaign coverage rate was 61%, from a VAS campaign in 2019 in a county in Kenya supported by Helen Keller.80 The highest campaign coverage rate was 94%, from the first VAS campaign of 2019 in six regions of Niger supported by Helen Keller.81
- Coverage rates for 66% of 2018-2022 campaigns with surveys were above 80%,82 which is the coverage rate targeted by Helen Keller for its VAS campaigns.83
See the “Coverage” sheet of this spreadsheet for a detailed breakdown of the data by country, year, and specific survey.
How Helen Keller’s monitoring informs our cost-effectiveness analysis
We use the data collected in Helen Keller’s coverage surveys in two ways in our cost-effectiveness analysis:
- As an input to calculate the cost per supplement delivered. We use estimates of the proportion of children reached in each country, alongside estimates of target populations of children aged 6 - 59 months and information on campaign costs (discussed below) to estimate the average cost to deliver one capsule of VAS to a child in Helen Keller’s campaigns.84 We discuss our approach in detail in this section of our report on vitamin A supplementation.
- Adjustment for quality of monitoring and evaluation. Although we think that Helen Keller's coverage surveys provide some evidence that a high proportion of the target population has been reached with VAS, our best guess is that the headline reported coverage figures are inflated because of the concerns we identify above. To account for this, we incorporate a -17% adjustment in our cost-effectiveness analysis. This figure is based on a rough percentage best guess of the impact of the concerns we have identified rather than an explicit model (reasoning in footnote).85
2.3 Cost data for Helen Keller-supported campaigns
Helen Keller has shared data on campaign costs incurred for each of the campaigns it has supported with GiveWell funding between 2018 and 2021. This includes costs incurred by Helen Keller itself (available here) and costs incurred by other actors (e.g., national governments, other NGOs) on these campaigns (available here).
We use this data (alongside estimates from the coverage surveys discussed above, and estimates of the target population of 6 - 59 month olds in locations where Helen Keller supports campaigns) to estimate the average cost to deliver one capsule of VAS to a child in Helen Keller’s campaigns. See this section of our report on vitamin A supplementation for a detailed discussion of our method and this spreadsheet for our calculations.
In summary:
- As of February 2024, we estimate that it costs approximately $1 to deliver a vitamin A capsule to a child in Helen Keller-supported programs (varying by country, from $0.80 in Mali to $1.39 in Guinea).86
- Our main uncertainties about the data we have seen are:
- Lack of information on other actors’ spending in some countries. Other actors (ministries of health, NGOs) also support VAS in the countries where Helen Keller works. We aim to incorporate all spending by these actors on Helen Keller-supported campaigns (based on cost data shared by Helen Keller), but these costs may not be comprehensive and we do not have an easy way to know how comprehensive they are.
- One reason to think we may be undercounting costs in some locations is that we calculate surprisingly low cost per supplement estimates (varying between $0.53 and $0.72) for Helen Keller-supported programs in Côte d’Ivoire, DRC, Kenya, and Nigeria. Although Helen Keller’s program in Kenya and Nigeria uses a fixed site delivery model (which we think could contribute to lower costs), we don’t know if this would explain the very significant cost differences (and cannot explain the surprising cost estimates in Côte d’Ivoire and DRC). Our best guess is that these figures are too low to be plausible, and one reason they are so low may be that some other actors’ costs are not included in our analysis,87 although Helen Keller has suggested reasons for these lower costs that we also think are plausible (details in footnote).88 Because of our uncertainty, we use an average cost per supplement figure of $1.02 (the weighted average of all other countries’ cost per supplement in our analysis) for these four countries.89 This is a somewhat conservative assumption, because there may be reasons that costs are lower in these countries. We plan to revisit this question in the future to understand what could be driving the differences in each location.
- Target population data. Our estimates of the number of children reached with VAS are based on data on the number of children aged 6 - 59 months in regions with Helen-Keller supported campaigns.90 Our understanding is that these figures are provided to Helen Keller by governments. We have not investigated this data in detail, and it is possible that these estimates are unreliable or outdated. In August 2022, we commissioned IDinsight to interrogate the target population estimates we use for Helen Keller's VAS program and others. As of this writing in February 2024, we have received the results from this work but have not yet concluded how they should affect our analysis or published the findings.
- Coverage estimates. In addition to cost data, our cost per supplement calculations also rely on estimates of the proportion of children reached from Helen Keller’s monitoring surveys. If these are inflated because of the concerns we identify above, we could be underestimating the true cost per supplement delivered.91
- Lack of information on other actors’ spending in some countries. Other actors (ministries of health, NGOs) also support VAS in the countries where Helen Keller works. We aim to incorporate all spending by these actors on Helen Keller-supported campaigns (based on cost data shared by Helen Keller), but these costs may not be comprehensive and we do not have an easy way to know how comprehensive they are.
2.4 Information on other actors’ VAS contributions
Helen Keller shares information with GiveWell about what other actors (e.g., national governments and other external VAS partners) have contributed (in previous campaigns) and are likely to contribute (on future campaigns) in countries where Helen Keller also supports VAS.92 This is distinct from the information on other actors’ costs on past Helen Keller-supported campaigns (discussed above). It relates to other actors’ spending in a whole country, not just on campaigns co-funded with Helen Keller, and includes future campaigns as well as previous campaigns.
We find this information valuable because we adjust our cost-effectiveness analysis to account for the likelihood that Helen Keller’s VAS funding is causing other actors to spend more or less on VAS than they otherwise would.
Overall, the information we have seen gives us some confidence that other actors would not fully be able to replace Helen Keller’s funding for VAS campaigns in Helen Keller’s absence (details in footnote).93 This in turn increases our confidence that Helen Keller’s spending results in a genuine increase in the number of children reached with VAS. As of February 2024, we roughly estimate that there is approximately a 20% - 45% chance (varying by country, from 20% in DRC to 45% in Guinea) that Helen Keller’s funding for VAS campaigns would have been replaced by other actors (national governments and/or external partners) in Helen Keller’s absence.94 This reduces our cost-effectiveness estimates by 18% (DRC) to 37% (Guinea).95 Intuitively, the reason that this is a significant negative adjustment is that we think there’s a substantial chance that the impact of Helen Keller’s funding is simply to free up other actors’ funding for other activities that we think are probably less cost-effective.
See this section of our separate report on VAS for more details on how we calculate these adjustments.
Our main reservation about the information Helen Keller shares about other actors’ likely spending is that it includes a relatively low level of detail. The report Helen Keller shares with GiveWell generally contains its expectations for the regions and activities that UNICEF and/or Nutrition International will be able to support in each country. It does not contain specific information on the amount of funding that each organization is able to contribute by country or how it reached its conclusions about the regions / activities that the other NGOs are able to support. Our understanding from Helen Keller is that this is because it is challenging to obtain information on other actors’ spending plans.
This level of detail is somewhat less than we have seen about other actors’ likely spending for some of GiveWell’s other top charities, and it reduces our confidence in our guesses about other actors’ spending.96 We therefore think of the resulting adjustments as rough best guesses in a context of high uncertainty.
3. Qualitative assessment
In theory, our recommendations are maximizing for one thing: total improvement in well-being per dollar spent. This is what our cost-effectiveness estimates intend to capture.
In practice, there are costs and benefits that we do not observe and are not estimated in our models. We make qualitative assessments to account for these unmodeled costs and benefits. We then use these assessments alongside our cost-effectiveness estimates to inform our funding recommendations.
As one tool for thinking through and communicating about impressions we have that aren't captured in our cost-effectiveness estimates, we assess each organization on eight dimensions on a four-point scale (“Stands out”; “Relatively strong”; “Average”, “Relatively weak”). We believe our top charities are exceptional relative to the majority of organizations and so these assessments are intended to capture differences among GiveWell top charities, rather than absolute rankings among all charitable organizations.
Overall, our assessment of Helen Keller is about average among GiveWell top charities on most criteria, and we have not assessed Helen Keller as standing out in any dimension. Our latest assessment (for 2023) is in the table below.
| Dimension | What does this capture? | Assessment |
|---|---|---|
| Responses to our questions | When we ask the organization a question, do its answers generally either indicate that it has thought through the question before or show us why getting an answer is not important to understanding its work? | Average |
| Prioritization discussions | Do the organization's explanations about how it allocates funding among different locations and program participants seem to be aimed at maximizing its impact per dollar? | Average |
| Self-improvement and attitude toward mistakes | Does the organization proactively share information with us and publicly about mistakes it has made? | Average |
| Role in field | Is the organization producing research aimed at informing policymakers or other implementers? Does it participate in global conversations about its field of work? | Relatively strong |
| Responsiveness | Does the organization send us information by mutually agreed-upon deadlines? Is it responsive to our emails? | Average |
| Giving us feedback | Does the organization catch our mistakes and let us know, thus improving our research? Does the organization make useful suggestions for how we could improve our research process and cost-effectiveness models? | Average |
| Quality of information shared | Have the documents that the organization has shared with us contained significant errors? Has the organization told us things that were inaccurate? Has the information provided been easy to interpret and use? Have the organization's projections of when it would achieve its goals generally been accurate? | Average |
| Incorporating feedback from participants and last mile providers | How does the program collect feedback from program participants and from program implementers, i.e. those directly delivering the program? How does the program incorporate feedback to improve service delivery? | Average |
Our assessment is based on many conversations with Helen Keller over time and reviewing information it has shared on its program. Some examples of the factors informing our assessment are:
Self-improvement and attitude toward mistakes (average)
- Our ideal is that organizations we fund will be full thought partners in how to generate rigorous information to monitor their programs’ impact. We see Helen Keller as slightly below average compared to GiveWell’s other top charities on this metric.
- For example, we have felt that Helen Keller has been less concerned than GiveWell about issues we have raised about its monitoring (see above), although Helen Keller has told us it is planning a change in its approach to improve survey representativeness and (as of November 2023) is actively working on what this will entail.97
- We see it as a positive that Helen Keller has previously drawn attention to potential problems with its program. For example, Helen Keller has previously told us about one example of program managers dedicating more attention to locations that they knew in advance would be covered by a post-campaign survey.98 This kind of information increases our trust in Helen Keller and improves our ability to model the cost-effectiveness of its program. However, it has only done this sporadically.
- Overall, we see the information that Helen Keller has shared as reasonably detailed and reliable, in line with what we have seen from other GiveWell top charities.
- However, we have sometimes found the information Helen Keller has shared with GiveWell to be hard to fully interpret. This means we have not been able to understand some operational aspects of Helen Keller’s program as much as we would like. For example, Helen Keller reports using a hybrid approach to delivering VAS in Côte d’Ivoire and DRC, consisting of routine delivery through primary healthcare clinics for most of the year, with biannual “catch-up campaigns” to reach children who are missed.99 Our impression is that these are very similar to the conventional campaigns Helen Keller conducts in other locations, and we have not been able to understand how and why they are different. In 2023, GiveWell asked Helen Keller to share additional details on operational aspects of its program in each country in its annual narrative report, which has partly but not fully improved our understanding of how its program works.
- We have also found that some information Helen Keller has shared has been presented in a way that makes it hard to interpret. This includes inconsistent reporting in its coverage surveys (e.g., some surveys report findings from data audits and some do not),100 and a lack of clarity on where information is sourced from.
- Helen Keller is a large, multi-program NGO. It has staff and relationships with ministries of health in many of the countries where the greatest number of child deaths occur, which positions Helen Keller well to carry out and expand VAS programs.101 It is also one of the three core members of the Global Alliance for Vitamin A (GAVA) partnership.102
- We believe that it has a strong track record of identifying funding gaps for VAS and, when it has had resources to do so, scaling up programs quickly and reaching high coverage. For example, Helen Keller expanded its support for VAS campaigns with GiveWell funding from four countries in 2018 to nine countries in 2021.103 Our analysis of Helen Keller’s coverage surveys suggests that it managed to achieve generally high coverage in campaigns, even in countries where it was just beginning to provide support.104
Other points
- Helen Keller has taken the initiative in designing and testing different implementation models for VAS that are more closely integrated in routine healthcare delivery, and that can deliver high coverage at lower cost (examples in footnote).105 We see this as a positive because this effort is aligned with our goal of maximizing the cost-effectiveness of VAS programs.106 We have not yet fully analyzed the findings from these studies or considered their implications for how Helen Keller’s program will be delivered in the future.
4. What do you get for your dollar?
GiveWell recommends interventions and organizations that we believe are cost-effective in the sense of saving or improving lives as much as possible for as little money as possible. We summarize the full reasoning behind our cost-effectiveness analysis for Helen Keller in our separate report on VAS. In summary, as of February 2024, we think:
- It costs between ~$1,000 and ~$8,500107
to avert a death through Helen Keller-supported VAS campaigns. This equates to being approximately 9 to 59 times as effective as spending on unconditional cash transfers (GiveWell's benchmark for comparing different programs). This is because:
- VAS significantly reduces child mortality (we estimate ~4% to ~12%, depending on the location).108 This is based on a meta-analysis of randomized controlled trials, to which we apply some adjustments to account for our doubts about the evidence and changing health environments since the trials were conducted.
- VAS is very cheap to deliver (around $1 per capsule delivered).
- In addition to preventing deaths, we think VAS probably provides additional benefits like increased income in later life, vision benefits, and costs averted from treatment of illness.
See our VAS report for more details.
5. Previous Helen Keller grants
6. Sources
- 1
“Today, Helen Keller Intl helps children and families in 20 countries across Asia, Africa, Europe and the United States grow and eat nutritious food, stave off malnutrition, build strong immune systems, access life-saving medical treatments, and prevent and treat blindness and vision loss.
By providing the right support at the right time, we help millions of families and communities overcome longstanding cycles of poverty, helping them create lasting change in their own lives.” Helen Keller, ‘What we do’ page. Accessed June 2nd 2023.“42 states require regular vision screenings for students, but many school districts are unable to secure the budget to screen the youngest members of society. For just $35 a student, Helen Keller bridges this gap by partnering with schools to reach every child with a vision screening, and when needed, a pair of prescription eyeglasses.” Helen Keller, ‘Protecting Vision in the United States’ page. Accessed June 2nd 2023.
- 2
Between 2018 and 2021, Helen Keller supported VAS campaigns in nine countries with GiveWell funding. See this spreadsheet for details by country.
- 3
"In settings where vitamin A deficiency is a public health problem, vitamin A supplementation is recommended in infants and children 6–59 months of age as a public health intervention to reduce child morbidity and mortality (strong recommendation). The quality of the available evidence for all-cause mortality was high, whereas for all other critical outcomes it was moderate to very low. The quality of the available evidence for outcomes in human immunodeficiency virus (HIV)- positive children was moderate for all-cause mortality." WHO Guideline: Vitamin A supplementation in infants and children 6-59 months of age 2011, p. 1.
- 4
“Vitamin A deficiency (VAD) impairs body functions and may cause death. Adverse health consequences may also include xerophthalmia (dry eyes), susceptibility to infection, stunting and anaemia (Sommer 1996; Rice 2004).” Imdad et al. 2010, p. 9.
Xerophthalmia (dry eyes), is “the leading cause of preventable childhood blindness” WHO, Global prevalence of vitamin A deficiency in populations at risk, 2009, Pg 1.
- 5
“Chronic VAD may develop when animal sources and fortified foods are limited, as in diets that rely heavily on vegetables and fruits (Ramakrishnan 2002).” Imdad et al. 2010, Pg 9.
- 6
“In settings where vitamin A deficiency is a public health problem, vitamin A supplementation is recommended in infants and children 6–59 months of age as a public health intervention to reduce child morbidity and mortality (strong recommendation).”
The 4-6 month recommended schedule is in the WHO guidelines on pg 5.
WHO Guideline: Vitamin A supplementation in infants and children 6-59 months of age 2011, pp. 1, 5. - 7
“Mass distribution campaigns are the main delivery mechanism for VAS. These campaigns are organized at least every 6 months…”
"Because mass campaigns take place only every 4 to 6 months, children who reach the age of 6 months between two campaigns, may have to wait several months before they get their first dose of Vitamin A despite being the most vulnerable age group."To remedy this, HKI is working closely with country-level health sector experts to add a contact point in national immunization calendars – at 6 months, when no other vaccination is scheduled.
"Additionally, HKI supports routine facility-based and outreach delivery of vitamin A for all children under 5 in countries where stronger health systems offer sufficient access to quality services. Few countries are ready for this approach and these still need to develop social mobilization actions to create demand to match the capacity to offer services." Helen Keller, VAS overview brochure, p. 2.
- 8
When paired with polio campaigns, these campaigns are known as “national immunization days” (NIDs). These campaigns are typically conducted door-to-door. When paired with deworming and other child health interventions, these campaigns are known as “Child Health Days” or “Child Health Week”. These may be either door-to-door or fixed site.
“In polio vaccination campaigns – also known as national immunization days (NIDs) – health workers go door-to-door providing oral polio vaccines. These campaigns generally occur one or more times per year. Because teams are already going door-to-door, it is relatively simple and inexpensive to add an additional person to each distribution team to deliver VAS to children aged 6 to 59 months.
Child health days (CHDs)
The term ‘child health day’ can refer to many different types of programs, but is generally some type of biannual event that provides a package of health interventions for preschool-aged children. There are two broad types of CHDs:- Mobile aka door-to-door distribution
- Mobile CHDs involve health workers going door-to-door to provide communities with vitamin A supplements and other health services. This strategy is operationally very similar to polio NIDs.
- Fixed-site distribution
- In fixed-site CHDs, caregivers must bring their children to health centers or other fixed distribution sites to receive the package of health services.
- Many CHD programs utilize a ‘fixed + outreach’ strategy, in which they implement outreach activities to encourage caregivers to bring their children to the fixed site to receive health services.”
GiveWell's notes from a site visit with Helen Keller to Conakry, Guinea, October 9-11, 2017, p. 3.
- Mobile aka door-to-door distribution
- 9
Note: the World Health Organization recommends VAS every four to six months, but we have not seen Helen Keller supporting campaigns at four-month intervals.
“In settings where vitamin A deficiency is a public health problem, vitamin A supplementation is recommended in infants and children 6–59 months of age as a public health intervention to reduce child morbidity and mortality (strong recommendation).”
The 4-6 month recommended schedule is in the WHO guidelines on pg 5.
WHO Guideline: Vitamin A supplementation in infants and children 6-59 months of age 2011, pp. 1, 5. - 10
Note: Helen Keller reports that six countries use a door-to-door campaign approach (Guinea, Mali, Niger, Burkina Faso, Cameroon, and Madagascar). See Helen Keller Intl, 2023 annual report to GiveWell on Helen Keller Intl’s vitamin A supplementation activities, figure 2 (pg. 7).
Helen Keller also reports that its program in DRC and Côte d’Ivoire uses a hybrid “routine + catch-up campaigns” approach, consisting of routine delivery through primary healthcare clinics for most of the year, with biannual “catch-up campaigns” to reach children who are missed. However, our understanding is that these campaigns are virtually identical to the conventional door-to-door campaigns that Helen Keller supports in other locations, with the only operational difference being more checks of vaccine cards to avoid double dosing. We therefore include these countries in our summary of countries where Helen Keller supports door-to-door campaigns. See Helen Keller Intl, 2023 annual report to GiveWell on Helen Keller Intl’s vitamin A supplementation activities, figure 2 (pg. 7).
Our understanding of the operational similarities between these campaigns and the campaigns in other countries is based on an unpublished conversation with Helen Keller, December 7th, 2023.
- 11
“Fixed-site distribution
- In fixed-site CHDs [Child Health Days], caregivers must bring their children to health centers or other fixed distribution sites to receive the package of health services.
- Many CHD programs utilize a 'fixed + outreach' strategy, in which they implement outreach activities to encourage caregivers to bring their children to the fixed site to receive health services."
GiveWell's notes from a site visit with Helen Keller to Conakry, Guinea, October 9-11, 2017, Pg 3.
- 12
See Helen Keller Intl, 2023 annual report to GiveWell on Helen Keller Intl’s vitamin A supplementation activities, pp. 21-22 (for Kenya) and pp. 26-7 (for Nigeria). Note that Helen Keller also supports campaigns using this approach in Tanzania (see pp. 29-30), but this is covered by other funding sources and has not used GiveWell funding.
- 13
Examples:
- Kenya: “Since 2020, Helen Keller has been conducting a study in Siaya county to compare the effectiveness of using community volunteers to distribute VAS routinely in their catchment areas versus distribution through facilities, and multiple outreach platforms including campaigns. The intervention is completed, and data analysis is currently underway. The report is expected to be completed before the end of quarter one in 2022.” Helen Keller, Annual Report to GiveWell on Helen Keller Intl’s Vitamin A Supplementation Activities, 2022, p. 7. GiveWell has since reviewed this report.
- Cameroon: “Two studies were conducted in Cameroon from January 2022 to July 2023. A bottleneck study of the twice-yearly VAS delivery through campaign took place from September to October 2022. Results from this study were crafted into actions to improve the SASNIM that took place in December 2022. From February 2022 to February 2023, Helen Keller supported the Ministry of Health in a project that implemented a self-monitoring approach in the routine health system. This approach aimed to strengthen the routine delivery of VAS in health facilities and increase caregiver uptake of VAS at health facilities in the health districts of Kaele and Guidiguis. In this project, administrative service utilization data were analyzed and compared to the census population data of target children who are due for VAS. If children were identified as nearing their due date for supplementation, the community health volunteers visited, reminded, and referred caregivers to the nearest health facility so that their child could receive VAS. If the child did not receive VAS within the month following the reminder/referral, a second visit was made to the household during the following month. During the review of administrative coverage data the end of every month, health workers organized and the community health workers would go to a targeted fixed point within the catchment areas with highest default rate (or, in other words, lowest VAS coverage of targeted children for that month). Community mobilization activities such as radio and community leadership announcements would promote/advertise that parents take their children to these fixed points if they were due or overdue for VAS. Using this approach for routine VAS distribution, Guidiguis and Kaele were successful in achieving high VAS coverage on a monthly basis throughout the pilot study (overall coverage throughout the study period: 87.6% in Guidiguis and 89.11% in Kaele). The cost per child supplemented with vitamin A in Kaele and Guidiguis was an estimated 497.11 FCFA (approximately 0.75 USD). The results from this study are available in a report and will be further developed into a paper for submission to an international journal for consideration for publication. These results are also currently being considered by the Ministry of Health and partners to inform the scale up of routine VAS delivery in Cameroon.” Helen Keller Intl, 2023 annual report to GiveWell on Helen Keller Intl’s vitamin A supplementation activities, pg. 36.
- 14
“The Ministry of Health aims to transition all 113 districts to this hybrid approach in the coming years. To ensure that the coverage of vitamin A supplementation (VAS) remains above 80%, Helen Keller Int’l will accompany this transition. In the initial years, some districts will continue distributing VAS through the traditional campaign approach, while others will be supported in adopting the hybrid approach combining routine delivery and campaigns. In certain districts, a combination of facility delivery, outreach distribution sessions, and delivery by community volunteers will be tested and later scaled up.” Helen Keller reports that it plans to work with the Ministry of Health to transition 75 of the 100 districts it plans to support to this latter model by 2027. See table 11, Helen Keller Intl, 2023 room for more funding report, pg. 19.
We do not have a strong understanding of what this transition will involve. Our initial understanding is that Helen Keller will be conducting an operational pilot in 8 health districts before expanding to the remaining planned districts. The pilot will test a model of routine VAS delivery that we understand is similar to the Cameroon pilot described in the footnote above. Health workers will conduct a census of children in their areas, and conduct outreach visits to children nearing their scheduled VAS date to encourage them to go to health clinics. Fixed post outreach events to deliver VAS will be conducted for areas with low coverage. However, we have not seen a detailed operational plan for this approach. This understanding is based on a conversation between GiveWell and Helen Keller, November 7th, 2023. - 15
“Initially, VAS coverage rapidly reached more than 80% of children aged 6 to 59 months in sub-Saharan Africa through its integration in door-to-door polio vaccination campaigns. However, as these campaigns began to phase out following progress in the eradication of polio in Africa in the 2010’s, VAS coverage started to decline.” Helen Keller Intl, 2023 annual report to GiveWell on Helen Keller Intl’s vitamin A supplementation activities, p. 6.
- 16
“When polio campaigns take place, the World Health Organization and the Global Polio Eradication Initiative cover the cost of the core teams, and VAS stakeholders “only” have to support the addition of one distributor. When there is no polio campaign, VAS partners usually support two distributors per campaign, resulting in significantly higher costs. The frequency of polio campaigns organized in Helen Keller countries continues to decline (see Table 2). The darkest cells in Table 2 show occurrences of polio campaigns where VAS could not be integrated, either for reasons of timeline or refusal of WHO. In situations where VAS could not be “piggy-backed” on polio campaigns, we had to increase funding support for VAS in these countries. Thus, in these situations, large variations occurred between the amounts originally budgeted by the country and amounts spent.” Helen Keller, Room for More Funding Report, July 2021, Pg. 7.
Note: although we would expect campaign costs to have risen over time because of fewer opportunities to piggyback on polio campaigns, GiveWell’s analysis suggests that Helen Keller’s cost per supplement actually fell between 2020 and 2022 (from $1.10 on average in our 2020 analysis to $1.02 in our 2022 analysis). We do not have a good understanding of the reason for the discrepancy.
- 17
"For distribution sites visited by an independent HKI supervisor, 86% met the criteria for minimum quality threshold for service delivery defined as 1) health worker used scissors to cut the capsule 2) health worker asked the age of the child 3) health worker squeezed the drops into the child’s mouth 4) health worker used the correct dose of VAS and 5) were there no stock-outs of VAC." Helen Keller VAS project year 1 report 2014 (unpublished).
See the guidelines for health workers in Helen Keller Intl, VAS supervision checklist: universal and Helen Keller Intl, Tanzania social mobilization toolkit: VAS administration guide.
- 18
Helen Keller Intl, Tanzania social mobilization toolkit: VAS administration guide:
- "Ask the age of the child to determine the appropriate dose of vitamin A (6-59 months) and whether the child is old enough for a deworming tablet (12-59 months)."
- "If the distribution point runs out of red (200,000 IU) capsules, two blue (100,000 IU) capsules can be given in place of one red capsule. If the distribution points runs out of blue capsules squeeze half the number of drops from a red capsule into the mouth of a child aged 6-11 months."
See additional guidelines for dosage selection in Helen Keller Intl, VAS supervision checklist: universal.
- 19
Other NGOs (e.g., the World Bank and World Health Organization) have also provided some financial support for VAS campaigns in some locations. Our understanding is that this is usually funding other interventions co-delivered with VAS. The level of support has varied by location and over time. See the explanatory notes on our cost per supplement analysis for further detail by country.
- 20
This understanding is based on many conversations with Helen Keller and other VAS stakeholders over time.
- 21
“Health workers distribute vitamin A capsules at health facility level, and community health workers are responsible for vitamin A distribution in communities, using either door-to-door visits or outreach distribution stations. Community distributors are usually organized in pairs and are equipped with tally sheets to record each capsule they distribute, indicating the age group and the sex of the child receiving it.” Helen Keller Intl, 2023 annual report to GiveWell on Helen Keller Intl’s vitamin A supplementation activities, pg. 10.
- 22
For a detailed description of each partner organization’s role by country in 2021 campaigns, and Helen Keller’s expectations for their roles in 2022 campaigns, see Helen Keller, Room for More Funding Report, July 2022. Examples:
- Cameroon: “Helen Keller resumed its support to the government of Cameroon for VAS during the second semester of 2021 in six regions: Centre, Littoral, West, South, Adamawa and East. These six regions represent close 3 million children 6-59 months of age (see Table 9), accounting for around 50 percent of all children in Cameroon. It also includes internally displaced persons (IDP) who are victims of insecurity in Northwest and Southwest regions. The other 4 regions were supported by Nutrition International (2) and UNICEF (2).” P. 9.
- Guinea: “No significant change occurred in the support provided by Helen Keller in Guinea. For the two rounds of 2022, Helen Keller supported 5 regions and UNICEF 3 regions.” P. 13.
- Mali: “In 2021, as UNICEF experienced funding gaps, Helen Keller was requested to support the additional region of Koulikoro for both semesters. Nutrition International also supported several regions. In 2022, it is planned that Helen Keller continues to support the 3 regions of Kayes, Ségou and Koulikoro for both semi-annual VAS distribution 2 rounds. UNICEF will support the remaining 8 regions and the Bamako District with various sources of funds, including some received from Nutrition International.” P. 15.
- 23
GAVA, ‘About’ page. “Core Partner Agencies: UNICEF, Nutrition International, Helen Keller International”. Accessed June 1st, 2023.
“These coordination forum[s] are always embedded in national coordination bodies chaired by the Ministry of Health. Decision on which regions each actor will support is taken based on availability of funds for each actor and historical presence of the actors in specific regions, for VAS or for other programs.” Helen Keller Intl, comments on a draft of this page, December 14th, 2023.Note that GiveWell only has a limited understanding of exactly how this coordination process works.
- 24
“Micronutrient Initiative (MI) (the name of the organization changed ~1 month ago to Nutrition International or NI) is only active in 4 of the 13 countries were HKI is operational, however MI provides the needed number of vitamin A capsules to all countries where HKI works. MI’s role essentially takes place at the national level, providing technical and policy guidance to governments. In most cases, MI delivers the vitamin A capsules to UNICEF, who organizes their management with the national government and ensures that they reach the field."
HKI country-level technical support related to vitamin A supplementation (unpublished), p. 2.“We have been a global leader in vitamin A supplementation since our inception 30 years ago, supporting governments to integrate VAS into existing health platforms and ensuring children are not missed with lifesaving VAS. We have led in setting the manufacturing standards and providing vitamin A capsules to eligible countries through the in-kind donation program – implemented with UNICEF, and with support from the Government of Canada – procuring and donating more than 10 billion capsules since 1997.”
Nutrition International, ‘Strengthening health systems to deliver lifesaving vitamin A’. Accessed May 2023. - 25
Burkina Faso, Cameroon, Côte d'Ivoire, Democratic Republic of the Congo (DRC), Guinea, Kenya, Mali, Niger, and Nigeria. In 2021, Helen Keller also used a small amount of funding to support non-campaign VAS activities in Cameroon, Senegal, and Sierra Leone. See Helen Keller Intl, 2022 annual report to GiveWell on Helen Keller Intl’s vitamin A supplementation activities, pp. 5-6.
- 26
Created using https://www.mapchart.net/.
- 27
See this spreadsheet for a breakdown of Helen Keller’s budgets on campaigns from 2018 to 2021, by country. Budgets for "sub-agreements" are funds that Helen Keller plans to grant to governments for program implementation.
Helen Keller Intl told us that grants are typically provided to both national and subnational governments, with different activities covered by each.“The model used in most countries involves contracts with administrative units and at central level.
a) Sub-agreements at the national level facilitate coordination meetings, supervision of Ministry of Health staff at the central level in the field, and occasionally logistics for sending supplies from the national level to the field.
b) Sub-agreements at the administrative unit level cover training of actors, communication, social mobilisation activities, logistics, supervision, local coordination meetings and data validation meetings.” Helen Keller Intl, comments on a draft of this report, January 11th, 2024. - 28
“The resulting budget, along with the detailed information from the microplans, form the basis for sub-agreements signed with government entities.
These sub-agreements define in detail the roles and responsibilities of Helen Keller and the governments in the implementation of VAS activities and are mainly used for campaigns. Sub-agreement funds for government activities and staff represent approximately 70% of the total implementation costs and are established with local administrative entities. They describe the legal obligations of the government and all aspects of campaign implementation such as staff training, social mobilization, distribution, and data management. Sub-agreements also describe payment terms, milestones and deliverables associated with each payment.” Helen Keller Intl, 2023 annual report to GiveWell on Helen Keller Intl’s vitamin A supplementation activities, pg. 9.
Helen Keller notes that some funding for specific activities (e.g., coordination, planning meetings and data review meetings) is provided as “direct financial support”, paid for by Helen Keller, and not covered by the sub-agreement. Helen Keller, comments on a draft of this report, January 11th, 2024.
- 29
"To date, HKI’s VAS project has undertaken three main types of activities, which can roughly be categorized as disbursing sub-grants to the government, providing technical assistance, and engaging in advocacy efforts." HKI External Evaluation and HKI Response - Canada DFATD VAS Project 2015, p. 35 (unpublished).
- 30
“Helen Keller supports governments in developing microplans for both routine and campaigns. For routine, the process takes place at the beginning of every year with the government and partners. For campaigns, micro-planning begins approximately six weeks prior to the campaign (or routine mop up) activities and is characterized by several key inputs:
- Standardized micro-planning: Helen Keller has developed standardized guidelines to support governments to conduct this process, with daily objectives for distribution teams in both urban and rural areas of each supported region. These guidelines serve as a basic framework for accurately calculating the number of distributors, supervisors and social mobilisers needed. Implementing these standards ensures that the workload for each category of actor remains manageable, significantly increasing the campaign's chances of success.
- Comprehensive micro-plans: based on these standards, comprehensive micro-plans are developed with budgeted activities at all levels, from national level to health facilities. In addition defining the target populations and staffing requirements, these micro-plans specify supplies needs, address logistics processes, and create structured monitoring circuits.” Helen Keller Intl, 2023 annual report to GiveWell on Helen Keller Intl’s vitamin A supplementation activities, p. 9.
- 31
“Helen Keller is involved in coordinating and supporting training for all actors engaged in vitamin A supplementation at all levels of the health system. Our involvement includes the comprehensive review and improvement of training tools to capitalize on lessons learned from previous campaigns and the rollout of training tools. We work closely with Ministries of Health to facilitate training at all levels, usually training trainers ourselves at national level and supporting these trainers cascade the training down to the field level. This cascading approach ensures that health workers at facility level are trained by the district management teams, while community health workers are equipped with the necessary skills through training by health workers.” Helen Keller Intl, 2023 annual report to GiveWell on Helen Keller Intl’s vitamin A supplementation activities, pg. 9-10.
- 32
“Social mobilization: Promoting participation and buy-in from different social groups and local actors is critical to the success of the campaign. To inform communities about VAS campaigns and other related activities, we build the capacity of communication focal points and community mobilisers. Social mobilization activities, carried out by well-trained mobilisers from neighborhoods, villages, or communities, play a key role in behavior change. For campaigns, these mobilisers carry out door- to-door communication working closely with distribution teams, identify children, address possible refusals, and use their community connections to increase the effectiveness of distribution. These communication activities last for five days, starting three days before the start of the campaign and continuing for the first two days of campaign implementation. Helen Keller promotes the use of pre-identified mobilization channels tailored to specific environments. Local radio stations, administrators, health workers, educators, traditional and religious leaders, and town criers are used to disseminate information effectively. Banners and posters are used for visibility. Local radios are used to announce campaign dates and provide information on the benefits of vitamin A, the target age groups, administration methods, and other related activities.” Helen Keller Intl, 2023 annual report to GiveWell on Helen Keller Intl’s vitamin A supplementation activities, p. 10.
Examples of social mobilization and marketing materials:
- Helen Keller Intl, Tanzania social mobilization toolkit: VASD posters
- Helen Keller Intl, Tanzania social mobilization toolkit: mobilization script
- Helen Keller Intl, Tanzania social mobilization toolkit: mobilization script (Swahili)
- Helen Keller Intl, VAS television commercial: DRC (French)
Helen Keller told us that it uses more time and funding on social mobilization in countries where caregivers bring children to receive vitamin A supplements at fixed sites than in countries using door-to-door distributions. David Doledec, Helen Keller Regional VAS Program Manager, and Rolf Klemm, Helen Keller Vice President of Nutrition, conversation with GiveWell (unpublished), July 18, 2018.
- 33
“Independent monitoring: Throughout the distribution process, Helen Keller establishes a robust independent monitoring system that follows a WHO-approved method to ensure equitable access to vitamin A capsules for all children. 1 Carefully trained independent monitors with no affiliations to the health system are contracted to assess the coverage of localities previously visited by distributors, and monitoring visits are conducted to ensure the effective execution of campaign activities. Independent monitoring is conducted in areas with low coverage based on the administrative and coverage data from previous campaigns. Additionally, it is conducted in hard-to-reach areas suspected to not have been reached (or at risk of not being reached) by distributors.
• Supervision: Supervision of distribution activities is a joint endeavor by supervisors from Ministries of Health (central, regional, district, and health facility levels) and Helen Keller teams. During campaign implementation, supervisors follow predefined circuits with districts and health facilities to monitor the campaign implementation. Daily synthesis meetings are conducted at each level during the campaign to assess its strengths and weaknesses, identify areas for improvement, and address any urgent challenge.” Helen Keller Intl, 2023 annual report to GiveWell on Helen Keller Intl’s vitamin A supplementation activities, p. 10.
- 34
"In most countries, HKI teams spent around 10% of their time working with the national government to advocate for VAS. HKI advocated for domestic budgets to take a greater proportion of the costs of VAS, to integrate VAS in national health and nutrition policy documents and in pluriannual strategies or action plans, supporting coordination between actors and sectors and promoting monitoring of VAS at national level to provide the government with a comprehensive vision of the services for the whole country." HKI country-level technical support related to vitamin A supplementation (unpublished), p. 1.
- 35
"Because mass campaigns take place only every 4 to 6 months, children who reach the age of 6 months between two campaigns, may have to wait several months before they get their first dose of Vitamin A despite being the most vulnerable age group.
To remedy this, HKI is working closely with country-level health sector experts to add a contact point in national immunization calendars – at 6 months, when no other vaccination is scheduled." Helen Keller, VAS overview brochure, p. 2. - 36
GiveWell-directed funding, including donations from Open Philanthropy and other funders, supported 81% of Helen Keller's VAS campaign work in 2018, 78% in 2019, 95% in 2020, and 99% in 2021. See this spreadsheet for more details about Helen Keller's spending on VAS campaigns from 2018 to 2021.
- 37
We have also received information from Helen Keller on its spending from January 2022 to June 2023, but have not yet incorporated this into our summary.
- 38
See the ‘Summary [2021]’, ‘Summary [2020]’, and ‘Summary [2019]’ sheets in this spreadsheet.
- 39
See this section of the spreadsheet for a breakdown by country.
- 40
See this section for a discussion of what these agreements cover.
- 41
See this section of the spreadsheet for a breakdown by category.
Direct program costs include all budget items in this sum (25% of total spending) and the activities section of the budget, as combined in this sum (25% of total spending). 25% + 25% = 50%.
- 42
See this section of the spreadsheet.
- 43
We raised this issue with Helen Keller in December 2022. Helen Keller has informed us that it plans to share the results from this procedure in all future surveys. We have not yet reviewed the subsequent round of surveys to analyze the findings from this procedure. Helen Keller Intl, Email to GiveWell, Jan 9th 2023 (unpublished).
- 44
Our 2022 analysis includes the first round 2022 campaigns in Cameroon, DRC, and Kenya. See this section of our analysis for more details.
Since we last updated our analysis, Helen Keller has shared the remaining surveys it conducted in 2022 and additional surveys from the first half of 2023. We have not yet analyzed these surveys. - 45
See this section of our analysis. Note that this calculation includes only surveys from 2018 to 2021. We exclude 2022 from our analysis because, at the time the analysis was conducted, some 2022 campaign coverage surveys were due to be conducted but data was not yet available.
- 46
See columns B and D in this sheet in our analysis for details of which round and which locations surveys were conducted in, by year.
- 47
Source: GiveWell conversations with Helen Keller Intl, September 6 and October 4, 2022 (unpublished).
- 48
Our analysis suggests that Helen Keller’s surveys may increasingly be sampling fewer regions or districts over time.
- In 2019, all the surveys we reviewed sampled all Helen Keller-supported regions included in the campaign (with the exception of the Guinea round 2 survey, where some locations could not be reached because of security risks). See this row in our analysis.
- In 2020, all the surveys we reviewed sampled all Helen Keller-supported regions included in the campaign. The exception was the Kenya round 2 survey, where 2 of 6 regions were surveyed. See this row in our analysis.
- In 2021, two of six surveys that we reviewed (Burkina Faso round 2 and Nigeria round 2) did not comprehensively sample all regions. See this row in our analysis.
- Our 2022 analysis only contains 3 2022 surveys which were available at the point of analysis. Of these, the DRC survey did not comprehensively sample all provinces. The Kenya survey surveyed 1 county and the Cameroon survey surveyed 2 regions. We expect that these surveys were not comprehensive of all regions, although at the time we conducted the analysis we did not know how many regions were included in these 2 surveys. See this row in our analysis.
- 49
For further details by survey, see row 4, “What was the study population?”, in the following sheets in our analysis of Helen Keller’s monitoring:
As an example, the Cameroon 2022 coverage survey (round 1) was conducted in Centre and Littoral regions only, out of the six regions supported by Helen Keller in 2022. We do not know why these two regions were selected.
In one coverage survey report we have analyzed (Burkina Faso, round 2, 2021), Helen Keller states that some non-random factors were used to select survey districts (two districts in two regions were surveyed, but the campaign took place in 13 regions). “This study will be conducted in two health districts. These are the health district of Kombissiri which is in the health region of the Center South and the health district of Yako which is in the health region of the North...These two sites were highlighted in collaboration with the Directorate of Nutrition, the Regional Health Directorates of the Center South and North, for several reasons including: (i) accessibility. Districts are easily accessible for data collection teams; (ii) security. These are sites that are not prey to recurrent terrorist attacks in certain localities of Burkina Faso; (iii) the existing collaboration between HKI, UNICEF and the health authorities of the two study sites." (Helen Keller, post-event coverage survey report, Burkina Faso, 2021 (translation)), p. 15. We do not know whether these factors were also used to select districts or regions in other coverage surveys.
- 50
GiveWell, Conversation with Helen Keller, October 4th, 2022 (unpublished).
- 51
GiveWell, Conversation with Helen Keller, October 4th, 2022 (unpublished).
- 52
GiveWell, Conversation with Helen Keller, September 6th, 2022 (unpublished).
- 53
Helen Keller, email to GiveWell, November 7th, 2023 (unpublished).
- 54
See Helen Keller, Post-event coverage survey guide, 2019.
- 55
Rolf Klemm, Helen Keller Vice President of Nutrition, and David Doledec, Helen Keller Regional VAS Program Manager, conversation with GiveWell, March 30, 2020 (unpublished).
- 56
According to Helen Keller, a different sampling method was used for 2020 coverage surveys in Kenya and Nigeria. For more detail, see the "Nigeria (round 1) PECS" and "Kenya (round 2) PECS" columns of this spreadsheet. We don't know why Helen Keller used a different methodology for these surveys.
- 57
"In the case of PECS, a stratified two-stage cluster survey will be conducted. The stratification criteria are: the intervention area and the nature of the areas (urban, rural) according to the
Context." Helen Keller, Post-event coverage survey guide, 2019, p. 17.
For details of standard sampling procedure, see Helen Keller, Post-event coverage survey guide, 2019, pp. 18-24. - 58
See this row in the “Methods (2021)” sheet of our analysis.
- 59
See this row in the “Methods (2021)” sheet of our analysis.
- 60
“This first step will consist in listing all the eligible households in each cluster. The maps of sampled clusters will be handed to the enumerators who, once in the cluster, will enumerate all the households in the cluster and enter the identification number of each identified household on their door and on the household census form. . . . Each evening, all the team leaders will report the households surveyed by cluster to the senior supervisor, indicating the number of eligible households identified per cluster. A random sampling using the function RANDBETWEEN (min, max) of Excel will be used for the household sampling. It's a simple matter of entering as minimum value 1 and maximum value the number of eligible households in the cluster and then draw the function on the number of households to be surveyed. Thus, we have a list of number of households and only these households will be surveyed (since each household in the cluster is numbered from 1 to n). An inventory form of households selected in this way will be established for monitoring.” Helen Keller, Post-event coverage survey guide, 2019, pp. 30-31.
- 61
"This number of households to be surveyed per day recommended by WHO is generally between 5 and 15, and is influenced by the number of people who work in each field data collection team. We usually choose 10 but this number can increase with the proportion of non-response measured in a previous survey. To further increase the representativeness of the survey, a weighing system is applied to data before analysis to account for number of households in each enumeration area and number of children." David Doledec, Program Director, Vitamin A Supplementation, Helen Keller Intl, Suggested edits to this page, January 2023 (unpublished).
- 62
See this row in the “Methods (2021)” sheet of our analysis.
Our understanding that all eligible children in selected households are surveyed comes from Rolf Klemm, Helen Keller Vice President of Nutrition, and David Doledec, Helen Keller Regional VAS Program Manager, conversation with GiveWell, March 30, 2020 (unpublished).
- 63
“To determine the eligibility of a child, enumerators should follow the procedure below:
- Ask the mother or caregiver if the child's health card or birth certificate is available.
- If the health card is not available, ask the caregiver if he/she remembers the exact date of birth of the child.
- If the caregiver does not remember the child's exact date of birth, the interviewer should ask if he/she remembers the specific month and year in which the child was born.
- If the caregiver cannot remember the month of birth, a calendar of local events can be used to estimate when the child was born. A young child who walks is at least 9 months old and would be eligible for the interview.”
Helen Keller, Post-event coverage survey guide, 2019, p. 24.
- 64
“If the respondent is absent at the first visit, return at least twice more.” Helen Keller, Post-event coverage survey guide, 2019, pg. 31.
"In the new sampling approach, replacement households are integrated in the calculation of the sample, based on assumptions (and past surveys experience) of the proportion of households that would need to be replaced, so there is no more need to provide extra replacement households to field teams even if some households they visit happen to refuse the survey or not be eligible." David Doledec, Program Director, Vitamin A Supplementation, Helen Keller Intl, suggested edits to this page, January 2023 (unpublished). - 65
See:
- 66
See example from 2019 here: Helen Keller, Post-event coverage survey questionnaires, 2019.
The same questionnaires were used in 2020, with minor updates to account for changes in the package of interventions delivered alongside VAS in each campaign and to collect information on COVID-19. Helen Keller, answers to GiveWell's questions, November 2021 (unpublished).
- 67
See:
- 68
See Helen Keller, Post-event coverage survey questionnaires, 2019, pp. 1 - 6.
- 69
See:
- 70
“(Show capsules or a picture of vitamin A)” Helen Keller, Post-event coverage survey questionnaires, 2019, pg. 3.
“(Show a tablet or deworming photo).” Helen Keller, Post-event coverage survey questionnaires, 2019, pg. 4. - 71
See:
- 72
“Is it correct that the 10% re-survey procedure was used in all surveys, including those for which it is not explicitly mentioned in reports? Yes the 10% re-survey procedure was used in all surveys, indeed, the procedure for revisiting the 10% of households is part of the methodology used for the PECS surveys.
What are the details of this procedure (How are re-survey households selected? A quality control of 10% of the data collected by the interviewers is carried out by the supervisor, thus, in each locality the supervisor randomly selects one (01) household already surveyed and asks some essential questions (i.e. linked with coverage) from the household questionnaire and adapted for a double interview in order to evaluate the coverage of services provided to these surveyed households. The household responses from the first interview will be compared to those from the second interview. The household identification number writen on their door by the interviewers helps the supervisor to easily locate the drawn households.
Are supervisors blinded to initial results? Yes, The supervisor does not have access to the initial results before going to the field to draw the 10% of households to be surveyed. The random sampling of the 10% households is done once in the cluster by the supervisor.
What is the process for correcting issues? If both the interviewer and the supervisor are in the cluster, the supervisor conducts the verification and provides feedback to the interviewer to return to the household if necessary or to improve future surveys. If the interviewer and the supervisor are not in the cluster together, the verification data are sent to the platform and the ONA platform manager provides daily feedback on the concordance of the data to return to improve future surveys. In all cases, the household responses from the first interview will be compared to those from the second interview.” Helen Keller, answers to GiveWell’s questions, September 30, 2020 (unpublished).
- 73
We have seen results from this monitoring procedure in five of nine coverage surveys we have reviewed in 2021 and 2022:
- DRC, 2022: reports data on both (a) the correspondence between the main survey and the audit and (b) coverage rates from the audit. It found that supervisors and survey teams disagree on whether 7.6% of the children surveyed received VAS. There doesn’t seem to have been any evidence of bias in the results. The coverage rates found by supervisors were very similar to those by the original survey team (91.72% vs 89.66%). Correspondence on other audit measures was also high (94% correspondence on the number of children in a household, 98% correspondence on children’s sex).
- Kenya, 2022: reports data on coverage rates from the audit compared to the original data, but not on correspondence. Reported coverage was similar in both the original and audited data (80.5% vs 81.9%).
- Mali, 2021: reports both correspondence and a comparison of coverage rates. Supervisors and survey teams disagreed on whether 5.7% of the children surveyed received VAS. Coverage rates found by supervisors and the original survey team were very similar (78.3% vs 76.6%). Correspondence on other measures varied between 81% (child age), 83% (number of children in the household) and 94% (child’s sex).
- Guinea, 2021: reports on overall coverage rates in the audit and original data,. These were also very similar (87% vs 86.2%). It does not report on correspondence.
- Niger, 2021: reports on correspondence rates (93%), but does not compare coverage rates between the initial and audited data. Correspondence on other measures varied between 78% (child age), 86% (number of children in the household) and 93% (child’s sex).
Sources:
- Helen Keller, DRC Post-event coverage survey report, Kasai Oriental, 2022, pp. 33-34.
- Helen Keller, Kenya Post-event coverage survey report, 2022, Table 26, p. 45.
- Helen Keller, Mali Post-event coverage survey report, 2021 (translation), pp.30-31.
- Nutrition International, Guinea Post-event coverage survey report, 2021 (translation), Table E8, p. 37
- Helen Keller, Niger Post-event coverage survey report, 2021 (translation), Tables 20 - 22, pp. 40-41.
See this row in the “Methods (2022)” sheet of our analysis and this row in the “Methods (2021)” sheet of our analysis for further details.
- 74
Open questions about the data we have not fully investigated:
- Sample sizes for the supervisor audits being lower than 10% of the total sample in some cases.
- Sample sizes for the supervisor audits differing between different questions without accompanying explanation.
In more detail:
- DRC, 2022: 157 supervisor surveys were completed, compared to 925 in the main sample (157 / 925 = ~17%, or higher than the 10% target). However, the reported sample size for each audited question was slightly lower than 157, at 145. We’re not sure why there was a discrepancy. Helen Keller, DRC Post-event coverage survey report, Kasai Oriental, 2022, p. 32.
- Kenya, 2022: The supervisor sample size is not reported. The maximum sample for any single question is 72, compared to 1,088 for the main sample (72 / 1,088 = ~7%). Helen Keller, Kenya Post-event coverage survey report, 2022, Table 26, p. 45
- Mali, 2021: 418 supervisor surveys were completed, compared to 1,695 in the main sample (418 / 1,695 = ~25%). However, the reported sample size for each audited question varied widely, from 69 to 415. We’re not sure why there was a discrepancy. Helen Keller, Mali Post-event coverage survey report, 2021 (translation), pp. 29-30.
- Guinea, 2021: Supervisor sample sizes are not reported.
- Niger, 2021: 82 supervisor surveys were completed, compared to 1,688 for the main sample. The reported sample size for each audited question varied from 79 to 82. We’re not sure why there was a discrepancy, although this discrepancy is small enough that we don’t see it as a significant concern. Helen Keller, Niger Post-event coverage survey report, 2021 (translation), Tables 18 - 22, pp. 40-43.
Note that we also saw some previous audit results from Kenya and Guinea in 2020. We did not have high confidence in the quality of this data, although this was based only on a cursory review:
- The auditing data we've seen reports sample sizes much smaller than we would expect if 10% of households had been re-surveyed, and we aren't sure whether this data is representative of the original sample. It is also unclear whether the rates of agreement in survey responses reported in the auditing data represent rates of agreement at the household level—which is the information we would be most interested in reviewing—or in the aggregate.
- See this spreadsheet, sheet "Methods (2020)," row "Are there methods in place for assessing the accuracy of a random sample of each enumerator's entries? Does the enumerator know that auditing will occur but does not know which entries will be monitored? Were high levels of discrepancies found? What is the process for correcting issues found?"
- The 2020 Kenya and Guinea PECS results and the audits of these results are unpublished.
- 75
The surveys reporting results from this audit are the five mentioned in the previous footnote. See this row in the “Methods (2022)” sheet of our analysis and this row in the “Methods (2021)” sheet of our analysis for details of coverage survey reports which are missing descriptions of the audit procedure.
- 76
Helen Keller, email to GiveWell, January 9th 2023, unpublished.
We have not yet reviewed the subsequent round of surveys to analyze the findings from this procedure. - 77
See:
- 78
Some of the survey results we have seen report coverage rates at the subnational level (such as for each individual region or district within the survey area), while others report a national coverage rate that encompasses the entire survey area. In order to avoid surveys that provide subnational coverage breakdowns having disproportionate influence on the metrics listed below, we have chosen to discuss national-level survey results in this section. In some cases, where a national coverage rate was not provided in the survey results for a particular country, we used the average of the subnational coverage rates, weighting these averages by target population where population estimates were available. See this spreadsheet, sheet "Results Analysis (2013-22)," column "Program-level VAS coverage of children aged 6-59 months, from coverage surveys."
- 79
See this row in our analysis.
- 80
See this row in our analysis.
- 81
See this row in our analysis.
- 82
See this row in our analysis.
- 83
This is our understanding from multiple conversations with Helen Keller.
- 84
As of February 2024, we estimate that it costs approximately $1 to deliver a vitamin A capsule to a child in Helen Keller-supported programs (varying by country, from $0.80 in Mali to $1.39 in Guinea—see this range in our cost per supplement calculations). See this section of our report on vitamin A supplementation for further details.
- 85
See these rows of our cost-effectiveness analysis for this adjustment (-15% adjustment for misappropriation without monitoring results and -2% adjustment for false monitoring results: -15% - 2% = -17%). Specific factors feeding into the figure that we use include:
- In most countries Helen Keller only conducts a survey after one of two campaign rounds. We have seen monitoring results for campaign rounds representing 64% of Helen Keller’s VAS spending in 2019, 52% in 2020 and 29% in 2021. (In part, our understanding is that this fall has been because of temporary disruption resulting from the coronavirus pandemic.) The lack of comprehensive monitoring makes us concerned that the coverage data we have seen overestimate the overall coverage level. Our understanding is that VAS implementers may know in advance which campaign will be surveyed. If that is the case, we would guess that workers would be more incentivized to ensure high coverage in surveyed campaigns than non-surveyed campaigns (which have less oversight). GiveWell conversations with Helen Keller , September 6 and October 4, 2022 (unpublished).
- We have heard feedback from Helen Keller that, in countries which have rainy seasons, its monitoring surveys tend to take place in the non-rainy season This raises a concern that, if coverage is lower during campaigns conducted in the rainy season, the results we see may be systematically overestimating coverage. GiveWell, Conversation with Helen Keller, September 6th, 2022 (unpublished).
- Some methodological features of Helen Keller’s surveys may lead to coverage estimates being inflated. In particular, we would expect responses based on caregiver self-reports to inflate coverage because of social desirability bias.
- 86
See this row of our cost-effectiveness analysis. Note that this estimate refers to the total cost per capsule delivered, including in-kind government costs (e.g., staff time) and donated vitamin A capsules. We use a different estimate (~$0.65 to $0.90, varying by country) without in-kind costs when estimating the number of children reached per $1m of Helen Keller spending in our cost-effectiveness analysis, and account for in-kind costs with a separate adjustment.
The ~$0.65 to $0.90 estimate comes from this range of our cost-effectiveness analysis, which lists our estimates for the cost per child to deliver VAS each year, excluding in-kind costs (~$1.30 to $1.80, varying by country). Since 2 capsules are delivered to a child each year, we divide this range by 2 to yield the cost per capsule delivered. ~$1.30 / 2 = ~$0.65 and ~$1.80 / 2 = ~$0.90.
For more details, see this section of our separate report on VAS.
- 87
Our reasoning differs somewhat country-to-country:
- Côte d’Ivoire: Our cost per supplement estimate is implausibly low ($0.53) and we have previously heard from Helen Keller that some costs may have been omitted from the information they shared with us.
- Kenya: Our cost per supplement estimate is low ($0.78), and we have low confidence in this estimate because it relies on two coverage surveys, one in 2019 and one in 2020, that may not be representative of all Helen Keller-supported areas in Kenya.
- DRC: Our cost per supplement estimate is implausibly low ($0.58), especially considering that Helen Keller’s program in DRC is relatively new, and we would have expected start-up costs to be high.
- Nigeria: Our cost per supplement estimate is low ($0.72), and Helen Keller didn't report spending by any other actors in Helen Keller-supported regions for these campaigns, other than a small amount of spending by Saving One Million Lives in 2020. We would guess that some other actors’ spending may have been excluded from the totals we received.
See this section of our explanatory notes onwards for further information.
- 88
Helen Keller has informed us:
- In Côte d’Ivoire, the government uses a different model with less training for distributors than in other locations.
- In DRC, there is a lot of pressure from other actors to keep costs low. Helen Keller also attributed low costs to a highly experienced VAS team in DRC.
- In Nigeria, VAS campaigns use a fixed point rather than a door-to-door model, which is likely to keep costs low.
Helen Keller also agreed that costs were likely to be lower in Kenya than other countries, although we are uncertain what specific factors contributed to this. We note that Kenya (like Nigeria) also uses a fixed site + outreach distribution model, which might contribute to lower-than-average costs (more above), although Helen Keller did not cite this as a factor.
Sources: Helen Keller, conversations with GiveWell (unpublished), October 28th 2022 and January 26th, 2023.
- 89
See this row in our cost-effectiveness analysis and our analysis of cost per supplement in this spreadsheet. To calculate this weighted average, we weight our estimates of cost per child in each country by the number of supplements we think Helen Keller has delivered in that country.
- 90
See this column in our cost per supplement analysis.
- 91
Our -17% adjustment for the quality of Helen Keller’s monitoring and evaluation (discussed above) is intended to account for this concern.
- 92
Each year, Helen Keller shares a “room for more funding” report with GiveWell. This contains Helen Keller’s estimates of the funding required to deliver the VAS campaigns it plans to support. In each country, this includes its expectations for how many regions it is aiming to support and how many can be supported by other GAVA partner agencies (UNICEF and Nutrition International). The reports also contain summaries of how many regions were supported by Helen Keller and the other GAVA partner agencies in previous years.
Examples of these reports:
- 93
Our understanding from the information Helen Keller has shared, and conversations with other VAS stakeholders over time, is that the global funding landscape for VAS is not very crowded, relative to some other programs that GiveWell funds.
We think that the main funders of VAS campaigns globally are national governments (through in-kind contributions like staff time, and sometimes through financial support), Global Affairs Canada (GAC) (through grants to Nutrition International and UNICEF), UNICEF's flexible funding, and GiveWell-directed donations. Other NGOs (e.g., the World Bank and World Health Organization) have also provided some financial support for VAS campaigns in some locations. These contributions have varied by country and over time. See this sheet in our cost per supplement analysis for more details.
Typically, in countries with support from multiple external partners, different partners focus on different regions or activities within each country. Our understanding of the way this process works is that Helen Keller, UNICEF, and Nutrition International coordinate on which regions or activities each organization will focus on within each country. Our understanding is that this process is coordinated via the Global Alliance for Vitamin A (GAVA), a forum in which Helen Keller, UNICEF and Nutrition International are the three core partner agencies. GAVA, ‘About’ page. “Core Partner Agencies: UNICEF, Nutrition International, Helen Keller International”. Accessed November 27th, 2023.
- 94
See these rows of our cost-effectiveness analysis for these estimates and details on our country-specific reasoning.
- 95
See this row of our cost-effectiveness analysis.
- 96
For example, we have seen more detailed information from Against Malaria Foundation about other actors’ funding for malaria programs in the locations where it supports insecticide-treated net (ITN) campaigns. See this section of our review of Against Malaria Foundation for more detail.
- 97
Helen Keller, email to GiveWell, November 7th, 2023 (unpublished).
- 98
We see this as concerning because it suggests that, if practiced more widely, non-surveyed areas could have systematically lower coverage than surveyed areas. See the discussion above for more details.
- 99
DRC: “Helen Keller proposed an "Intensive Community-Based Routinization" approach, or a catch-up activity to reach children over a period of 4 to 7 days, twice a year. The approach is implemented by CACs, supported by health facilities, and under the supervision of the health zone, the health directorate, and PRONANUT.
Awareness-raising campaigns are carried out before distribution, over at least seven days. A VAS register and tally sheets are given to each CAC, which are later compiled by health facilities and sent to the health zone (district), which then compile data from all health facilities in their catchment area, and send these to the province. The province aggregates the health zone data before transmitting these to the national level.” Helen Keller Intl, 2023 annual report to GiveWell on Helen Keller Intl’s vitamin A supplementation activities, pg. 19.
Côte d’Ivoire: “In Côte d'Ivoire, vitamin A supplementation is distributed through mass door-to-door vitamin A distribution campaigns in 40 districts, and an hybrid approach is used in 73 others. The hybrid approach consists of routine delivery in primary health care facilities throughout the semesters, and catch-up campaigns are conducted at the end of the semester to reach children who may have been missed by routine services.” Helen Keller Intl, 2023 room for more funding report, pg. 18.
- 100
See our discussion of these audits above.
- 101
This impression is based on many conversations with Helen Keller over time.
- 102
GAVA is a forum in which Helen Keller, UNICEF and Nutrition International are the three core partner agencies. GAVA, ‘About’ page. “Core Partner Agencies: UNICEF, Nutrition International, Helen Keller International”. Accessed November 27th, 2023.
- 103
In 2018, Helen Keller supported VAS campaigns in four countries with GiveWell funding: Burkina Faso, Guinea, Mali, and Côte d'Ivoire. By 2021 its program had grown to nine countries: Burkina Faso, Cameroon, Côte d'Ivoire, DRC, Guinea, Kenya, Mali, Niger, and Nigeria. See this spreadsheet for a breakdown of campaigns by location.
- 104
Between 2018 and 2022 the median coverage in Helen Keller’s coverage surveys was 85%, and the lowest coverage estimated was 59% in one campaign in Mali (Kayes region) in 2020. See this sheet in our analysis of Helen Keller’s monitoring for further details.
Note that our best guess is that these figures are somewhat inflated because of the concerns we list above, but we still interpret them as evidence that Helen Keller is able to scale up programs in new locations relatively quickly.
- 105
Examples:
- “Kenya. Since 2020, Helen Keller has been conducting a study in Siaya county to compare the effectiveness of using community volunteers to distribute VAS routinely in their catchment areas versus distribution through facilities, and multiple outreach platforms including campaigns. The intervention is completed, and data analysis is currently underway. The report is expected to be completed before the end of quarter one in 2022.” GiveWell has since reviewed this report.
- “Niger. In 2022, Niger will start a study to implement and test two interventions for VAS delivery and measure their impact on VAS coverage. The two proposed delivery models are hybrid approaches to routine VAS delivery, providing additional supports to health facilities through the use of community health volunteers for sensitization activities and also offering mop up delivery. It is expected that a cost-effectiveness analysis will be conducted after the pilot of the two interventions.”
Helen Keller, Annual Report to GiveWell on Helen Keller Intl’s Vitamin A Supplementation Activities, 2022, p. 7.
- 106
This understanding is based on multiple conversations with Helen Keller and other VAS stakeholders over time. Additional support for this claim:
- “Experience has shown that relying on routine health facility delivery results in significant decreases in VAS coverage. To reduce this risk, the hybrid model includes the organization of national weeks of intensification of nutrition activities with several other services such as VAS, deworming and screening for malnutrition.” Helen Keller, Room for More Funding Report, July 2022, p. 11.
- 107
See this row of our cost-effectiveness analysis. Note: This range is based on the following locations, and not the full list of locations in our cost-effectiveness analysis: Burkina Faso, Cameroon, Chad, Côte d'Ivoire, DRC, Guinea, Mali, Madagascar, Niger, and five states in Nigeria: Adamawa, Benue, Ebonyi, Nasarawa, and Taraba.
We focus on these locations because they are the locations that GiveWell actively supported in our most recent grant cycle (see our grant page for Helen Keller’s program here). Some columns in our cost-effectiveness analysis are for countries that GiveWell has either considered for previous grants but not yet funded (e.g., Uganda), funded in the past but discontinued funding because we estimate that VAS in that country was below our cost-effectiveness bar (e.g., Kenya), or funded through Nutrition International's VAS program (e.g., Chad). We think that the range used here is the best reflection of the value of Helen Keller's VAS program in locations supported by GiveWell donors.
- 108
See this row of our cost-effectiveness analysis. Note: This range is based on the following locations, and not the full list of locations in our cost-effectiveness analysis: Burkina Faso, Cameroon, Chad, Côte d'Ivoire, DRC, Guinea, Mali, Madagascar, Niger, and five states in Nigeria: Adamawa, Benue, Ebonyi, Nasarawa, and Taraba.
We focus on these locations because they are the locations that GiveWell actively supported in our most recent grant cycle (see our grant page for Helen Keller’s program here). Some columns in our cost-effectiveness analysis are for countries that GiveWell has either considered for previous grants but not yet funded (e.g., Uganda), funded in the past but discontinued funding because we estimate that VAS in that country was below our cost-effectiveness bar (e.g., Kenya), or funded through Nutrition International's VAS program (e.g., Chad).We think that the range used here is the best reflection of the value of Helen Keller's VAS program in locations supported by GiveWell donors.
Organization's Response
Helen Keller Intl wrote the following in response to GiveWell's April 2024 review of Helen Keller Intl.
Published: April 2024
Helen Keller Intl is sincerely grateful for GiveWell's trust and support since 2018, which has enabled our organization to partner with governments in 14 African countries to deliver Vitamin A Supplementation (VAS), contributing significantly to reducing child mortality and blindness. We deeply value GiveWell's rigorous evaluation of the interventions it supports, of the charities that implement those interventions, and the transparency of our partnership. As an organization, we are committed to ongoing improvement, learning from our experiences, and maximizing the impact of our interventions.
We are honored to provide a response to GiveWell's most recent feedback, and we welcome any questions about how our approach is evolving based on this feedback.
Monitoring Our Performance:
Sampling and Frequency of Surveys: For over 20 years, Helen Keller Intl has conducted representative household cross-sectional surveys to monitor the performance of our Vitamin A Supplementation programs. These surveys adhere to the World Health Organization (WHO)-recommended methodology for monitoring mass distribution campaigns, providing reliable coverage estimates for VAS. However, these surveys are complex and costly, involving visits to over 1,000 households in more than 70 randomly selected clusters within large geographical regions. These surveys are invaluable for assessing VAS coverage and understanding the reasons for non-receipt of VAS, enabling us to evolve and improve
To optimize the cost-effectiveness of these surveys, we have not conducted them for every VAS campaign round until now. This decision was based on our experience that when validated coverage in a specific region exceeded 80%, and campaign implementation modalities remained consistent, systematic re-measurement was unnecessary. Given that Helen Keller supports multiple administrative regions in each country, coverage variations occur due to various factors. As a result, surveys have been regionally stratified, and regions for survey selection were based on the challenges faced, prioritizing regions with the highest risk of low coverage. Typical challenges included insecurity, regions with difficult terrains, regions where households and communities are very distant from one another, regions that exhibited low administrative coverage for prior campaigns, or regions where governance structures and practices showed weaknesses.
The selection process we have used could lead to risks of underestimating overall coverage in the program areas we support and therefore cost-effectiveness of our VAS programs. We have focused on regions where it is anticipated that coverage is lower. By only providing GiveWell with coverage rates from these select regions, with anticipated lower coverage, these figures might be misconstrued as representative of all regions we support. Typically non-surveyed regions demonstrate high coverage.
Conversely, there is a risk that the impacts of carrying out surveys in selected regions drive improved performance and that extrapolating these improved coverage rates to all areas we support results in an over-estimation of coverage. The regions under scrutiny for monitoring could feel motivated to enhance their performance. While this is a desirable outcome for program performance, it raises the possibility of overestimating coverage levels across our program areas.
To address these challenges, we are revising our measurement approach. Starting in the first semester of 2024, we will change our sampling approach to provide GiveWell with coverage estimates that measure all regions supported by Helen Keller Intl within a country. The new methodology will produce an even more reliable estimate of cost-effectiveness. However, the new methodology will also likely be more expensive, and therefore increase costs. It's important to note that these additional costs will be factored into GiveWell's cost-effectiveness calculations, potentially affecting the cost per supplement distributed.
While committed to implementing these changes, we also remain committed to identifying and supporting lower-performing regions, which is the primary objective of coverage surveys. We plan to add strata to our sampling methodology, allowing us to efficiently target and address implementation challenges in these areas we have pre-identified as at risk of under-performance.
Reliability of the Surveys: Helen Keller is committed to strengthening the reliability of our surveys by contracting independent teams of monitors who will be revisiting 10% of households surveyed to verify the consistency of information provided by children's caregivers with their initial responses. These monitors will not be linked with Helen Keller, the survey teams, or have had any involvement with the VAS campaign. They will be sent to a random selection of 10% of the clusters surveyed immediately after the survey team has completed them. They will conduct an exhaustive census of the cluster and revisit the same households already visited by the survey team to administer a simplified questionnaire focusing on the receipt of VAS. Survey teams will not be made aware of which clusters will be re-visited but will be informed of the independent monitoring practice.
In addition, interviews of caregivers by the survey teams will be recorded, and a random selection of these interviews will be listened to by independent monitors and compared with data entered for this household to verify data entry accuracy. This systematic approach will be implemented in all surveys and will be reported consistently and in detail in all survey reports.
Additional reports will include a comparison between the survey team and independent monitor census and survey results, and the average time spent by survey teams in each cluster and household.
Recognizing GiveWell's concerns regarding recall bias, we will adopt the recommendation to first inquire whether caregivers recognize and can name the vitamin A capsule before asking whether the child has received it. We have also agreed with GiveWell to investigate whether children received the capsule during the campaign and through other means during the semester. Additionally, we are exploring whether children possess cards or booklets for VAS records and whether VAS deliveries were recorded during the campaign. Comparing oral confirmation by caregivers of VAS receipt with recording of this receipt in health cards will increase the reliability of the answers. Coverage reported will consider data from available cards and from caregivers oral report, as there is a risk that if distributors did not record VAS receipt in the child card during the campaign or if the proportion of children with cards at home is low, only considering coverage from cards will significantly underestimate the true coverage of VAS.
Finally, we plan to incorporate a beneficiary satisfaction component in all surveys to assess caregivers' treatment and service satisfaction provided by distributors, as experience has shown that satisfied caregivers are more likely to adhere to VAS distribution, and as a way of monitoring whether distributors provide adequate information to caregivers.
Independent Monitoring: The same monitors who will be revisiting 10% of the survey clusters for data quality verification are also monitoring campaigns. Independent monitoring involves sending teams of monitors to verify, during a campaign, if children have received VAS. This process follows the WHO's methodology for polio campaigns and employs a two-stage sampling approach. Communities are selected based on their risk of being missed, considering factors such as distance from district capitals, urban characteristics, accessibility, and previous VAS coverage. Monitors survey a minimum of 10 households in each of the three selected communities daily, totaling at least 30 households per monitor per day over a four-day campaign.
If an independent monitor finds at least one household not covered by distributors, they are required to visit an additional five households. If at least three households out of the 15 surveyed were not covered, the information is communicated to local authorities for the prompt return of distribution teams. If fewer than three households were not covered, the monitor supplements the children.
Starting in 2024, Helen Keller will prepare comprehensive campaign reports that will include the main steps of campaign preparation and implementation and results of campaign distributions, independent monitoring, and coverage surveys.
Cost Variations Between Countries:
Helen Keller utilizes a range of ratios and rules to allocate budgets to countries, maintaining cost-effectiveness (approximately USD 0.35 per distributed capsule) within regions we support. It's essential to note that these calculations only consider funds directly utilized by Helen Keller Intl, excluding costs not directly covered by our teams, such as the salaries of Ministry of Health management teams or health workers. However, we are actively developing tools and guides for conducting cost-effectiveness assessments, which will be carried out in selected countries in 2024, including Côte d'Ivoire and the Democratic Republic of Congo (DRC). These assessments will include all costs associated with campaigns, including costs borne by partners and Ministries to provide a more comprehensive understanding of the cost-effectiveness of VAS campaigns.
Decisions regarding fund allocation vary by country and semester. Three months before a campaign, Helen Keller collaborates with partners to assess their available financial resources for VAS and the number of administrative regions they can cover. This initial assessment ensures that no region is left unsupported. GiveWell's flexibility in allocating resources has been critical in maintaining high coverage when other resources are not available. Once regions that need our support are identified, we consider the specific context of each region (infrastructures, terrain, population, etc.) to allocate funds needed for the campaign. Helen Keller continuously monitors the cost drivers of the campaigns we support to increase the efficiency and cost-effectiveness of our programs and will provide GiveWell with a detailed analysis of cost drivers in all supported countries.
We are also collaborating with our partners to improve the sharing of accurate and timely financial information concerning actors other than Helen Keller. Recognizing that different actors have various policies regarding financial information sharing, we acknowledge that this may affect the reliability of shared financial data. However, as a first step, Helen Keller is partnering with UNICEF on the implementation of cost-effectiveness studies in several countries that will help identify how to monitor costs on a real-time basis.
Missing or Unclear Information:
The VAS implementation landscape is evolving, and there is not a clear divide between 'campaign' and 'routine' but rather a continuum of approaches to VAS delivery. We acknowledge that Helen Keller could distinguish more clearly between mass campaigns and hybrid models, such as those implemented in Côte d'Ivoire and DRC. Compiling such details will also be helpful in sharing experiences between our country teams and supporting our teams to learn from one another. We are committed to thoroughly documenting each approach and sharing them for greater reflection and learning.
Qualitative Assessment of Helen Keller:
Helen Keller appreciates the robust monitoring of eight qualitative indicators by GiveWell. We are working hard to consider what they mean for our programs and feel they can help us improve our overall impact, particularly in monitoring practices and information sharing. In 2023, we partnered with ID Insight to refine our Monitoring and Evaluation strategy for VAS, identifying and defining 70 indicators to monitor the preparation and implementation processes of VAS services and assess their performance. We adopted the DHIS2 platform for monitoring VAS programs across all 14 supported Sub-Saharan African countries, commencing the rollout at the end of 2023.
Starting in the first semester of 2024, we will utilize Power BI dashboards for data analysis and sharing. We relish our role in providing donors, policymakers, partners, and other stakeholders with reliable VAS information and sharing best practices, and we are now exploring the development and dissemination of reports, so that the greater community may all learn from our efforts.
In conclusion, we appreciate GiveWell's trust and support and the many donors they have inspired to create positive change for the world's children. Just as importantly, we appreciate the opportunity to contribute our reflections here and to continually learn and reflect on how we, together, as global citizens can continue to reach millions of children with life-saving and sight-saving vitamin A.