We have published a more recent review of this organization. See our most recent review of KIPP.
More information:
KIPP is a network of more than 50 charter schools (mostly grades 5-8) across the U.S., focusing on improving outcomes for disadvantaged youth. The KIPP Foundation is responsible for recruiting and training principals, negotiating with the state to start up schools, and providing additional assistance in starting up schools. All students in the school's vicinity are eligible for admission, which is determined by random lottery, and tuition is free. (KIPP pays for its operations through a combination of funds from the local public school system and donations.) We believe that there is a relatively strong (though not ironclad) evidential case that KIPP is improving academic outcomes in a significant and measurable way (one that shows up in test scores) for disadvantaged youth.
KIPP spends approximately $13,000-19,000 per student per year. Most of this expense is covered by state funds it receives as a public school replacement; excluding these funds, KIPP's expenses come to $2,000-8,000 per student per year.
Table of Contents
What do they do?
KIPP focuses on selecting school leaders and teachers, then giving them autonomy (and support). Its schools are defined more by the people in them (and the process that selects these people) than by any particular set of practices.
In evaluating KIPP, we dealt mostly with the staff of KIPP NYC, a network of four schools in New York City; funding and legal structures vary from state to state, and all discussion below is of these schools in particular. However, in trying to get a sense for the success of the "KIPP model" and whether it impacts academic outcomes, we examined data from all KIPP schools across the nation. We also spoke with staff about the role of the KIPP Foundation, a national organization charged with KIPP's startup-related operations (recruiting and training school leaders; providing administrative and financial support for schools in their planning stages as well as during their opening years).
School startup
The KIPP Foundation selects and trains school leaders and provides legal and administrative assistance as they create new schools. Each prospective school leader interviews directly with KIPP's founders and CEO, in addition to undergoing evaluations of their teaching and adult leadership abilities (according to the KIPP website). Those selected enter a year-long training program, the Fisher Fellowship, which combines academic and management training during the summer and residencies at KIPP schools during the fall (Attachment A-2 Pg 4). KIPP states that "the coursework in the summer covers instructional, organizational, and operational leadership, and the classes are taught by esteemed leadership and education professors, KIPP school leaders, and members of the KIPP Foundation."
Running the schools
Once started, a school runs at the same budget as a typical public school, though part of its budget may be privately funded (for example, 20% of a KIPP NYC school's budget is privately funded - see below). Principals generally have a great deal of control and autonomy within their school (see, for example, Attachment A-1 Pg 3 and Attachment A-3 Pg 2); from our impressions, KIPP schools are defined less by a particular set of prescribed practices than by the people who run them. However, all KIPP schools share a set of five broad operating principles (known collectively as the "Five Pillars").
As one of these shared operating principles, all KIPP schools operate on an extended school day and calendar year: KIPP schools typically run 7:25 a.m. – 5:00 p.m. Monday through Thursday; 7:25 a.m. – 3:00 p.m. Fridays; alternating Saturdays from 8:00 a.m. – 1:00 p.m.; and for three weeks in July. KIPP states that this translates to 67% more time in the classroom compared to a typical public school (Attachment A-3 Pg 1).
In New York City, KIPP funds a Shared Services Team that "provides development, operations, finance, technology, and human resources" for all KIPP schools in New York. The intent is to allow KIPP principals and teachers to focus their efforts on educating their students as opposed to administrative duties (Attachment B-1).
Other programs
KIPP also runs a variety of other programs, aiming to help KIPP students get as good an education possible before and after attending KIPP. KIPP NYC, in particular, runs the following programs in addition to the schools themselves (Attachment B-1):
- KIPP to College provides academic support to alumni of KIPP middle schools throughout high school, college and beyond.
- KIPP Opportunity Fund provides financial assistance to KIPP alumni in three main areas: tuition assistance (high school or college), summer internship stipends (high school or college), and education support stipends (books, travel, sports equipment, etc.).
Does it work?
In our view, empirical data is central to the case for KIPP. We find it highly plausible that pulling together talented educators, and giving them support and autonomy, could produce schools that are better able to focus on students' needs - but it all depends on whether the people KIPP selects are in fact unusually capable.
We don't have data on later life outcomes (college performance, job performance, etc.) for KIPP students, but we do have a significant amount of data on achievement test scores, which we believe implies (as detailed below) that KIPP schools across the nation are consistently and significantly improving children's academic performance.
Quasi-experimental studies
Two quasi-experimental studies show KIPP students substantially outperforming comparison students. The "comparison groups" used aren't ideal and may be subject to various sorts of bias (discussed further below), but the evidence provided by these studies is encouraging and provides context for the larger-scale analysis discussed in the next section.
Study 1: KIPP Diamond Academy
Attachment B-4 compares the scores of 5th and 6th grade KIPP students, at KIPP Diamond Academy in Memphis, to those of a "comparison group" of non-KIPP students; the latter group is matched to the former based on previous test scores and other demographic factors (Pg 1). It finds that KIPP students outperformed their matched counterparts: each KIPP class had a higher proportion of students scoring "proficient" or "advanced" for both reading and mathematics tests, and in some cases the two groups differed by upwards of 20 percentage points (Attachment B-4 Pg 13). (This difference is statistically significant overall - see Attachment B-26 Pg 142).
Because KIPP and comparison students were "matched" based on previous test scores (as described above), the difference cannot simply be an artifact of KIPP's attracting higher-performing students. However, it may be an artifact of "selective attrition," a general concern we discuss more below: those students who dropped out from KIPP, presumably its weaker students, were excluded from the study, which may bias the scores of the "KIPP group" upwards in a way that doesn't reflect the actual effect of KIPP.
Study 2: KIPP Ujima
Attachment B-3 studied the four cohorts that entered 5th grade from 2002-05 over the course of their careers at KIPP Ujima, in Baltimore. The researches divided all students into four groups: (a) those that advanced with their class; (b) those that were retained (i.e., did not advance to the next grade level); (c) those that left KIPP entirely; and (d) those that arrived at KIPP in 6th grade or later. Isolating those students who stayed at KIPP from those who left, were retained, or arrived, the researchers found significant improvements in test scores for KIPP students (Attachment B-3 Pgs 10-14).
This leaves a concern about "selective attrition," as in the study discussed immediately above, but in this case we can correct partly for it by factoring in the performance of KIPP students who dropped out or were retained. Our calculation, available in Attachment B-27, shows that the over-performance of KIPP students is still substantial after this adjustment. Our calculation does not include students who dropped out in their first month of school (these students are not included in the study - see Attachment B-3 Pg 14).
Other studies
KIPP also provided us with four other studies - all of which are also available on KIPP's website - that all show KIPP students outperforming non-KIPP students. However, we do not find these reports compelling, because none attempt to control for "selection bias," i.e., the possibility that KIPP students may be outperforming non-KIPP students to begin with, regardless of the school they attend. The studies we cite above both address this concern more strongly (while still not perfectly).
Analysis of all publicly available test scores
Note: this analysis was completed during 2008. We plan to update this analysis with more recent data in the first quarter of 2010.
We found that students at KIPP schools consistently and dramatically improve their performance on standardized math and reading exams between 5th grade (the year students enroll) and 8th grade (the year they graduate) - more than students at nearby schools do. This is true across schools in different states, even when we attempt to adjust that performance for concerns about "selective attrition" (discussed below).
We collected all publicly available data on KIPP students' scores on state-mandated standardized tests, giving us information on 23 of the 57 existing KIPP schools (covering 8 of the 18 states in which KIPP has schools). Some data was unavailable because, among other reasons, some states don't publish test data on the internet or don't test the grades covered by KIPP schools, or the schools are so new that no scores are available yet. The web addresses for the sites we used to gather the data along with the raw data itself is located in Attachment B-2.
We segmented the data we collected into three groups:
- Group 1: cohorts for which we only have 5th and 6th grade data.
- Group 2: cohorts for which we have 5th-7th grade data.
- Group 3: cohorts for which we have 5th-8th grade data.
(Note that the scores we have start at 5th grade and likely include some portion of KIPP's impact on 5th grade scores; we don't know the exact dates when the tests are given.)
For each group, we looked at test scores for both KIPP students and comparison students: students at neighboring school districts, using the same data sources. In discussing these scores below, we focus on the percentage proficient. Each state sets its own definition for proficiency; in New York, it includes students testing at levels 3 and 4 (see this summary). The levels are defined here. (The levels we included for each state are in Attachment B-2 on the 'State Proficiency Definitions' tab.)
The broad picture is similar for all three groups; the charts below show data for Group 2 (Group 1 does not give a full picture of the trend, and Group 3 has small sample size).
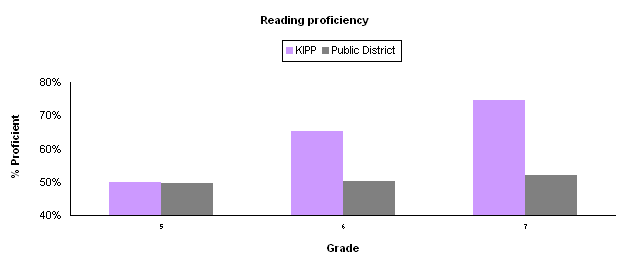
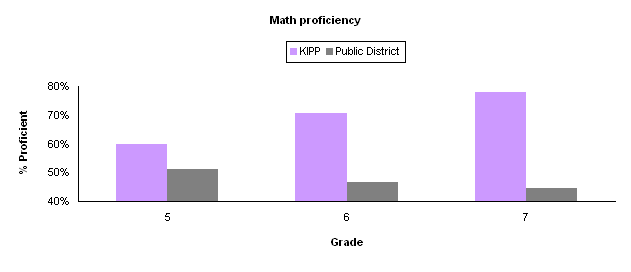
The table below shows the overall "percentage proficient" figure (discussed above) for all KIPP cohorts for which we have data, along with the same figure for the "Comparison" students.
| Group | Test | Grade 5 | Grade 6 | Grade 7 | Grade 8 |
|---|---|---|---|---|---|
| Group 1 | KIPP: Math | 72% | 83% | - | - |
| Group 1 | Comparison: Math | 60% | 59% | - | - |
| Group 1 | KIPP: Reading | 66% | 79% | - | - |
| Group 1 | Comparison: Reading | 63% | 63% | - | - |
| Group 2 | KIPP: Math | 71% | 83% | 88% | - |
| Group 2 | Comparison: Math | 62% | 58% | 56% | - |
| Group 2 | KIPP: Reading | 67% | 81% | 86% | - |
| Group 2 | Comparison: Reading | 65% | 65% | 65% | - |
| Group 3 | KIPP: Math | 77% | 89% | 87% | 90% |
| Group 3 | Comparison: Math | 65% | 54% | 49% | 48% |
| Group 3 | KIPP: Reading | 73% | 86% | 85% | 89% |
| Group 3 | Comparison: Reading | 66% | 64% | 64% | 69% |
The table below shows the differences from the table above (each "Comparison" row is subtracted from the KIPP row above it). KIPP students outperform non-KIPP students starting in 5th grade, which could indicate that they are simply better students to begin with (although it could also indicate the beginnings of a "KIPP effect," as these test scores are from midway through the year). However, the difference jumps significantly after one year.
| Group | Test | Grade 5 | Grade 6 | Grade 7 | Grade 8 |
|---|---|---|---|---|---|
| Group 1: | KIPP - Comparison Difference: Math | 11% | 24% | - | - |
| Group 1: | KIPP - Comparison Difference: Reading | 4% | 16% | - | - |
| Group 2: | KIPP - Comparison Difference: Math | 9% | 25% | 32% | - |
| Group 2: | KIPP - Comparison Difference: Reading | 2% | 17% | 21% | - |
| Group 3: | KIPP - Comparison Difference: Math | 12% | 34% | 39% | 42% |
| Group 3: | KIPP - Comparison Difference: Reading | 7% | 22% | 21% | 19% |
Concerns about the "churn effect"
We know from several studies (detailed below) that at least some KIPP schools experience significant churn, i.e., some existing students leave and are replaced with other students on the waitlist. Because our analysis looks at class aggregate scores, it is possible that the apparent improvement in scores we document above is really due to a change in class composition: poorer-performing students may leave and higher-performing students may arrive, which would create the appearance of improving test scores regardless of KIPP's actual impact. The question we analyze below is whether this effect, the "churn effect," could be behind the apparent improvement in test scores discussed above.
We have limited information about (a) the number of students who arrive and those who leave and (b) the extent to which entering students are more capable than leaving students. The information we do have comes from three papers: (a) the KIPP Ujima paper mentioned above (Attachment B-3 Pgs 10-14), (b) an unpublished paper by Brent Maddin, a doctoral candidate at the Harvard Graduate School of Education, on KIPP Gaston College Preparatory in North Carolina (Attachment B-5 Pg 10), and (c) the KIPP Diamond Academy study mentioned above (Attachment B-4 Pgs 7-9). All three papers provide data (for a particular school) on the number of students who leave; the KIPP Ujima paper shows the performance of those who leave and those who arrive, and the KIPP Diamond Academy paper provides performance data only for those who arrive.
While attrition and retention trends at just three schools can't be assumed to perfectly represent student movement in the organization as a whole, we think that they do adequately demonstrate that such movement could be a source of bias in evaluations. The three papers show that:
- 10%-25% of students who enroll in 5th grade at KIPP Ujima, Diamond Academy, and Gaston College Preparatory do not progress with their class to 6th grade (either because they leave or are retained). Students also leave following 6th and 7th grades, though far fewer do so.
- Students who left KIPP Ujima scored roughly equivalent to students at district schools, while remaining students scored significantly above district averages.
- Incoming students at KIPP Ujima scored significantly better than average students at nearby district schools, but not as well as existing KIPP students. Incoming students at KIPP Diamond Academy scored significantly better than average students at nearby district schools; they scored better than existing KIPP students on reading and language arts, worse on math.
To assess the impact of "churn" on KIPP's nationwide performance, we estimated what the improvement of KIPP students from 5th to 6th grade (where most attrition/addition occurs) would be, under varying assumptions for:
- Churn: how many students left and were replaced each year.
- Performance of leavers. If we assume that those who left KIPP were among the weakest performers, this would imply that some of the effect documented above is illusory (i.e., rising test scores are caused by weaker performers' leaving the school, not by existing students' improving).
- Performance of enterers. If we assume that those who entered KIPP were strong performers, this would imply that some of the effect documented above is illusory (i.e., rising test scores are caused by stronger performers' entering the school, not by existing students' improving).
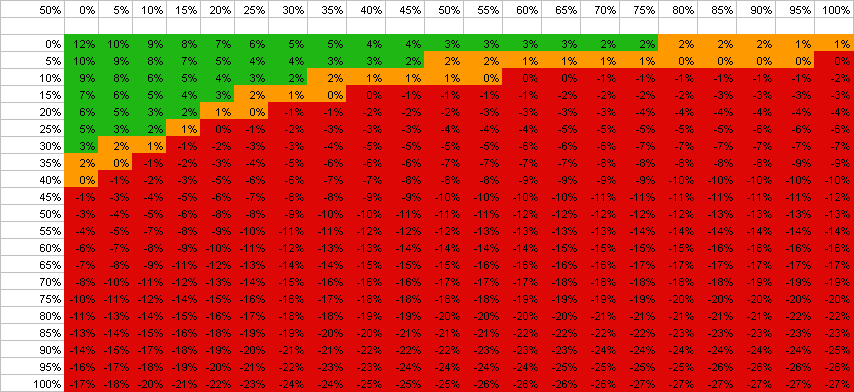
Below is a summary of our findings. For each of the three assumptions about churn below, we give a table that illustrates what the "true" difference between KIPP and "Comparison" students would be under a wide range of different assumptions about performance of leavers and performance of enterers. In each table, the x-axis is our assumption about the difference (in the "percentage proficient" figure) between leavers and "Comparison" students, while the y-axis is our assumption about the difference (in the "percentage proficient" figure) between enterers and KIPP students; each cell shows what the corresponding assumptions would imply about the "true" difference between KIPP and "Comparison" students.
- When assuming low levels of churn (0-10%), the KIPP effect remains apparently strong regardless of our assumptions about performance of leavers and performance of enterers. The full table is here.
- When assuming 30% churn (i.e., 30% of KIPP students leave each year, and are replaced by entering students), the KIPP effect can be explained away completely by assuming: (a) leavers are 80% worse (in "percentage proficient" terms) than "Comparison" students, and enterers are equivalent to "Comparison" students; or (b) leavers are 20-40% worse (in "percentage proficient" terms) than "Comparison" students, while enterers are equivalent to KIPP students. The full table is here.
- When assuming 40-50% churn (i.e., 40-50% of KIPP students leave each year, and are replaced by entering students), the KIPP effect can be explained away completely by assuming: (a) leavers are equivalent (in "percentage proficient" terms) to "Comparison" students, and enterers are equivalent to KIPP students; or (b) leavers are 25% worse (in "percentage proficient" terms) than "Comparison" students, while enterers are 25% better. The full table is here.
In sum, all of the scenarios under which the "KIPP effect" is illusory are scenarios that assume very high churn (much higher than observed in the cases we do have information on), and significant differences between leavers and enterers (differences that are on par with, or more extreme than, differences observed in the cases we do have information on). We believe it is possible that the "churn effect" explains the large degree to which KIPP students outperform "Comparison" students - but we don't find it likely, and would thus bet that the impact of KIPP itself is significant.
What does it cost?
Note: this analysis was completed during 2008. We plan to update this analysis with more recent data by the end of 2010.
Attachment D-2 breaks out KIPP NYC's costs (for the 2007-2008 year, projected as of late 2007). The following summary lists KIPP's direct per-student costs, as well as the implied per-student costs of various programs it runs that are not associated with a particular school, in order to give a full sense of how much funding KIPP expends per student serves.
- When looking only at direct operating expenses of the four schools, KIPP lists total expenses of $12,712,349 for a total of 949 students, implying $13,396 per student. Note that a significant portion of these expenses are covered by "per-pupil funding" that KIPP receives from the state as an alternative to public schooling; state per-pupil funding covers $11,023 per student, leaving $2,373 per student to be covered by grants and private support.
- KIPP also lists several general support programs, not associated with a particular school, with total expenses of $ $3,672,935, or an additional $3,870 per student.
- None of these figures include the expenses of The KIPP Foundation, a national organization that focuses on starting new schools. (For more information on the KIPP Foundation, see the KIPP website.) In 2006 (according to its IRS Form 990, available on Guidestar), the KIPP Foundation had total expenses of $19.9 million, which implies an additional $1,423 for each of KIPP's current 14,000 students served. (Note the limitations of this per-student figure: the KIPP Foundation's expenses are focused on expanding to serve new students, not on serving existing ones).
Depending on what one wishes to include in "per-student" expenses, the total cost of the program for NYC students is between $13,000 and $19,000 per student, $11,023 of which comes directly from state per-pupil funding.
Note that KIPP plans to double the number of schools it operates in the next five years.
Conclusion
We believe the empirical evidence suggests (while not conclusively establishing) that KIPP is succeeding in its mission of bringing together and supporting talented educators, in order to provide a superior education for disadvantaged students - and that it is succeeding consistently and at scale (across a national network of over 50 schools). We recommend KIPP above all other organizations in this cause.
Attachments
A. Application and response
- Attachment A-1: Application response - Round 1
- Attachment A-2: Application - Round 2
- Attachment A-3: Application response - Round 2
B. Program related attachments
- Attachment B-1: Email from Casey Karel 2008 2 29
- Attachment B-2: Publicly Available Test Data
- Attachment B-3: “The Baltimore KIPP Ujima Village Academy, 2002-2006: A Longitudinal Analysis of Student Outcomes” – Iver and Farley-Ripple (2007)
- Attachment B-4: “KIPP DIAMOND Academy – Analysis of Year 2 (2004-2004) Student Achievement Outcomes” – Gallagher and Ross (2005)
- Attachment B-5: Draft of: “Attrition and Its Impact on Baseline Test Scores at KIPP Gaston College Preparatory” – Maddin (2007)
- Attachment B-6: High Schools Attended by KIPP NYC Alumni as of 9/1/07
- Attachment B-7: Colleges Attended by KIPP NYC Alumni as of 9/1/07
- Attachment B-8: KIPP NYC Parent, Teacher, and Student Commitment Contract
- Attachment B-9: KIPP NYC School Profile Sheets
- Attachment B-10: KIPP NYC Self-Checking Guide
- Attachment B-11: “An Evaluation of Achievements of Students Attending KIPP STAR” (2006)
- Attachment B-12: SAT 9/10 National Score Equivalence Performance Summary for 2011 Cohort at KIPP Academy, New York
- Attachment B-13: SAT 9/10 National Score Equivalence Performance Summary for 2011 Cohort at KIPP STAR Academy
- Attachment B-14: SAT 9/10 National Score Equivalence Performance Summary for 2012 Cohort at KIPP Academy, New York
- Attachment B-15: SAT 9/10 National Score Equivalence Performance Summary for 2013 Cohort at KIPP Academy, New York
- Attachment B-16: B-16: SAT 9/10 National Score Equivalence Performance Summary for 2014 Cohort at KIPP Academy, New York
- Attachment B-17: SAT 9/10 National Score Equivalence Performance Summary for 2013 Cohort at KIPP AMP Academy
- Attachment B-18: SAT 9/10 National Score Equivalence Performance Summary for 2014 Cohort at KIPP AMP Academy
- Attachment B-19: SAT 9/10 National Score Equivalence Performance Summary for 2013 Cohort at KIPP Infinity School
- Attachment B-20: SAT 9/10 National Score Equivalence Performance Summary for 2014 Cohort at KIPP Infinity School
- Attachment B-21: SAT 9/10 National Score Equivalence Performance Summary for 2012 Cohort at KIPP STAR Academy
- Attachment B-22: SAT 9/10 National Score Equivalence Performance Summary for 2013 Cohort at KIPP STAR Academy
- Attachment B-23: SAT 9/10 National Score Equivalence Performance Summary for 2014 Cohort at KIPP STAR Academy
- Attachment B-24: “Evaluating Success: KIPP Educational Program Evaluation” – New American Schools (2002)
- Attachment B-25: KIPP - 2006 summary of achievements
- Attachment B-26: Peer-reviewed KIPP Diamond study
- Attachment B-27: Excel file of KIPP Ujima data
C. Organization related attachments
- Attachment C-1: IRS 501C3 Approval Letter
- Attachment C-2: KIPP NYC Staff Bios
- Attachment C-3: KIPP NYC Board of Directors
D. Financial documents
- Attachment D-1: KIPP Infinity Financial Statement June 2006
- Attachment D-2: KIPP NYC Budget 2007-08 (withheld due to confidentiality request)
- Attachment D-3: KIPP Academy Financial Statement (June 2006)
- Attachment D-4: KIPP AMP Academy Financial Statement (June 2006)
- Attachment D-5: KIPP Star College Prep Financial Statement (June 2006)