Note: the review below was completed in early 2010. Our current review of SEF is available here.
Summary
The Small Enterprise Foundation (SEF) is a microfinance institution operating primarily in the Limpopo province of South Africa.1 SEF is currently expanding into the Eastern Cape, Mpumalanga, and North-West provinces.2 (For more on microfinance, see our overview of microfinance.)
We reviewed SEF in late 2009 as part of our process to distribute $250,000 in funds to an economic empowerment organization in Sub-Saharan Africa. In our investigations of microfinance, we had had trouble finding an organization that could answer what we consider to be key questions about microfinance, and we conducted a search for non-U.S. organizations in order to find one.
SEF shows a strong focus on collecting the information necessary to assess its social impact, including (a) data on how many clients are dropping out of the program (and why); (b) data on whether SEF is succeeding in its attempt to target people with low incomes.
We believe that SEF stands above every other microfinance institution we have reviewed for its strong commitment to self-evaluation. Nevertheless, we have concerns about SEF's social impact, particularly regarding its substantial dropout rates. (For more on this general issue, see our blog post, "Is borrowing good for the borrowers?")
Table of Contents
What do they do?
The Small Enterprise Foundation (SEF) is a microfinance institution (MFI) operating primarily in the Limpopo province of South Africa. SEF provides loans to groups of people, 96% of whom are women.3 The majority of loans are for 6 months, with repayments due monthly. SEF also offers 4 and 10 month loans paid monthly, and 4 and 6 month loans for which repayments are due every 2 weeks.4
SEF does not provide savings services, but requires loan recipients to save in accounts administered by independent institutions.5 SEF stated to us that it does not provide savings services because of the high cost and difficulty of doing so, and noted that other institutions in the area provide "reasonable" access to savings services.6 It does not provide insurance services.7
Key questions about social impact
In evaluating SEF, we have used our key questions for evaluating microlending charities. The sections below cover its answers to our key questions (see the previous link for why we consider these questions important).
We feel that SEF is likely succeeding in targeting people with very low incomes, and seeing genuinely high repayment rates from participants. We have some concerns about whether its clients are benefiting from the loans, especially in light of substantial dropout rates. We feel that SEF stands above other microfinance institutions we've found in assessing and addressing these questions.
Is the organization focused on social impact?
We are not fully confident in SEF's social impact; we are particularly concerned about its relatively high client dropout rates. However, SEF stands out from other microfinance institutions for its strong commitment to self-evaluation: not only does it provide loans with high repayment rates, but it is collecting the information necessary to assess whether these loans are helping clients (including information on dropout rates, which is often not provided by other microfinance institutions).
Some of the issues discussed below may sound discouraging, but in our view, it is highly encouraging that SEF is collecting and sharing the information necessary to discuss them. Other microfinance charities we have examined have not shared the information necessary to assess issues like clients' dropping out, harassment by officers, and overindebtedness.
In our view, an organization that consistently collects, assesses and shares important information is a better bet for a donor than one that does not.
Other examples of SEF's commitment to collecting, analyzing and learning from important information about social impact:
- In mid-2009, SEF interviewed 30 clients "to investigate reasons for SEF's increased arrears and dropout rate since January 2009."8
- SEF paid for an evaluation by the independent microfinance evaluating M-CRIL, receiving its third highest rating (out of nine).9
- SEF produces, and publicly posts on its website, an annual management report that assesses organizational growth, financial health and self-sufficiency, client drop out rates, human resource development, changes in client well-being, and future plans.10
How frequently do borrowers drop out of the program?
Between April 2008 and September 2009, SEF's drop out rate (calculated monthly) varied between 18% and 24%.11 SEF defines its drop out rate as the number of clients who completed a loan in the six months prior to a given date and did not take out a subsequent loan in that period or within one month following the end of the six month period divided by the total number of clients who completed a loan in the six months prior to the end of the period (example in footnote12 ).
SEF's drop out rate is below the 28% average of dropout rates for microfinance institutions that report this data,13 but still seems substantial. It appears that clients are primarily dropping out due to dissatisfaction with the program, not just choosing not to borrow again because their needs have been met.
For more information on microfinance drop out rates and how they are calculated, see our microfinance glossary.
Does SEF monitor why borrowers drop out?
SEF conducts periodic surveys to determine why clients are dropping out of programs. A 2007 survey of 79 dropouts gave the following reasons:14
- Group and centre conflicts (i.e. being required to repay loans for group members who fail to repay): 44%
- Family/ conflicts: 27%
- Business failure: 24%
- Job/government grant: 20%
- SEF staff: 3%
- Relocation: 1%
- Taking a break: 1%
SEF interviewed 17 dropouts in 2009 to determine why dropout rates had increased.15 The main reason given for dropping out was distrust of staff members who used clients' savings to pay group loans without the clients' knowledge, required clients to attend long fortnightly meetings, and were even accused of committing fraud.16
SEF reports that it considers its drop out rate to be a key metric of how well it is doing. SEF's loan officers are rewarded for maintaining low drop out rates (as well as recruiting new clients and maintaining a high portfolio at risk ratio).17
Does SEF prevent client over-indebtedness?
SEF determines the size of a loan based on how much savings the client has and the capacity of her business as judged by the loan officer.18 The independent rating agency M-CRIL considers these "reasonable systems to assess client borrowing capacity."19 There are some questions, however, about whether staff consistently implement these systems as intended.20
In at least one area, however, access to other sources of credit has resulted in clients' taking out more loans than they are able to repay (see "Other issues" section below).
Are borrowers protected against harassment by loan officers and group members?
Only 3% of clients cited "issues with SEF staff" as the reason they dropped out of the program.21
SEF states that it keeps close track of repayment rates, savings and attendance at group meetings in order to be able to respond quickly to potential issues.22 M-CRIL states that client protection is "partially monitored."23
We have not seen information on whether SEF has a system for responding to harassment in particular or on how often harassment occurs.
Loan officers are rewarded for maintaining a high repayment rate and disbursing new loans.24 It is possible that such incentives could lead to loan officers pressuring clients to repay or to take out loans they wouldn't otherwise have taken out. On the other hand, loan officers are also rewarded for maintaining a high client retention rate, which may lead to better treatment of clients.
Other issues
SEF's impact may be diminished if the area in which its works has strong alternative sources of credit. A 2009 report by M-CRIL claimed that "None of the clients are a member of another MFI,"25 but a 2003 report stated that SEF faced competition from two other programs,26 and the M-CRIL report noted that SEF may be moving into areas where other microfinance services exist.27
A 2009 report noted that some clients were becoming overindebted in "the North Zone" where clients have access to other sources of credit, including another MFI.28
What interest rates does SEF charge?
SEF appears to charge high interest rates on its loans, in the range of 6-8% per month (equivalent to 71-89% APR and 99-140% EIR).29
For context, a low-risk loan in South Africa, as measured by the 1-year interest rate,30 cost 7.24% as of June 18, 2010 (equivalent to about 0.6% monthly).
For more information on microfinance interest rates and how we calculate the cost of a loan to borrowers, see our microfinance glossary.
What is SEF's repayment rate?
It appears that a very high percentage of SEF's loans are repaid. We calculated a conservative estimate of SEF's "collection rate" for January 2007 to December 2008: the percentage of money disbursed during this period that was repaid by the first two quarters of 2009. We estimate that this rate was at least 99.0% over this period.31 This lower-bound "collection rate" corresponds to approximately a 4% annual loan loss rate (i.e. percent of loan portfolio that is lost per year).32 Note that:
- This rate does not treat loans that were repaid late (by mid-2009) differently from loans that were repaid on time.
- SEF's reported loan loss rates on MixMarket for 2007 and 2008 are 1.57% and 1.23%, respectively.33 Though these figures may not capture the full picture (some bad debts may not have been written off), it suggests that our estimate is quite conservative and SEF's true repayment rate may be higher.
Though we have had to do a fair amount of estimating and approximating, our understanding of SEF's "repayment rate" is much clearer than our understanding of the average microfinance institution's "repayment rate." These rates often leave significant room for interpretation and do not lend themselves even to conservative estimates of the "true" repayment rates.
For more information on collection rates and other forms of microfinance repayment rates, see our microfinance glossary.
What are SEF's clients' standards of living?
SEF aims to serve people with very low incomes, and there is some evidence that it is successfully doing so.
SEF works in one of the poorest provinces in South Africa.34 Within this area, SEF targets poor clients through "participatory wealth ranking" (PWR) where "members of a village define conditions of poverty in their village and rank community members according to these conditions...Those ranked poorest by the participants are eligible for membership" in SEF loan groups.35 In 2000, independent evaluators did an assessment of whether this targeting method was resulting in SEF's serving the poor.36 They compared "poverty scores" from random samples of new clients and non-clients and found that clients in the targeted program were poorer on average than non-clients.37 Poverty scores were based on a such indicators as condition of house, quality and quantity of food, education of household members, and assets owned.38
SEF also runs a non-targeted program, which accounts for 32% of loans.39 Clients in this program were found to be less poor on average than non-clients.40 SEF has said that this program is not being expanded.41
A representative survey42 done by SEF in 2007 on 625 clients43 in the poverty-targeted program estimated that 64.4% of clients lived on less than the equivalent of about $1.64 per day and 89.5% lived on less than the equivalent $3.28 per day.44 These percentages were estimated by asking clients simple questions such as "what type of fuel do you use?" and "what is your main source of income?" and using an independent conversion methodology to convert this data into income data.45 The survey also found that 87% of clients in the program targeted at the poor had electricity, 47% had piped water, and 3% had a flush toilet.46
For more information on standard of living surveys of microfinance clients, see our microfinance glossary.
Possible negative/offsetting impact
We believe that borrowing is bad for at least some borrowers;47 the above section addresses what we know about this concern in SEF's case.
We also have general concerns about charities' potential diversion of skilled labor and/or interference with government responsibilities. The latter concern seems minor in this case, as SEF's functions don't seem to overlap with (or involve funding) government functions. The former is a potential concern, although SEF has provided what we consider a reasonably strong argument that its personnel come from backgrounds of unemployment and underemployment.
Room for more funds
SEF estimates that it could productively use $1.1 million in additional donations between July 2010 and June 2011. This funding would be allocated as follows:48
- $83,817 for an entrepreneurship program in collaboration with Freedom from Hunger.49 Freedom from Hunger's training program was evaluated in a randomized controlled trial in Peru, which found that the program slightly increased trainees' sales and slightly decreased the microfinance institution's dropout rate.50 SEF's training program, however, may differ substantially from the program used in Peru.51
- $354,959 for quality assurance and staff training.52
- $649,444 for additional loan capital as "equity" against which to borrow from commercial and semi-commercial lenders. SEF revised its need for additional loan capital upward after growing more slowly than expected in the year to June 2010.53
Financials/other
All data comes from Mix Market.54
Revenue and expense growth (about this metric): SEF's revenues and expenses have grown gradually over time.
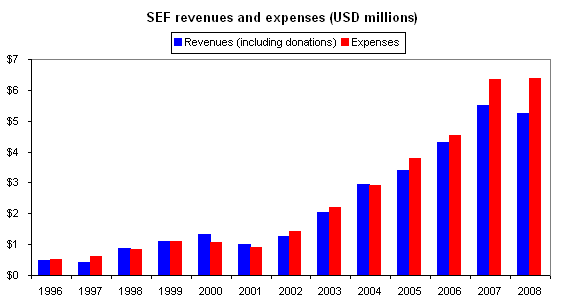
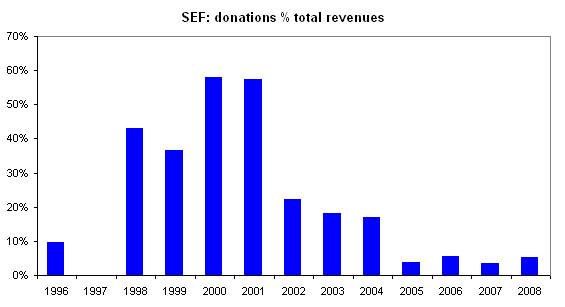
Assets-to-expenses ratio (about this metric): We normally use this metric as a partial check as to whether an organizaton is over-funded. In the case of SEF (which as a bank has signifcant program revenues, we instead evaluate the role of donations in SEF's revenues, checking the degree to which SEF still requires donations to meet its obligations.
Expenses by program area (about this metric): The Small Enterprise Foundation currently runs only one program.
Expenses by IRS-reported category (about this metric): The Small Enterprise Foundation operates in South Africa and is not a IRS-registered charity.
Sources
- Baumann, Ted. 2003. Small Enterprise Foundation: South Africa's premiere pro-poor microlender (DOC). Monograph No. 1. South Africa: Community Microfinance Network.
- Chen, Shiyuan, Mark Schreiner, and Gary Woller. 2009. A simple poverty scorecard for South Africa (PDF).
- de Wit, John. Executive Director of SEF. Email to GiveWell (DOC), December 7, 2009.
- de Wit, John. Executive Director of SEF. Email to GiveWell, March 3, 2010.
- de Wit, John. Executive Director of SEF. Email to GiveWell (DOC), August 16, 2010.
- Duke, Sara. M-CRIL Senior Researcher. Phone conversation with GiveWell, November 18, 2009.
- GiveWell. Is borrowing good for the borrowers?
- GiveWell. Questions for microfinance charities.
- GiveWell. Site visits: February 2010.
- Imp-Act Consortium. SPM in practice: The Small Enterprise Foundation (South Africa) (PDF).
- Easy Forex. Interest rates. http://www.easy-forex.com/interestratetable.aspx (accessed June 18, 2010). Archived by WebCite® at http://www.webcitation.org/5qa6GAAVJ.
- Karlan, Dean, and Martin Valdivia. 2009. Teaching entrepreneurship: Impact of business training on microfinance clients and institutions (PDF). New Haven: Innovations for Poverty Action.
- Langeman, Tim. Calculating interest rates with excel (accessed June 18, 2010). MFTransparency blog, February 24, 2010. Archived by WebCite® at http://www.webcitation.org/5qa6Fx3WS.
- M-CRIL. Social rating of SEF (2008) (PDF).
- Mix Market. Small Enterprise Foundation data (1995-2008) (XLS).
- Rosenberg, Richard. 1999. Measuring Microcredit Deliquency: Ratios Can Be Harmful to Your Health (PDF). Occasional Paper 3. Washington DC: Consultative Group to Assist the Poorest.
- Small Enterprise Foundation. Analysis of % of loans per loan type for all active clients (XLS).
- Small Enterprise Foundation. Annual financial statements. http://www.sef.co.za/annual-financial-statements (accessed June 18, 2010). Archived by WebCite® at http://www.webcitation.org/5qa6D4x3y.
- Small Enterprise Foundation. Audited financial statements (2007) (PDF).
- Small Enterprise Foundation. Audited financial statements (2008) (PDF).
- Small Enterprise Foundation. Background. http://www.sef.co.za/backgound (accessed June 18, 2010). Archived by WebCite® at http://www.webcitation.org/5qa6AwZFM.
- Small Enterprise Foundation. Drop out report (2009) (XLS).
- Small Enterprise Foundation. Drop-out study (PPT).
- Small Enterprise Foundation. Executive summary: Dropout/arrears study research (DOC).
- Small Enterprise Foundation. Extract from draft PPI pilot survey (DOC).
- Small Enterprise Foundation. Financial projections - income statement (XLS).
- Small Enterprise Foundation. Management review (2009) (PDF).
- Small Enterprise Foundation. Need for grants (July 2010-June 2011) (XLS).
- Small Enterprise Foundation. PPI poverty score card (PPT).
- Small Enterprise Foundation. Social performance standards report (2008) (XLS).
- Small Enterprise Foundation. Some program data - true arrears (XLS).
- Small Enterprise Foundation. Tables at 33.2% interest rate (XLS).
- Small Enterprise Foundation. TLC project (DOC).
- van de Ruit, Catherine, Julian May, and Benjamin Roberts. 2001. A poverty assessment of the Small Enterprise Foundation on behalf of the Consultative Group to Assist the Poorest (PDF). South Africa: University of Natal.
- World Bank. 2005. International Comparison Program tables of results (PDF).
- 1
Small Enterprise Foundation, "Background."
- 2
"This year SEF continued its focus on expansion with operations starting in the Eastern Cape, Mpumalanga and North-West Provinces. SEF now operates seven branches in the Eastern Cape in rural villages between Butterworth and Mthatha. In the North-West operations are located in the villages around Hammanskraal, Maubane, Winterveld, Moses Kotane Municipality, Marbieskraal and Sun City. Operations have also started in villages around Acornhoek in Mpumalanga. In all 12 new branches were opened in the financial year, six in the Eastern Cape Province, five in the North-West Province and one in Mpumalanga. SEF now has 38 branches." Small Enterprise Foundation, "Management Review (2009)," Pg 4.
- 3
Small Enterprise Foundation, "Social Performance Standards Report (2008)."
- 4
Length of loan How often are repayments due? % of SEF loans 4 months Every 2 weeks 12% 4 months Monthly 21% 6 months Every 2 weeks 9% 6 months Monthly 56% 10 months Monthly 1% Data from Small Enterprise Foundation, "Analysis of % of Loans Per Loan Type for All Active Clients."
- 5
"It is compulsory for every client to save at every fortnightly meeting but clients may withdraw whenever they wish. The minimum amount that must be saved is set at a low R10 per person per fortnight. After the first loan, 10% of the subsequent loan is required as up-front savings." M-CRIL, "Social Rating of SEF (2008)," Pg 5.
"Financial transactions are through branches of the banking system – mainly the Post Savings Bank which has a wide network, or Nedbank...SEF does not collect savings deposits but encourages clients to save in their Bank group account." M-CRIL, "Social Rating of SEF (2008)," Pg 4.
- 6
"Why doesn't SEF offer savings services? – Two main reasons (1) Regulation – we would have to obtain a banking license. These are not easy to come by and also require a really large amount of capital. (2) Because of South Africa's relatively very high labour costs and high rate of violent crime it is very expensive to collect small savings deposits or to allow small savings withdrawals, especially in rural areas. It may also be noted that the Post Bank and commercial banks do offer reasonable (“reasonable” not “good”) access to savings facilities for the poor." John de Wit, email to GiveWell, December 7, 2009.
- 7
"SEF has tried testing a life insurance product, with a pilot during 2006-7 but uptake was very low and the product was not continued." M-CRIL, "Social Rating of SEF (2008)," Pg 5.
- 8
"SEF's management systems were unable to support the growth of the previous financial year, leaving key aspects of the methodology – support to client businesses and well-functioning groups and centres – to be poorly managed. A lack of experienced staff due to recruitment for expansion and due to dismissals also meant that many staff were not equipped to deal with the problems they encountered." Small Enterprise Foundation, "Executive Summary: Dropout/Arrears Study Research," Pg 3.
- 9
Sara Duke, phone conversation with GiveWell, November 18, 2009. She told us that M-CRIL sends evaluators to meet with representatives of the organization and gather data for their report. She was not able to share other reports with us due to confidentiality restrictions.
- 10
Small Enterprise Foundation, "Annual Financial Statements."
- 11
Small Enterprise Foundation, "Drop Out Report (2009)."
- 12
Drop out rate as of June 30 is calculated on July 31 as:
(Number of clients who completed a loan between January 1 and June 30 and after completion, did not take out a second loan before July 31) divided by (Number of clients who completed a loan between January 1 and June 30). - 13
GiveWell, "Is borrowing good for the borrowers?"
- 14
Small Enterprise Foundation, "Drop-Out Study."
- 15
"Research Objective: To investigate reasons for SEF's increased arrears and dropout rate since January 2009." Small Enterprise Foundation, "Executive Summary: Dropout/Arrears Study Research," Pg 1.
- 16
"'Dropouts complained of the lack of recording of patching and their savings being used, sometimes without their knowledge, to patch other members...Complaints of having to attend fortnightly meetings and the use of the centre savings fund for patching all pointed to a breakdown of discipline and poor problem-solving at the centre level. Conflicts were addressed by keeping the entire centre in a meeting for 3 to 4 hours...In areas that had particularly high exit rates, issues with staff honesty were cited by current clients as reasons they were thinking of dropping out or why others had already dropped out. Where fraud had occurred with the previous DF, centres in the area were undisciplined and faced the problems with patching mentioned above." Small Enterprise Foundation, "Executive Summary: Dropout/Arrears Study Research," Pg 3.
- 17
"SEF has a detailed incentive system in place which has been adapted over time and is still evolving. It applies primarily to DFs and to BMs. The incentive can contribute up to 70% of the basic monthly salary – and is assessed for DFs every month. Branch Managers have one component that is paid monthly and another which is paid fortnightly. The system is based primarily on growth (number of groups, deliberately not portfolio) and maintaining portfolio quality (low number of groups with arrears). During 2007/8 SEF has piloted a revised system to include a weighting for dropouts. SEF is able to do this because of its close monitoring of the dropout rate (see below) and is concerned to include this alongside growth and quality parameters, so as to support client retention." M-CRIL, "Social Rating of SEF (2008)," Pg 6.
- 18
"Loan size is linked to two features – level of savings and the business evaluation undertaken by the DF. The business evaluation estimates value of the business, stock/materials, accounts receivable and cash on hand of the clients, and is undertaken in detail." M-CRIL, "Social Rating of SEF (2008)," Pg 7.
- 19
M-CRIL, "Social Rating of SEF (2008)," Pg 7.
- 20
"Centre leadership complained of staff undermining decisions taken in the centre about loan sizes and allowing clients to have larger loans even after the centre had agreed otherwise." Small Enterprise Foundation, "Executive Summary: Dropout/Arrears Study Research," Pg 3.
- 21
Small Enterprise Foundation, "Drop-Out Study."
- 22
"Centre savings, attendance and repayment rates are monitored. Any centre which falls below a certain ”˜trigger value' for any one of these is defined as ”˜vulnerable', and so is targeted for corrective action. In this way, SEF has designed an ”˜early warning system' to detect problems before they become systemic and harmful to the MFI as well as its clients." Imp-Act Consortium, "SPM in Practice: The Small Enterprise Foundation (South Africa)," Pgs 3-4.
- 23
"Client protection: Strong values of social responsibility, reflecting principle of ”˜respect for all'. These values are integrated into operations; and partially monitored as part of Quality Assurance." M-CRIL, "Social Rating of SEF (2008)," Pg 2.
- 24
"SEF has a detailed incentive system in place which has been adapted over time and is still evolving. It applies primarily to DFs and to BMs. The incentive can contribute up to 70% of the basic monthly salary – and is assessed for DFs every month. Branch Managers have one component that is paid monthly and another which is paid fortnightly. The system is based primarily on growth (number of groups, deliberately not portfolio) and maintaining portfolio quality (low number of groups with arrears). During 2007/8 SEF has piloted a revised system to include a weighting for dropouts. SEF is able to do this because of its close monitoring of the dropout rate (see below) and is concerned to include this alongside growth and quality parameters, so as to support client retention." M-CRIL, "Social Rating of SEF (2008)," Pg 6.
- 25
M-CRIL, "Social Rating of SEF (2008)," Pg 13.
- 26
"Current competitors include the parastatal Land Bank's Step-Up Programme and Marang Financial Services. SEF expects some disruption from the Step-Up Programme. This programme provides individual loans at less than half SEF's interest rate. Moreover, Step-Up appears to be ”˜pushing' loans without regard to sustainability, and appears unconcerned about defaults. Marang currently serves the same market as MCP and offers similar products. This is currently SEF's most serious competitor." Baumann 2003, Pgs 26-27.
- 27
"In future it will need to try to review other household liabilities, as it expands into areas with other MFIs." M-CRIL, "Social Rating of SEF (2008)," Pg 7. "[C]ompetition is beginning in Limpopo and as SEF expands to the Eastern Cape." M-CRIL, "Social Rating of SEF (2008)," Pg 13.
- 28
"A previously mentioned, the North Zone is particularly affected by the presence of Marang, WDB and money lenders. While only 3 out of 8 clients in arrears interviewed admitted to having to take loans from sources other than SEF, though centre leaders implied that more clients than this were taking out “double” loans...This research did not find evidence of clients dropping out because of other's over-indebtedness though the clients who did admit to being members of both SEF and WDB were in arrears, which implies that they had become over-indebted." Small Enterprise Foundation, "Executive Summary: Dropout/Arrears Study Research," Pg 1.
- 29
Data and calculations are in Small Enterprise Foundation, "Tables at 33.2% interest rate." Data on '% of SEF loans' is from Small Enterprise Foundation, "Analysis of % of loans per loan type for all active clients," Pg Sheet1.
Annual percentage rate (APR), effective interest rate (EIR) and monthly rate were calculated by GiveWell. Note that the APR is equal to 12 times the monthly interest rate, while the EIR fully incorporates "compounding," whose relevance to microloans is debatable. For more information on calculating interest rates for microfinance banks, see Langeman 2010.
Length of loan Repayment schedule % of SEF loans Monthly rate Annual Percentage Rate (APR) Effective Interest Rate (EIR) 6 months Monthly 56% 7.0% 84% 126% 4 months Monthly 21% 7.0% 84% 124% 4 months Every 2 weeks 12% 7.4% 89% 140% 6 months Every 2 weeks 9% 6.3% 76% 111% 10 months Monthly 1% 5.9%-7.4% (depends on loan size) 71%-89% (depends on loan size) 99%-135% (depends on loan size) - 30
Easy Forex, "Interest Rates."
- 31
In 2007 and 2008, SEF disbursed a total of R 339,511,700. To be conservative, we assume a 6-month loan term (only 1% of loans have a longer term than this). Between January 2007 and June 2009 (the end of the period plus the length of one loan term), there was R 2,762,663 in death write-offs and other write-offs (which SEF calls bad debts). The sum of the stock of rescheduled loans and arrears in June 2009 (i.e. all loans that were neither repaid nor rewritten of as of that date) was R 674,155. Under the assumption that all debt disbursed in 2007-2008 was either repaid, written off or entered into arrears/rescheduled loans by 6 months into 2009:
Lower bound collection rate = (R 339,511,700 – R 2,762,663 – R 674,155) / R 339,511,700 = 99.0%Data is from Small Enterprise Foundation, "Some Program Data - True Arrears." Loan term data is from Small Enterprise Foundation, "Analysis of % of Loans Per Loan Type for All Active Clients."
- 32
We used the estimation method given by Rosenberg 1999, Pg 20:
Annual loss rate (ALR) = [(1 - collection rate) / (loan term)] * 2
SEF's average loan term is 0.448 years. Small Enterprise Foundation, "Analysis of % of loans per loan type for all active clients."
- 33
Mix Market, "Small Enterprise Foundation Data (1995-2008)."
- 34
"[T]he Northern Province emerges as one of the poorest provinces in South Africa. Moreover, two of the three communities in which the CGAP/SEF study was undertaken are among the poorest in that province." van de Ruit, May, and Roberts 2001, Pg 39.
See also van de Ruit, May, and Roberts 2001, Pg 38, Table 14.
- 35
van de Ruit, May, and Roberts 2001, Pg 13.
- 36
van de Ruit, May, and Roberts 2001.
- 37
"The results for the poverty targeted scheme, TCP, show that clients are consistently poorer than non-clients." van de Ruit, May, and Roberts 2001, Pg 23.
- 38
See list in van de Ruit, May, and Roberts 2001, Pgs 17-18.
- 39
M-CRIL "Social Rating of SEF (2008)," Pg 5.
- 40
"MCP [the non-targeted program] clients are better off than the non-clients." van de Ruit, May, and Roberts 2001, Pg 23.
- 41
"The current strategy is to expand only with TCP, and no new MCP branches have been established for a number of years." M-CRIL, "Social Rating of SEF (2008)," Pg 5.
- 42
"At the outset of the PPI pilot, three key methodological decisions were made to select clients for the pilot's sample:
1) The PPI pilot would only apply to TCP branches.
2) PPI interviews would be conducted in all 16 TCP branches.
3) Each member of the Survey Team would be given a list of twice as many TCP clients as they would be required to interview, randomised by PWR score and client age.
The third decision was made in recognition of the fact that reliable addresses, or directions, for finding clients do not exist in most of SEF's areas of operation...As Figures 3 and 4 demonstrate, this modus operandi yielded a representative sample of TCP clients by PWR score and client age, when compared with the underlying TCP population as of June 2007...By providing members of the Survey Team with lists of twice as many clients as needed, their reliance on SEF's loan officers skewed the pilot's sample towards TCP clients in loan cycle 1 – also referred to as ”˜entering clients' – as Figure 5 confirms." Small Enterprise Foundation, "Extract from Draft PPI Pilot Survey," Pgs 5-6. - 43
Small Enterprise Foundation, "Extract from Draft PPI Pilot Survey," Pgs 4.
- 44
"[T]he PPI tool estimated 89.5% of all TCP clients as ”˜poor', using a $2/day poverty line... [and] 64.4% of all TCP clients as ”˜very poor', using a $1/day poverty line." Small Enterprise Foundation, "Extract from Draft PPI Pilot Survey," Pg 8.
South Africa has price level index (i.e. the ratio of PPP (US$=1) to official exchange rate (US$=1) multiplied by 100) of 61, according to World Bank 2005, Pg 23. $1 divided by 0.61 to adjust for the differences in price levels between South Africa and the U.S. is $1.64. $2 divided by 0.61 to adjust for the differences in price levels between South Africa and the U.S. is $3.28.
- 45
"In contrast, the indirect approach via poverty scoring is simple, quick, and inexpensive. It uses ten verifiable indicators (such as “What is the main source of cooking energy/fuel for this household?” or “Does the household own a refrigerator or freezer?”) to get a score that is highly correlated with poverty status as measured by the exhaustive survey." Chen 2009, Pg 1.
- 46
M-CRIL, "Social Rating of SEF (2008)," Pg 12.
- 47
GiveWell, "Is borrowing good for the borrowers?"
- 48
Small Enterprise Foundation, "Need for Grants (July 2010-June 2011)."
- 49
Small Enterprise Foundation, "TLC Project."
- 50
Karlan and Valdivia 2009, Pgs 17 and 21. Overall, the impact of the program doesn't appear very large--the majority of indicators measured by the difference-in-difference method were not significant. However, arguably the most important indicator, sales in the last month, was (just barely) significant at the 95% confidence level and showed that those who got the training had 15% higher sales. Additionally, those in the treatment group were 4% less likely to drop out either temporarily or permanently (but the difference in permanent drop out rates was not statistically significant).
- 51
For example, in Peru the program was 22 sessions (Karlan and Valdivia 2009, Pg 8), while the SEF program is 7-10 sessions (Small Enterprise Foundation, "TLC Project," Pg 4).
- 52
$175,871 for "Zonal Manager and team to rehabilitate branches with below acceptable performance." $89,544 for "Special Quality Assurance team for training future Branch Managers," and $89,544 for "Internal exposure and training program for high potential employees - preparation for future management positions." Small Enterprise Foundation, "Need for Grants (July 2010-June 2011)."
- 53
John de Wit, email to GiveWell, August 16, 2010.
- 54
Mix Market, "Small Enterprise Foundation Data (1995-2008)."