This page surveys information about quality of life in the developing world. The purpose is primarily to answer the question, “If a donor’s funds save a live, what sort of life is saved?”
We make no attempt to fully convey what life is like; instead, we focus on what facts are available from relatively broad, large-sample, plausibly representative studies. We restrict ourselves to basic questions such as “What health problems are common and how common are they?”, or “What problems do people in the developing world generally list as particularly important?”
For someone seeking a more qualitative (and less representative) picture, we suggest a visit to the developing world.
Table of Contents
Summary
- Self-reported life satisfaction: People in poor countries report that they are on average less satisfied with their lives than people in rich countries. The average resident of a low-income country rated their satisfaction as 4.3 using a subjective 1-10 scale, while the average was 6.7 among residents of G8 countries. We interpret this as a large satisfaction gap.
- Incomes: A large proportion of the population in developing countries live on under $1 or $2 per day. The poor spend a large proportion of their incomes on food, may lack access to basic infrastructure, and own few productive assets. However, they do make consumption choices that involve spending on things other than food and use a variety of instruments to manage erratic income streams. Ownership of televisions and radios and access to electricity and sanitation varies widely.
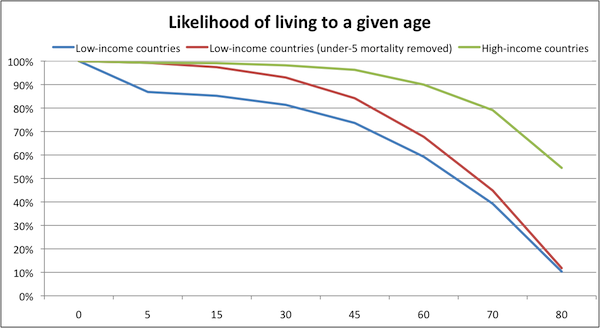
- Mortality: On one hand, people in Sub-Saharan Africa are much worse off, and much more likely to die prematurely, than people in wealthier parts of the world. On the other hand, those who live past the age of 5 have strong chances of living to age 60 or so; saving a life even from a single cause of death means saving a person who is likely to live quite a while longer.
- Morbidity: A third of children under five in developing countries show evidence of long-term malnutrition. Malnutrition can cause low energy, diarrhea, anemia, hypothyroidism, poor vision, and pneumonia, as well as increased susceptibility to many other diseases. Prevalence of parasitic worm infection is very high in many poor regions. Malaria causes frequent sickness among children under 5, who average over 4 days of sickness with the disease per year.
- Development Priorities: Sub-Saharan Africans rank reducing poverty and hunger as the two most pressing Millennium Development Goals. Health goals are also prioritized.
Income and self-reported well-being
Are people in poor countries less satisfied with their lives?
The Gallup World Poll asks a representative sample of people from 132 countries to answer questions about their well-being. Examples include asking respondents to rank their life satisfaction on a scale from 0 to 10 and to answer the question "are you satisfied or dissatisfied with your personal health?" This data has been used to look at the relationship between level of economic development (income, health status, etc.) and self-reported well-being.1
The 2006 Gallup World Poll data shows a positive correlation between per capita income in a country and average self-reported life satisfaction. One report on the World Poll data concluded, "high-income countries have greater life satisfaction than low-income countries...there is no evidence that the cross-country effects of greater income fade out or vanish as countries increase their income."2
In the chart below, average life satisfaction (as measured by the Gallup World Poll) is plotted against income for the 38 of the 43 low-income economies (as classified by the World Bank)3 for which World Poll data is available, as well as for the members of the G8.4 Relatively high-income countries report satisfaction levels between 6 and 8 (on a scale from 0 to 10); low-income countries report satisfaction levels between 3 and 5.5.
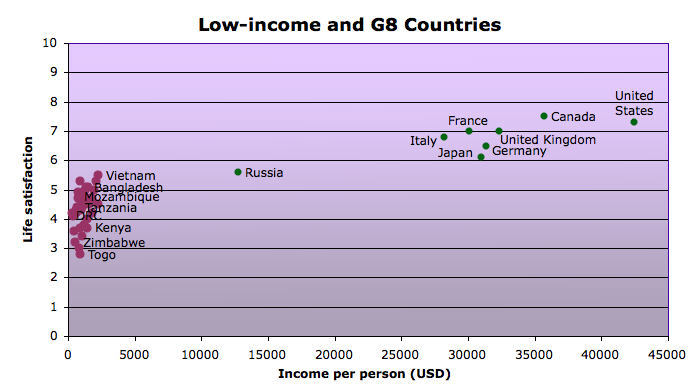
The difference between satisfaction in the average low-income country and the average G8 country is about 2.4, or a little less than a quarter of the scale (which ranges from 0 to 10, with 0 representing the worst possible life and 10 representing the best possible life).
Income and assets
Global poverty rates
Poverty rates have been decreasing in many parts of the world, but the number of people living below the international poverty line remains high, especially in Sub-Saharan Africa.5 Data on the number of people living on less than $1.25 per day (the international standard of extreme poverty)6 and on less than $2.00 per day (another international poverty benchmark) is based on dissimilar national studies from a limited number of countries,7 and thus should be approached with caution. Recent World Bank data estimates the number of people living on under $1.25 a day at about 1.4 billion worldwide.8 About half of Sub-Saharan Africans live on under $1.25 a day.9 Many more live just above this line. Over 2.5 billion people live on less than $2 a day, with nearly three-quarters of the population of Sub-Saharan Africa falling into this category.10 (Note: These figures are calculated for purchasing power parity (PPP), meaning that someone earning "$2 a day" does not literally earn this much but the equivalent of what 2 U.S. dollars could buy in the United States.11 )
What does it mean to live on under 1 or 2 dollars per day?
Most of the points below are taken from analysis by Abhijit Banerjee and Esther Duflo of survey data from 13 countries.12 We also consider information from Portfolios of the Poor,13 which tracked the financial lives of over 250 households in 3 countries at a high level of detail.
- Most of income is spent on food. People living on less than $1 or $2 per day reported spending a large proportion (between 55 and 80%) of their incomes on food. The proportion of income spent on food was not substantially different between the under $1 and under $2 per day groups.14
- There is little ownership of "productive assets." People living on under $1 a day generally reported owning few “productive” assets such as bicycles, sewing machines, phones, or tractors,15 though in some areas a large proportion of poor households own small plots of land.16
- Varying ownership of TV and radios. Ownership of non-productive assets also varied widely across countries and between urban and rural areas. In Tanzania, for example, almost no one living on under $1 a day reported owning a television, while 57% of those living on the same (adjusted) income in Hyderabad, India owned one. Rates of radio ownership were higher than those for television. About 70% of those living on under $1 a day in Peru, South Africa, and Nicaragua own radios, and in several other places ownership rates were over 40%.17
- Varying access to electricity, water and sanitation. The poor often lacked access to basic infrastructure, and as with assets, there was large variability among households around the world. In Mexico and Indonesia, for example, electricity access was nearly universal, but in-house tap water and ownership of a toilet or latrine were far less prevalent in Indonesia (data for Mexico not available). In Tanzania, the pattern was quite different: nearly every poor household owned a toilet and very few had access to electricity or in-house tap water.18
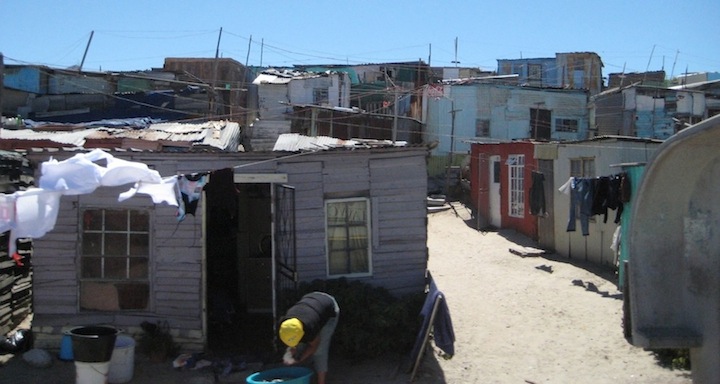
A poor urban community in Cape Town, South Africa with access to electricity but without household latrines or in-house tap water.
- Poor health. The poor reported often being sick. Among the surveys cited by Banerjee and Duflo (2006), no surveys yielded an average 'percent of household members sick' (in the month before the survey) of below 10%, and many reported rates above 25%.19
- Multiple occupations. Banerjee and Duflo (2006) also looked into how the poor earn their incomes. One pattern they found in many parts of the world was the tendency of the poor to engage in multiple occupations. Common occupations were running very small businesses, small-plot agriculture, and day labor.20 The authors argue that by spreading themselves across a variety of occupations and operating their businesses at such small scales, the poor miss out on gains from specialization and scale economies.21 They believe that this poverty-perpetuating behavior comes from the desire of the poor to minimize risk as well as their inability to raise the capital needed to operate more efficiently.22
- Unpredictability and risk. Banerjee and Duflo (2007) argue that what often separates the 'middle class' (which they define as living on between $2 and $10 per day) from the poor in developing countries are steady well-paying jobs, not greater success at running small businesses.23
Banerjee and Duflo hypothesize that more reliable income flows may be the reason the middle class invest more of their income in the future than the poor do.24
(However, we note that it is also possible that, to some degree, people who are more future-oriented in general are the same people who end up with higher incomes.)
Portfolios of the Poor suggests that in addition to having small incomes, the poor often have irregular and unpredictable incomes.25 The book reports on Collins, et al.'s studies of how the poor in India, Bangladesh, and South Africa manage the fact that "the reality of living on two dollars a day is that you don’t literally earn that sum each day."26
Mortality and Morbidity: what are the major health problems in the developing world?
On one hand, people in low-income countries are much worse off, and much more likely to die prematurely, than people in wealthier parts of the world. On the other hand, it's important to note that those who live past age 5 have strong chances of living to age ~60; saving a life from even a single cause of death means saving a person who is likely to live significantly longer.27
Children under 5 in low-income countries primarily die of preventable and treatable diseases such as malaria, respiratory infections, diarrhea, perinatal conditions, measles, and HIV/AIDS. Between ages 5 and 60, the major causes of death in low-income countries (relative to higher-income countries) are HIV/AIDS, tuberculosis, and maternal mortality (i.e., deaths in childbirth). After age 60, there are large differences in the mortality rates for many of the same causes of death that affect those under 5, as well as for many conditions that require advanced medical attention (heart disease, cancer, diabetes).28
The table below shows the differences between low-income and high-income countries, in terms of deaths per 1,000, by age range and cause of death. It is color-coded: yellow squares represent causes of death for which mortality rates are greater in low-income countries by at least 0.5 deaths per 1,000 people, orange squares represent causes of death for which mortality rates are greater in low-income countries by at least 1 deaths per 1,000 people), and red squares represent causes of death for which mortality rates are greater in low-income countries by at least 2.5 deaths per 1,000 people.29
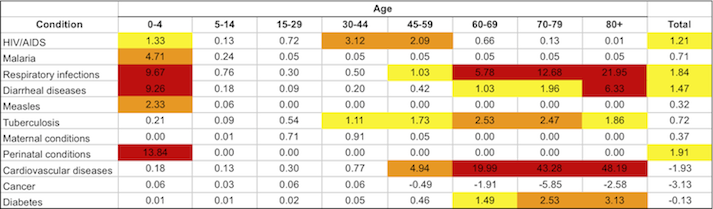
Note that conditions vary within the developing world. Mortality rates for many causes are higher in Sub-Saharan Africa than in the group of low-income countries (which includes some highly populous Asian countries, such as India, Pakistan, and Bangladesh). For more information, see our discussion of life expectancy in Sub-Saharan Africa.
Non-fatal health problems
Household surveys of those living on under $1 or $2 per day show that the poor are often sick. In the surveys cited by Banerjee and Duflo (2006), in every country for which data was available an average of over 10% of households reported at least one member needed to see a doctor in the month prior to the survey. In many areas the average exceeded 25%; parts of India, Mexico, and Nicaragua had averages above 35%.30 Here we do not discuss all health problems in detail, but we present three prevalent conditions (malnutrition, parasitic worms, and malaria) which are both direct causes of symptoms and risk factors for other conditions. In addition, we present data on the prevalence of a selection of health problems that are common in low-income countries and compare prevalence rates in these countries to rates in high-income countries.
Malnutrition is a widespread problem in the developing world. It is estimated that in 2000-2002, over 800 million people in the developing world were undernourished (insufficient energy intake),31 and 2 billion are micronutrient deficient.32 In 2005, approximately 32% of children under five in developing countries were stunted (had a height-for age that was more than two standard deviations below the global average), which likely reflects chronic undernutrition throughout life.33 Malnourishment may be both caused by disease (such as parasitic worms) and increase susceptibility to disease.34 Lacking certain nutrients has been associated with a wide range of health problems including low energy, diarrhea, anemia, hypothyroidism, poor vision, and pneumonia.35 We do not know how common or severe these symptoms generally are among malnourished people.
Malnutrition is sometimes associated with infection with parasitic worms.36 It is estimated that there are more than 1.2 billion roundworm infections globally, ~700-800 million infections with each hookworm and whipworm, and 250 million infections with schistosomiasis.37 While most infections do not cause symptoms,38 heavy worm infection can cause anemia, dysentery, and growth retardation.39 In the long run, worm infection "impair[s] physical and mental growth in childhood, thwart[s] educational advancement, and hinder[s] economic development."40 Death from worm infection can occur, but is fairly rare.41 (More on specific types of infections at our discussion of schistosomiasis and our discussion of soil-transmitted helminths.)
Another major cause of disability and suffering is malaria. The Disease Control Priorities Project estimates that there were 213 million cases of malaria in 2000, resulting in over 1.1 million deaths.42 This means that while malaria is a leading cause of death, the vast majority of cases are not fatal, but do cause suffering and disability. Like many other diseases, risk of malaria infection and complications are increased by malnutrition.43 As can be seen in the chart here, children under five average over 4 days of sickness with malaria per year, and older children fall sick every 2-3 years for an average of 2.3 days. Uncomplicated malaria is characterized by fever, headaches, and nausea.44 Severe malaria can cause cognitive impairment, seizures, coma, respiratory distress, and heart problems.45
Other conditions. The table below compares prevalence rates for a selection of additional common causes of morbidity in low-income countries. Prevalence rates in high-income countries and for HIV/AIDS are included for comparison purposes.
While prevalence rates are generally higher in low-income than in high-income countries (except for asthma and hearing loss), these conditions, aside from anemia and schistosomiasis, are rare across low-income countries. For many of the infectious conditions, endemic areas may exist where large proportions of the population suffer from the disease, but the average person in the developing world is unlikely to be suffering from these diseases.46
| % affected in low-income countries | % affected in high income countries | Who is affected? | |
|---|---|---|---|
| Anemia | Mostly women and young children.47 | ||
| Schistosomiasis | Primarily affects the poor.48 | ||
| Vision impairment | Primarily affects those over 40. Higher prevalence in poor areas.49 | ||
| Asthma | |||
| Hearing loss | About a quarter of severe cases affect children.50 | ||
| Lymphatic filariasis | Prevalence increases with age. Disproportionately affects the poor.51 | ||
| HIV/AIDS | Primarily affects adults. About 8% of HIV infections are among children.52 | ||
| Vitamin A deficiency | More likely to affect the poor as it results from lack of meat product, fruit and vegetable, and fat consumption.53 | ||
| Trachoma | Primarily affects young children and adult women.54 | ||
| Onchocerciasis | Intensity increases with age.55 |
What problems do people in the developing world believe are most pressing?
In 2006, the Gallup World Poll asked a representative sample from 26 Sub-Saharan Africa countries to rank the Millennium Development Goals (MDGs) in order of importance to them.56 The MDGs are a set of targets established by the United Nations in 2000 on a range of human development goals including poverty, education, health, gender equality, and the environment.57 Respondents consistently ranked reducing poverty and reducing hunger as the two most important goals.58 Health goals followed the top two, with 'Reducing the spread of HIV' ranking third and reducing under five mortality, maternal mortality and 'Reducing the spread of malaria and TB' coming in at 5, 6, and 8, respectively, out of a total of 12 goals. One argument for why health goals are not ranked higher than they are, argued by Deaton (2008), is that Africans report being more satisfied with their health than we might expect because they are more used to being sick.59
The youth-focused goals of 'Providing more jobs for youths' and 'Achieving primary education for all' were also considered important by many respondents and were ranked 4 and 7, respectively. The goals of improving access to clean water and sanitation, achieving gender equality, and increasing access to new technology were least important to those surveyed.60
Each respondent was asked to rank order six of the twelve goals. A value of 1 was assigned to the top-ranked goal, through 6 for the lowest-ranked goal. Thus the averages below fall in the range of 1 to 6.
| Millennium Development Goal | Weighted Average Score |
|---|---|
| Reducing poverty | 2.41 |
| Reducing hunger | 2.48 |
| Reducing the spread of HIV/AIDS | 3.05 |
| Providing more jobs for youth | 3.17 |
| Reducing the death rate among children under five | 3.34 |
| Reducing the number of women dying during childbirth | 3.38 |
| Achieving primary education for all | 3.62 |
| Reducing the spread of malaria and TB | 3.64 |
| Improving access to safe drinking water | 3.75 |
| Improving access to sanitation facilities | 4.09 |
| Achieving gender equality and empowering women | 4.38 |
| Providing access to new technology | 4.65 |
There were few differences in how men and women, urban and rural dwellers, employed and unemployed adults, or different age and education cohorts ranked the goals.61 Rankings did vary across countries and regions, but reducing hunger and poverty were the top two goals for all but 6 of the 26 countries polled. Of these six, four were Southern African countries where HIV prevalence is very high; all four ranked 'Reducing the spread of HIV' as their top priority. Kenya and Uganda also ranked this goal in their top two. Larger differences between countries were seen in rankings of lower priority goals.62
Sources
- Awasthi, Shally , D. A. P. Bundy, and Lorenzo Savioli. 2003. Helminthic infections. British Medical Journal 327: 431-433.
- Banerjee, Abhijit, and Esther Duflo. 2006. The economic lives of the poor (PDF).
- Banerjee, Abhijit, and Esther Duflo. 2007. What is middle class about the middle classes around the world? (PDF).
- Black, Robert E., et al. 2008. Maternal and child undernutrition: Global and regional exposures and health consequences. Lancet 371: 243–60.
- Centers for Disease Control and Prevention. Malaria: Disease. http://www.cdc.gov/malaria/about/disease.html (accessed April 27, 2010). Archived by WebCite® at http://www.webcitation.org/5pIz0gCDp.
- Collins, Daryl, et al. 2009. Portfolios of the poor: How the world's poor live on $2 a day. Princeton, NJ: Princeton University Press. Selections at http://books.google.com/books?id=KE0H8B7NBNYC&lpg=PP1&dq=portfolios%20o… (accessed April 29, 2010).
- de Silva, Nilanthi R., et al. 2003. Soil-transmitted helminth infections: Updating the global picture. Trends in Parasitology 19: 547-551.
- Deaton, Angus. 2008. Income, health, and well-being around the world: Evidence from the Gallup World Poll (PDF). Washington, DC: Gallup.
- Edwin, Michael. 2000. The population dynamics and epidemiology of lymphatic filariasis. In Lymphatic filariasis, ed. Thomas B. Nutman, 41-81. London: Imperial College Press.
- Food and Agriculture Organization of the United Nations. Glossary (list). http://faostat.fao.org/site/375/default.aspx (accessed June 10, 2010). Archived by WebCite® at http://www.webcitation.org/5qNmnFEfJ.
- GiveWell. Mortality by income group with calculations (XLS).
- Global Network for Neglected Tropical Diseases. 2009. Trachoma (PDF).
- Jamison, Dean T., et al., eds. 2006. Disease control priorities in developing countries (PDF). 2nd ed. New York: Oxford University Press.
- Kumaraswami, V. 2000. The clinical manifestations of lymphatic filariasis. In Lymphatic filariasis, ed. Thomas B. Nutman, 103-125. London: Imperial College Press.
- Lopez, Alan D., et al., eds. 2006. Table 3B.7: Deaths by cause, sex, and age in the Sub-Saharan Africa region, 2001 (thousands). In Global burden of disease and risk factors. New York: Oxford University Press. http://www.dcp2.org/pubs/GBD/3/Table/3.B7 (accessed April 27, 2010). Archived by WebCite® at http://www.webcitation.org/5pIf0sYLp.
- Lopez, Alan D., et al., eds. 2006. Table 3B.8: Deaths by cause, sex, and age in high-income countries, 2001 (thousands). In Global burden of disease and risk factors. New York: Oxford University Press. http://www.dcp2.org/pubs/GBD/3/Table/3.B8 (accessed April 27, 2010). Archived by WebCite® at http://www.webcitation.org/5pIf1qxjx.
- Mathers, Colin D., Majid Ezzati, and Alan D. Lopez. 2007. Measuring the burden of neglected tropical diseases: The global burden of disease framework (PDF). PLoS Neglected Tropical Diseases 1, no. 2.
- Müller, Olaf, and Michael Krawinkel. 2005. Malnutrition and health in developing countries (PDF). Canadian Medical Association Journal 173: 279-286.
- Olds, Richard G. 1998. Infections caused by helminths. In Internal medicine. 5th ed. Ed. Jay H. Stein, 1696-1706. St. Louis: Mosby.
- Simonsen, Paul E. 2009. Filariases. In Manson’s tropical diseases. 22nd ed. Ed. Gordon C. Cook and Alimuddin I. Zumla, 1477-1513. London: Saunders.
- Tortora, Robert D. 2009. Sub-Saharan Africans rank the Millennium Development Goals (MDGs) (PDF). Washington, DC: Gallup.
- UNAIDS. 2007. AIDS epidemic update (PDF).
- World Bank. 2006. World Development Indicators 2006. Washington, DC: World Bank.
- World Bank. 2008. Poverty data: A supplement to World Development Indicators 2008 (PDF). Washington, DC: World Bank.
- World Bank. Country and lending groups: Low income economies. http://data.worldbank.org/about/country-classifications/country-and-len… (accessed May 26, 2010). Archived by WebCite® at http://www.webcitation.org/5pHSuWN38.
- World Health Organization. Disease and injury regional estimates for 2004: Deaths for World Bank income groups (XLS).
- World Health Organization. Disease and injury regional estimates for 2004: Prevalence for World Bank income groups (XLS).
- 1
"Here I focus on the life satisfaction question about life at the present time, measured on an 11-point scale from 0 (“the worst possible life”) to 10 (“the best possible life”), and the health satisfaction question (“are you satisfied or dissatisfied with your personal health?”). I look at how the answers to these questions vary with age and with the objective circumstances of the country, particularly the levels and rates of change of per capita income and life expectancy." Deaton 2008, Pg 2.
- 2
Deaton 2008, Pg 3.
- 3
For classification, see World Bank, "Country and Lending Groups: Low Income Economies."
- 4
The G8 is a group of high-income countries; members are listed at http://en.wikipedia.org/wiki/G8 (accessed April 26, 2009). Archived by WebCite® at http://www.webcitation.org/5pHVGfxif.
- 5
"Global poverty measured at the $1.25 a day line has been decreasing since the 1980s. the number of people living in extreme poverty fell from 1.9 billion in 1981 to 1.8 billion in 1990 to about 1.4 billion in 2005 (figure 6). this substantial reduction in extreme poverty over the past quarter century, however, disguises large regional differences...The poverty rate fell only slightly in Sub-Saharan Africa—going from 54 percent in 1981 to 59 percent in 1999 then down to 51 percent in 2005. But the number of people living below the poverty line has nearly doubled." World Bank 2008, Pg 10.
- 6
"The $1.25 a day poverty line measured in 2005 prices replaces the $1.08 a day poverty line measured in 1993 prices. often described as “$1 a day,” $1.08 has been widely accepted as the international standard for extreme poverty and was incorporated in the first of the Millennium Development Goals." World Bank 2008, Pg 1.
- 7
"Data coverage is improving in all regions, but Sub-Saharan Africa continues to lag, with only 28 of 48 countries having at least one data set available...Household surveys can differ widely, for example, in the number of consumer goods they identify. And even similar surveys may not be strictly comparable because of differences in timing or the quality and training of survey enumerators." World Bank 2006, Pg 74.
- 8
People living on less than 2005 PPP $1.25 a day (millions) - Total: 1,374.
Data from World Bank 2008, Pg 11, Table 3. - 9
Share of people living on less than 2005 PPP $1.25 a day (%) - sub-Saharan Africa: 50.9%.
Data from World Bank 2008, Pg 11, Table 3. - 10
Share of people living on less than 2005 PPP $2.00 a day (%) - sub-Saharan Africa: 72.9%.
People living on less than 2005 PPP $2.00 a day (millions) - Total: 2,564.
Data from World Bank 2008, Pg 11, Table 3. - 11
"PPP can be defined as the number of units of a country’s currency needed to buy the same amount of goods and services in that country as one U.S. dollar would buy in the United States." World Bank 2008, Pg 2.
- 12
"Our discussion of the economic lives of the extremely poor builds on household surveys conducted in 13 countries listed in Table 1: Cote d’Ivoire, Guatemala, India, Indonesia, Mexico, Nicaragua, Pakistan, Panama, Papua New Guinea, Peru, South Africa, Tanzania, and Timor Leste. We mainly use the Living Standard Measurement Surveys (LSMS) conducted by the World Bank and the “Family Life Surveys” conducted by the Rand Corporation, all of which are publicly available. In addition, we also use two surveys that we conducted in India with our collaborators." Banerjee and Duflo 2006, Pg 2.
- 13
Collins et al. 2009.
- 14
Banerjee and Duflo 2006, Pg 32, Table 3.
- 15
“Apart from land, extremely poor households in rural areas tend to own very little by way of durable goods, including productive assets: 34 percent own a bicycle in Cote d’Ivoire, but less than 14 percent in Udaipur, Nicaragua, Panama, Papua New Guinea, Peru, and East Timor. In Udaipur, where we have detailed asset data, we find that most extremely poor households have a bed or a cot but only about 10 percent have a chair or a stool and 5 percent have a table. About half have a clock or a watch. Less than 1 percent has an electric fan, a sewing machine, a bullock cart, a motorized cycle of any kind, or a tractor. No one has a phone." Banerjee and Duflo 2006, Pg 8.
- 16
"Among productive assets, land is the one that many people in the rural surveys seem to own though there are [sic] enormous country-to-country variation." Banerjee and Duflo 2006, Pg 7.
- 17
Banerjee and Duflo 2006, Pg 33, Table 4.
- 18
Banerjee and Duflo 2006, Pg 34, Table 5.
- 19
Banerjee and Duflo 2006, Pg 36, Table 7. See Pgs 8-9 for what seems to be interpretations of Table 7.
- 20
"All over the world, a substantial fraction of the poor act as entrepreneurs in the sense of raising the capital, carrying out the investment, and being the full residual claimants for the earnings.... Many poor households have multiple occupations.... This pattern of multiple occupations is stronger in rural areas. In Udaipur district, as we discussed earlier, almost everybody owns some land and almost everybody does at least some agriculture. Yet only 19 percent of the households describe self-employment in agriculture as the main source of their income.... The most common occupation for the poor in Udaipur is working as a daily laborer." Banerjee and Duflo 2006, Pg 10-11.
- 21
“Poor families do seek out economic opportunities, but they tend not to get too specialized. They do some agriculture, but not to the point where it would afford them a full living (for example by buying/renting/sharecropping more land). They also work outside, but only in short bursts—they do not move permanently to their place of occupation.” Banerjee and Duflo 2006, Pg 12.
“Many of these businesses are probably operating at too small a scale for efficiency.” Banerjee and Duflo 2006, Pg 13.
- 22
“Risk spreading is clearly one reason why the poor, who might find risk especially hard to bear, tend not to be too specialized in any one occupation.” Banerjee and Duflo 2006, Pg 20.
"A final, more compelling reason for doing multiple jobs is that the poor cannot raise the capital they would need to run a business that would fully occupy them." Banerjee and Duflo 2006, Pg 20.
- 23
"Nothing seems more middle class than the fact of having a steady well-paying job. While there are many petty entrepreneurs among the middle class, most of them do not seem to be capitalists in waiting. They run businesses, but, for the most part, only because they are still relatively poor and every little bit helps." Banerjee and Duflo 2007, Pg 21.
- 24
"Perhaps the sense of control over the future that one gets from knowing that there will be an income coming in every month -- and not just the income itself—is what allows the middle class to focus on building their own careers and those of their children." Banerjee and Duflo 2007, Pg 21.
- 25
"Of all the commonalities [among the poor], the most fundamental is that the households are coping with incomes that are not just low, but also irregular and unpredictable." Collins et al. 2009, Pg 16.
- 26
Collins et al. 2009, Pg 17.
- 27
Data from World Health Organization, "Disease and Injury Regional Estimates for 2004: Deaths for World Bank Income Groups." Calculations in GiveWell, "Mortality by Income Group with Calculations."
- 28
- Lopez et al. 2006, Table 3B.7: Deaths by Cause, Sex, and Age in the Sub-Saharan Africa Region, 2001 (Thousands).
- Lopez et al. 2006, Table 3B.8: Deaths by Cause, Sex, and Age in High-Income Countries, 2001 (Thousands).
- 29
Data is from World Health Organization, "Disease and injury regional estimates for 2004: Deaths for World Bank income groups." All data and calculations are in GiveWell, "Mortality by income group with calculations."
- 30
"Detailed information on health is not available in all the surveys we have, but most report health episodes that left a household member bedridden for a day or more, or required them to see a doctor. While this data is less than perfect, given that the poor may be less prone to recall and report such sicknesses than the rich, the general pattern is of a remarkably high level of morbidity. Among the rural poor living under $1 a day in Peru, South Africa, East Timor, Panama, and Tanzania, between 11 and 15 percent of households report having a member either being bedridden for at least a day or requiring a doctor. The number is between 21 and 28 percent in Pakistan, Indonesia, and Cote d’Ivoire, and between 35 and 46 percent in Nicaragua, Udaipur, and Mexico." Banerjee and Duflo 2006, Pg 8-9. See Banerjee and Duflo 2006, Pg 36, Table 7 for full results.
- 31
"An estimated 852 million people were undernourished in 2000–2002, with most (815 million) living in developing countries." Müller and Krawinkel 2005, Pg 279.
Müller and Krawikel cite the Food and Agriculture Organization of the United Nations, which defines undernourishment on its website as "the condition of people whose dietary energy consumption is continuously below a minimum dietary energy requirement for maintaining a healthy life and carrying out a light physical activity." Food and Agriculture Organization of the United Nations, "Glossary (List)."
- 32
"Micronutrient deficiencies affect at least 2 billion people worldwide." Müller and Krawinkel 2005, Pg 282.
- 33
"One indicator to monitor progress for this target is the proportion of children who are underweight—ie, low weight compared with that expected for a well-nourished child of that age and sex. This anthropometric indicator can indicate wasting (ie, low weight-for-height, indicating acute weight loss), or much more commonly, stunting (ie, low height-for-age, indicating chronic restriction of a child’s potential growth)." Black et al. 2008, Pg 244.
"For all developing countries, an estimated 32% (178 million) of children younger than 5 years had a height-for-age Z score of less than –2 in 2005 (table 1)." Black et al. 2008, Pg 245.
- 34
"The high prevalence of bacterial and parasitic diseases in developing countries contributes greatly to malnutrition there." Müller and Krawinkel 2005, Pg 279.
"It is globally the most important risk factor for illness and death." Müller and Krawinkel 2005, Pg 279.
- 35
"Iron is an essential part of hemoglobin, myoglobin and various enzymes. Its deficiency thus leads mainly to anemia, but also to several other adverse effects. Lack of iodine reduces the production of thyroid hormone and increases that of thyroid-stimulating hormone. As a result, the thyroid gland becomes hyperplastic and goitrous, and hypothyroidism develops. Vitamin A deficiency contributes to anemia by immobilizing iron in the reticuloendothelial system, reducing hemopoiesis and increasing susceptibility to infections. Vitamin A is essential for the functioning of the eyes as well as the immune system.... Zinc deficiency is a major determinant for diarrhea and pneumonia." Müller and Krawinkel 2005, Pg 283.
- 36
"Heavy burdens of both roundworm and whipworm are associated with protein energy malnutrition." Awasthi, Bundy, and Savioli 2003, Pg 432.
- 37
"These estimates indicate that ascariasis [roundworm] remains common with >1.2 billion infections globally... Trichuriasis [whipworm] and hookworm amount to 700–800 million infections each." de Silva et al. 2003, Pg 547.
Schistosomiasis estimate is from Mathers, Ezzati, and Lopez 2007, Pg 8, Table 3.
- 38
"Clinically, most infected individuals are asymptomatic." Olds 1998, Pg 1696.
- 39
"Heavy hookworm burdens have long been recognised as an important cause of iron deficiency anaemia. Intense whipworm infection in children may result in trichuris dysentery syndrome, the classic signs of which include growth retardation and anaemia." Awasthi, Bundy, and Savioli 2003, Pg 432.
- 40
Jamison et al. 2006, Pg 467.
- 41
"Crompton (1999) estimated that 155,000 deaths annually occur from these infections (case fatality rate of 0.08 percent), whereas Van der Werf and others (2003), using the limited data available from Africa, estimated the schistosomiasis mortality alone at 280,000 per year (case fatality rate of 0.014 percent)." Jamison et al. 2006, Pg 470.
- 42
Jamison et al. 2006, Pg 416, Table 21.3.
- 43
"Protein-calorie undernutrition and micronutrient deficiencies, particularly zinc and vitamin A, contribute substantially to the malaria burden (Caulfield, Richard,and Black 2004)." Jamison et al. 2006, Pg 414.
- 44
"More commonly, the patient presents with a combination of the following symptoms:
* Fever
* Chills
* Sweats
* Headaches
* Nausea and vomiting
* Body aches
* General malaise." Centers for Disease Control and Prevention, "Malaria: Disease." - 45
"The manifestations of severe malaria include
* Cerebral malaria, with abnormal behavior, impairment of consciousness, seizures, coma, or other neurologic abnormalities
* Severe anemia due to hemolysis (destruction of the red blood cells)
* Hemoglobinuria (hemoglobin in the urine) due to hemolysis
* Acute respiratory distress syndrome (ARDS), an inflammatory reaction in the lungs that inhibits oxygen exchange, which may occur even after the parasite counts have decreased in response to treatment
* Abnormalities in blood coagulation
* Low blood pressure caused by cardiovascular collapse
* Acute kidney failure
* Hyperparasitemia, where more than 5% of the red blood cells are infected by malaria parasites
* Metabolic acidosis (excessive acidity in the blood and tissue fluids), often in association with hypoglycemia
* Hypoglycemia (low blood glucose). Hypoglycemia may also occur in pregnant women with uncomplicated malaria, or after treatment with quinine." Centers for Disease Control and Prevention, "Malaria: Disease." - 46
Prevalence data in table from World Health Organization, "Disease and Injury Regional Estimates for 2004: Prevalence for World Bank Income Groups. Percentages calculated by dividing prevalence for each region by the regional population.
- 47"More than 2 billion people, mostly women and young children, are thought to be iron deficient." Jamison et al. 2006, Pg 553.
- 48
"STH and schistosomiasis depend for transmission on environments contaminated with egg-carrying feces. Consequently, helminths are intimately associated with poverty, poor sanitation, and lack of clean water." Jamison et al. 2006, Pg 470.
- 49
"The overall prevalence of vision loss, which mainly affects the population above age 40, is a function of age. It is estimated that more than 82.2 percent of all blind individuals are 50 or older.... Childhood vision loss represents approximately 4 percent of the total number of visually impaired." Jamison et al. 2006, Pg 954.
"The burden of visual impairment is not distributed uniformly throughout the world; the least developed regions carry the largest share." Jamison et al. 2006, Pg 955.
- 50
"Mathers and others (2003) estimate that in 2002, 255 million people worldwide had disabling hearing loss (moderate or worse hearing loss in the better ear). Those 192 million people with adult-onset loss (age 20 years and above) and 63 million people with childhood-onset loss make up almost 4.1 percent of the world’s population and just over 40 percent of all people globally with hearing loss of any severity." Jamison et al. 2006, Pg 957.
- 51
"Filarial infection prevalences increase with age, with apparently only small reductions in infection in the oldest adult age classes" Edwin 2000, Pg 46.
"As filariasis is more prevalent in rural areas and in the less affluent members of urban areas" Kumaraswami 2000, Pg 108.
- 52
"Number of people living with HIV in 2007
Total 33.2 million [30.6–36.1 million]
Adults 30.8 million [28.2–33.6 million]
Women 15.4 million [13.9–16.6 million]
Children under 15 years 2.5 million [2.2–2.6 million]." UNAIDS 2007, Pg 1. - 53
"VAD [vitamin A deficiency] results from inadequate intakes of vitamin A because of low intakes of animal foods; inadequate intakes of nonanimal sources of carotenoids that are converted to vitamin A; and inadequate intakes of fat, which facilitates the absorption of carotenoids. Dietary sources of preformed vitamin A include liver, milk, and egg yolks. Dark green leafy vegetables such as spinach, as well as yellow and orange noncitrus fruits (mangoes, apricots, papayas) and vegetables (pumpkins, squash, carrots), are common sources of carotenoids (vitamin A precursors), which are generally less bioavailable than preformed vitamin A but tend to be more affordable." Jamison et al. 2006, Pg 553.
- 54
"Trachoma is particularly common in young children under five and the adults – mainly women – who care for them.... Repeated exposure to the disease over time eventually causes the inside of the eyelid to turn inward -- a condition called trichiasis -- and the eyelashes to scrape and scar the cornea, leading to the formation of corneal opacities and painful and irreversible blindness. Adult women are three times more likely to develop the blindness associated with trachoma, attributed in part to their close proximity with very young children who are often carriers of the disease." Global Network for Neglected Tropical Diseases 2009, Pg 1.
- 55
"The prevalence and intensity of infection and the amount of clinical disease within the endemic community are generally low in young children and increase with age." Simonsen 2009, Pg 1498.
- 56
"In sub-Saharan Africa, 26 countries were included in the 2006 poll with random samples of at least 1,000 adults in each country, for a total sample size of 26,506 interviews...Respondents were asked to rank the United Nations Millennium Development Goals (MDGs) in order of importance to them as individuals. The United Nations introduced the MDGs in 2000 when world leaders convened to develop a plan to improve the quality of life in developing countries by taking steps to reduce poverty, hunger, illiteracy, and disease by 2015." Tortora 2009, Pg 1.
- 57
Twelve goals were ranked. The goals were: 1. Reducing poverty, 2. Reducing hunger, 3. Achieving primary education for all, 4. Achieving gender equality and empowering women, 5. Reducing the death rate among children under five, 6. Reducing the number of women dying during childbirth, 7. Reducing the spread of HIV/AIDS, 8. Reducing the spread of malaria and TB, 9. Improving access to safe drinking water, 10. Improving access to sanitation facilities, 11. Providing access to new technology, and 12. Providing more jobs for youth. From Tortora 2009, Pg 7.
- 58
"The Gallup World Poll findings reveal sub-Saharan Africans’ top priorities: poverty and hunger reduction." Tortora 2009, Pg 21.
- 59
“After all, countries with high rates of HIV prevalence do not systematically report poorer health satisfaction, a finding that is in line with earlier reports that self-reported health measures are often better in places where people are sicker, and presumably more used to being sick (Sen, 2002; Murray and Chen, 1992).” Deaton 2008, Pg 13.
- 60
Tortora 2009, Pg 8, Table 1.
- 61
"A demographic analysis of these rankings shows few differences in goal priorities by age, gender, and education level. Furthermore, when looking at the urban/rural split or employment status, the analysis also shows few variances." Tortora 2009, Pg 21.
- 62
Tortora 2009, Pgs 18-20, Tables 9-12.