In a nutshell
Vitamin A supplementation (VAS) is the mass distribution of vitamin A capsules to preschool-age children to reduce child mortality. GiveWell believes VAS is one of the most cost-effective programs donors can support. We estimate that it costs ~$1,000 to $8,500 to avert a death in locations where GiveWell supports campaigns. We think VAS is cost-effective because:
- VAS is very cheap (around $1 per capsule delivered).
- Child mortality is high in locations where GiveWell funds VAS (~1% to 2% risk of death per child per year).
- Our best guess is that VAS results in a meaningful reduction in child mortality (we estimate ~4% to 12% depending on the location).
Although we believe VAS is probably an excellent investment overall, we are more uncertain about its effect on mortality compared to GiveWell’s other top recommended programs. Some of our key uncertainties are:
- Whether VAS is still effective today, since most of the main studies we use in our analysis were conducted three to four decades ago.
- What explains large differences in outcomes between VAS trials.
- How much GiveWell funding leads to additional children being reached with VAS.
Helen Keller Intl is GiveWell’s current top recommended organization for VAS, and we have also funded Nutrition International. Our page on Helen Keller Intl is here, and our cost-effectiveness analysis (for both organizations) is here.
Published: April 2024 (Previous versions of this page: November 2018 version, November 2017 version)
Basics
Vitamin A deficiency (VAD) is a common condition in low and middle income countries that can lead to blindness, increased susceptibility to infection, and death.
Vitamin A supplementation (VAS) involves getting 6-59 month old children to swallow a small amount of fluid containing vitamin A, delivered via a single-use capsule. GiveWell currently funds Helen Keller Intl and Nutrition International, who provide funding and technical support to governments to deliver VAS via mass distribution campaigns. (More) We think these campaigns increase the number of children who receive VAS and reduce child mortality.
How cost-effective is it?
As of February 2024, we estimate that it costs between ~$1,000 and ~$8,500 (varying by location) to avert a death through VAS campaigns in locations where GiveWell supports VAS. This equates to being 9 to 59 times as effective as spending on unconditional cash transfers (GiveWell’s benchmark for comparing different programs).
We think VAS is cost-effective because:
- Child mortality is high in locations where GiveWell funds VAS. We estimate that the chance that a 6-59 month old child will die from any cause each year is approximately 1% to 2% per year, depending on the location. We rely primarily on all-cause and disease-specific mortality estimates from the Global Burden of Disease (GBD) Model. (More)
- We think VAS reduces child mortality. We estimate that receiving VAS reduces child mortality by about 4% to 12%, depending on location. The starting point for this figure is an estimate from a meta-analysis of randomized controlled trials (RCTs) that VAS reduces mortality by 24%. (More) We apply two main adjustments to this:
- A -25% adjustment to account for possible weaknesses in the underlying RCTs. (More)
- A -41% to -79% adjustment (varying by location) to account for improved child health since the VAS trials were conducted. This incorporates estimates about the share of VAS-susceptible causes of death (primarily diarrhea and measles) and contemporary rates of vitamin A deficiency, compared to when the trials were conducted. (More)
- It is very cheap to reach children with VAS. We estimate that it costs approximately $1 per capsule, or $2 per year, to deliver VAS to a child (More). This is cheaper than most other mass distribution programs we have seen (e.g., approximately $5 to $6 per child per year for seasonal malaria chemoprevention). Intuitively, reasons why we think VAS is cheap include the capsules being donated, and because it can be co-delivered alongside other health interventions such as vaccination campaigns.
- Without GiveWell funding, fewer children would receive VAS. That’s because we think:
- It’s unlikely that a high proportion of children would be reached without mass distribution campaigns. In most countries where GiveWell funds VAS campaigns, children can also access VAS through other sources (e.g., through routine immunization appointments). Our current best guess is that 25% of children would receive VAS through other sources besides campaigns, although this is based on limited data. (More)
- Other funders are unlikely to replace GiveWell’s funding for campaigns. Both Helen Keller Intl and Nutrition International work in locations where we do not believe there is sufficient funding from other sources to support the whole country with regular, high-quality VAS campaigns. We currently estimate that there is a 20% to 50% chance (varying by location) that other funders, primarily UNICEF, would replace GiveWell’s funding for VAS in our absence. Our adjustment to account for this lowers cost-effectiveness by 18% to 46% depending on the location. This is high relative to some other programs we fund, but we think VAS is still cost-effective even after accounting for this. (More)
- We think VAS probably has additional benefits beyond reducing child mortality. These include:
- Income benefits. We think that VAS probably increases children’s incomes in later life. Other child health programs we have investigated (malaria and deworming) have found evidence that averted illness in childhood leads to increased income and consumption in later life. We would guess that VAS has similar benefits, but we have not found any studies directly investigating this question. In total, we estimate that these effects account for approximately 20% of the total modeled benefit of VAS. (More)
- Other supplemental adjustments. We think that VAS leads to several other possible benefits, including reduced morbidity from some illnesses (especially diarrhea and measles), improved vision, and averted costs that would have been spent on treatment. We incorporate these benefits as rough percentage best guesses, leading to an upwards adjustment of 67%. (More)
We quantify these arguments using a cost-effectiveness analysis, which allows us to compare across different programs. Here is a sketch, using estimates for one country, Guinea, as an example.
What we are estimating
|
Best guess (rounded) | Confidence intervals (25th - 75th percentile) (more) | Implied cost-effectiveness |
|---|---|---|---|
| Grant size (arbitrary value) | $1,000,000 | ||
| Child mortality benefits | |||
| Cost per person under age five reached (more) | $1.82 | $1.10 - $3.50 | 18x - 6x |
| Number of children receiving two rounds of VAS per year (more) | ~551,000 | ||
| Percentage of those children who would have received VAS from other sources (more) | 25% | 15% - 45% | 12x - 8x |
| Number of additional children receiving VAS as a result of the program (more) | ~413,000 | ||
| Annual mortality rate among children who do not receive VAS (more) | 1.3% | 1.0% - 1.6% | 9x - 14x |
| Reduction in mortality from receiving VAS (more) | 6% | 1% - 9% | 2x - 17x |
| Number of deaths averted among people age five (more) | 313 | ||
| Initial cost-effectiveness estimate | |||
| Cost per death averted (child mortality only) | ~$3,000 | ||
| Moral weight for each death averted | 119 | ||
| Cost-effectiveness estimate from mortality benefits | 11x | ||
| Summary of primary benefits (% of modeled benefits) | |||
| Percent of benefits from averted child mortality | 80% | ||
| Percent of benefits from income increases in later life (more) | 20% | 5% - 38% | 9x - 14x |
| Additional adjustments | |||
| Intervention-level adjustments (more) | 67% | 48% - 84% | 10x - 12x |
| Grantee-level adjustments (more) | -22% | -40% - -10% | 8x - 13x |
| Adjustment for diverting other actors’ spending into VAS (more) | -3% | ||
| Adjustment for diverting other actors’ spending away from VAS (more) | -37% | -48% - -10% | 9x - 16x |
| Final cost-effectiveness (multiples of cash transfers) | 11x | ||
| Final cost per death averted (see here) | ~$7,000 |
We’ve also considered other perspectives that might not be captured explicitly in these cost-effectiveness estimates (e.g., whether experts see VAS as a good investment). Overall, we’ve spent less time thinking about these questions than we have on our main cost-effectiveness analysis, but the perspectives we’ve considered somewhat lower our confidence that VAS is highly cost-effective. For example, some experts argue that vitamin A supplementation is no longer effective in modern contexts and should be discontinued. (More)
How could we be wrong?
Although our best estimate is that VAS is highly cost-effective, we see the evidence for it as more uncertain than for GiveWell’s other top charities. Our biggest open questions are:
- What was the true impact of VAS at the time the studies we rely on were conducted? Our analysis of the impact of VAS relies on a Cochrane meta-analysis of VAS RCTs (more) and a -25% adjustment to account for ways the meta-analysis estimate could be biased upwards (more). But we have a number of uncertainties about this:
- We have received some expert feedback that the meta-analysis shows evidence of substantial publication bias, implying a smaller effect size on mortality than reported. Our internal validity adjustment intends to account for some possibility of publication bias, but we don’t use any statistical methods to estimate this and we have not systematically investigated this question. It’s possible that doing so would lead to a larger downward adjustment. (More)
- Studies in the meta-analysis vary widely in their estimate of the impact of VAS on mortality (more). We’re unsure how to explain this variation, and the factors that we currently assume are most important in our analysis for determining the effectiveness of VAS across locations (vitamin A deficiency rates and diarrhea and measles rates) do not appear to explain it. (More)
- The main finding in the VAS meta-analysis is sensitive to the choice of analysis (either 12% or 24% reduced mortality overall depending on the analytical approach). We use the larger of these two estimates (24%). This is a judgment call that we have thought through extensively, but if we are wrong it could imply we are significantly overestimating cost-effectiveness. (More)
- The largest and one of the most recent trials of VAS found an effect size that is small and not statistically significant, and we’re not sure what is driving this. (More)
- How effective is VAS in modern contexts? The main studies we rely on were primarily conducted in the 1980s and 1990s, when the infectious disease landscape was different and child health was significantly worse than today. It’s likely that VAS delivered today would result in a significantly smaller reduction in mortality. We attempt to account for this with a -41% to -79% adjustment, but we’re uncertain about this for a number of reasons:
- We don’t have a strong understanding of what mediates the impact of VAS on mortality, meaning we’re unsure what factors to adjust for. (More)
- Our analysis is very sensitive to vitamin A deficiency rates today, but our estimates are based on information we have low confidence in (10 to 20 year old surveys of deficiency, updated for change over time, and modeled estimates from the Global Burden of Disease Project whose methodology we do not fully understand) (more). Since these surveys were conducted, many countries have introduced vitamin A fortification programs, and we’re unsure how effective these have been at reducing deficiency rates. Our understanding is also that measurement of vitamin A deficiency is sensitive to the choice of test used, reducing our confidence in our estimates (more).
- We’re unsure how changes to health environments in the future will affect VAS. Our biggest uncertainty is whether scale-up of another child health program, azithromycin distribution, will avert deaths that would have been averted by VAS, implying the additional benefit of delivering VAS could be lower. (More)
- How many additional children receive VAS as a result of GiveWell funding? We estimate that GiveWell funding substantially increases VAS coverage, but several aspects of the evidence we rely on are limited:
- We have some concerns about the representativeness and comprehensiveness of the coverage surveys we use to estimate the proportion of children reached in GiveWell-funded campaigns. We account for this with a -17% adjustment, but this is a rough guess (more). We have begun the process of cross-checking this data against independent sources, but have not yet finalized or published this work (more).
- Our estimates of the proportion of children who would be reached with VAS through sources other than the campaigns we fund are based on very limited data. (More)
- Should we fund other ways to reduce vitamin A deficiency? To date, GiveWell has only funded VAS via mass campaigns. We haven’t explored other funding opportunities (e.g., vitamin A fortification programs) in detail. (More)
- How reliable are the mortality estimates we rely on? Our cost-effectiveness analysis uses estimates of mortality from measles, diarrhea and all causes from the Global Burden of Disease (GBD) Project. These estimates are based on a number of modeling assumptions that we do not understand in detail, and we have substantial uncertainty about them. (More)
- How accurate was our analysis of VAS in hindsight? GiveWell’s cost-effectiveness analyses are "forward-looking" and aim to predict the impact a program will have at the time we make a grant decision. We have paid less attention to backwards checks to understand how accurate our predictions were. We have begun an analysis to understand how our best guesses about VAS cost-effectiveness have changed over time, but (as of February 2024) haven’t yet finalized or published this work. (More)
- Are there drawbacks to VAS campaigns we’re missing? We think that VAS is one of the most cost-effective programs donors can support. However, our understanding is that there is relatively little investment in VAS from other global health funders and we think there is more scientific controversy around VAS than for GiveWell’s other top recommended charities. This concern is mitigated because VAS is recommended by the WHO, and many national governments in low income countries have VAS programs in place. (More)
Note: The figures in this report are from our February 2024 cost-effectiveness analysis. Our estimates change over time as we gather new information and update our analysis, and so the numbers in this report may not exactly match those in our most recent cost-effectiveness analysis (available here).
GiveWell’s current top recommended organization for VAS is Helen Keller Intl. Our separate page for Helen Keller Intl is available here.
Contents
1. The basics of the program
1.1 What is vitamin A deficiency?
Vitamin A deficiency (VAD) is a common condition in low and middle income countries that can cause stunting, anemia, and xerophthalmia (the "leading cause of preventable childhood blindness").1 It can also increase susceptibility to infection and lead to death.2 Young children (under age five) and pregnant or lactating mothers are at particularly high risk of the negative health impacts of VAD.3 Deficiency is most common in locations where diets include few animal sources and little fortified food.4
1.2 What is vitamin A supplementation (VAS)?
Vitamin A supplementation involves getting 6-59 month old children to swallow a small amount of fluid containing vitamin A, delivered via a single-use capsule. The World Health Organization (WHO) recommends that all 6-59 month old children in areas with high rates of VAD receive VAS every four to six months to reduce morbidity and mortality (note: GiveWell has only funded campaigns due to take place at six month intervals, and we have not seen campaigns taking place every four months).5
1.3 How VAS programs work
VAS is delivered to children through the following approaches:6
- Mass campaigns involve large-scale distribution of VAS to households, either door-to-door or through central distribution sites in a community. In these campaigns, VAS is often co-delivered with other public health interventions, including deworming, polio vaccination, "mop-up" immunizations (for children who have missed scheduled immunizations), and screening for severe acute malnutrition and moderate acute malnutrition.7
- Routine delivery of VAS involves giving children VAS at primary health facilities at other touchpoints they might have with the national healthcare system (e.g., during routine immunizations).
GiveWell focuses on funding mass campaigns, and our analysis below focuses on these campaigns.
VAS campaigns take place under the leadership of governments in low- and middle-income countries, and our understanding is that the workers implementing VAS programs are employees (or volunteers paid a stipend) recruited by the government.8 In many cases, these governments receive support and funding from NGOs. The largest of these are Helen Keller Intl, Nutrition International, and UNICEF (GiveWell currently funds Helen Keller Intl and Nutrition International). We discuss the funding landscape for VAS in more detail below. Helen Keller Intl’s role in campaigns in locations where it supports VAS (largely funding campaigns and providing technical assistance to national and local governments to support effective delivery) is discussed in detail in our separate page on Helen Keller Intl.
2. How GiveWell estimates cost-effectiveness
GiveWell recommends programs that we believe save or improve lives as much as possible for as little money as possible. To estimate this, we produce a cost-effectiveness analysis ("CEA") which aims to produce a best guess of the overall impact of a program per dollar donated.
We use "moral weights" to quantify the benefits of different impacts (e.g., increased income vs reduced deaths). We benchmark to a value of 1, which we define as the value of doubling someone’s consumption for one year. The main moral weights we use for our analysis of VAS are in the table below.
| Benefit | Moral weight (units of value per outcome) |
|---|---|
| Doubling consumption for one person for one year | 1 |
| Averting the death of a 6-59 month old child through VAS | 119 |
For more about how GiveWell thinks about cost-effectiveness, see our discussion on this page.
Notes:
- Our analysis was originally designed for Helen Keller Intl (the first organization that GiveWell funded to deliver VAS), and later updated to incorporate estimates for Nutrition International.9 In this report we focus on our analysis for Helen Keller Intl. We draw out where these estimates differ from our estimates for Nutrition International.
-
In this report, our analysis focuses on quantifying the impact of VAS in the following locations: Burkina Faso, Cameroon, Côte d'Ivoire, DRC, Guinea, Madagascar, Mali, Niger, and five states in Nigeria: Adamawa, Benue, Ebonyi, Nasarawa, and Taraba (for Helen Keller) and Chad (for Nutrition International) (details in footnote).10
-
Our cost-effectiveness analysis includes 25th - 75th percentile confidence intervals for specific parameters.
See the summary table above and this sheet of our cost-effectiveness analysis. These intervals are based on GiveWell staff members’ subjective levels of uncertainty for each parameter (see footnote for more details on our method).11
3. How many people do VAS campaigns reach?
The starting point for our analysis is the number of people who will be protected per $1m in VAS spending.12 We estimate that each $1m spent by Helen Keller13 provides a year’s worth of VAS to between ~551,000 (in Guinea) to ~1 million (in Mali) children.14 A summary of our calculations is below, using one country (Guinea) as an example:
| What we are estimating | Value (rounded) |
|---|---|
| Children in areas of Guinea targeted by Helen Keller, 2018-2021 (including children targeted multiple times) | ~7.7 million |
| Percent of targeted children who got VAS, 2018-2021 (see here) | 78% |
| VAS spending by Helen Keller in Guinea, 2018-2021 (see here) | $4.6m |
| Subtotal: Cost to Helen Keller per child receiving one dose of VAS | $0.77 |
| Additional "upstream" costs incurred by other philanthropic actors per child receiving VAS (see here) | $0.14 |
| Supplementation rounds per year | 2 |
| Total (children treated per year with VAS per $1m) | ~551,000 |
See this spreadsheet for our cost per child calculations and this document for detailed notes on our approach.
Our main open questions and reservations are (more below):
- We’re unsure how many children would receive VAS in the absence of GiveWell-funded campaigns, and our current 25% estimate is based on limited data.
- Our best guess is that Helen Keller’s post-campaign coverage surveys overestimate the number of children reached with VAS. We include a -17% adjustment to account for this, but this is a rough guess. We have started to check these estimates against independent surveys, but haven’t yet completed or published this work.
- We do not have direct evidence that GiveWell funding leads to increases in VAS coverage (e.g., from VAS surveys immediately before we started to fund VAS in a given location, and immediately afterwards). Instead, we rely on inferring coverage increases from the proportion of children reached in Helen Keller’s campaigns, rough estimates of how many children would have been reached in the absence of these campaigns, and our impression that Helen Keller’s activities plausibly lead to coverage increases.
- Our analysis relies on target population estimates (the number of 6-59 month old children in each location). We think these are drawn from administrative data, and we’re unsure how reliable they are.
- We include other philanthropic actors’ financial contributions in our analysis, but the costs we include may not be comprehensive.
3.2 How much does it cost to reach a child with VAS?
We calculate the cost per supplement delivered in each country based on the following estimates:
- The number of children reached by previous Helen Keller-supported VAS programs.
- Costs incurred by Helen Keller.
- Costs incurred by other actors.
We then multiply this by two to obtain the annual cost per child reached because we expect our grantees to deliver two VAS campaign rounds per year in each location.17 When estimating the number of children reached per $1m of GiveWell spending, we use an adjusted estimate that excludes donated VAS capsules and in-kind government contributions (more below). This is $1.82 per year in Guinea, or $0.91 per round.18
Number of children reached
We estimate the number of children reached on this sheet in each campaign using the following sources of data:
- Target populations (i.e., the number of children aged 6-59 months) in regions with Helen Keller supported-campaigns. These figures are provided by Helen Keller and our understanding is that they are based on administrative data from national governments. A key uncertainty in our analysis (discussed below) is that we do not know how reliable these estimates are or the methods used to collect them. In Guinea, we estimate that 7.7 million children were targeted for VAS in areas supported by Helen Keller between 2018 and 2021 (i.e., approximately one million children per round over eight rounds).19
- VAS coverage. Helen Keller conducts surveys after VAS campaigns to understand what proportion of children in the target population were reached. These surveys are discussed in detail in our separate report on Helen Keller’s program. In summary:
- We think that these surveys provide some evidence that a high proportion of the target population was reached in previous campaigns. The median coverage20 in previous surveyed campaigns was 85%.21
- We have some concerns about the surveys that reduce our confidence in them, in particular, whether the results we’ve seen are representative of Helen Keller’s whole program. Helen Keller usually conducts surveys for only one of the two campaign rounds it delivers per country per year, and in some surveys only some regions or districts are surveyed and not selected randomly. The regions surveyed may not be representative, and our best guess is that coverage in surveyed regions will be higher than in non-surveyed regions. This implies that using unadjusted coverage figures could inflate our estimates of the number of children reached upwards.22
For each campaign, we multiply the estimated coverage rate (the percentage of children who received VAS) by the target population to estimate the total number of supplements delivered in that campaign.23 For campaigns where Helen Keller did not conduct a coverage survey, we use the median value from other coverage surveys conducted in the same country. In Guinea, Helen Keller’s surveys imply that 78% of children were reached between 2018-21.24
Our best guess is that the headline reported coverage figures are inflated because of the concerns we identify above. To account for this, we incorporate a -17% adjustment elsewhere in our analysis (discussed below). This figure is a rough estimate of how much we think our concerns are likely to inflate estimates of the number of children reached.25
Helen Keller costs
Our estimates of Helen Keller’s cost per supplement are based on Helen Keller’s spending on previous VAS campaigns. This spending is broken down by country in this sheet of our cost per supplement analysis.26 In total, Helen Keller spent approximately $3m on GiveWell-supported VAS programs in 2018, rising to approximately $15m in 2021.27 In Guinea, we estimate that Helen Keller spent ~$4.6m on VAS over the whole period.28
Other actors’ costs
Other actors also contribute resources to the VAS campaigns that Helen Keller supports. The costs we include in our analysis are:
- Other actors’ financial contributions to previous campaigns. The campaigns Helen Keller supports sometimes receive additional funding from other NGOs and national ministries of health. We include these contributions in our analysis, although in some cases we only have limited detail on what the funding was used for. Our method for including these contributions therefore relies on a number of uncertain assumptions (details in footnote).29 In Guinea, the only costs we include here are WHO costs for polio campaigns that were co-delivered alongside VAS in 2018-19, accounting for an estimated $0.14 per capsule delivered (calculation in footnote).30
- Spending on donated capsules. The vitamin A capsules used in Helen Keller-supported campaigns are donated by another NGO, Nutrition International, using funding from the Government of Canada.31 We estimate that each capsule costs $0.07 to purchase and distribute. This estimate is based on an estimate of $0.04 per capsule from a 2007 published paper (Neidecker-Gonzales et al. 2007). We then apply an inflation adjustment and a rough guess that 10% of donated capsules will be lost or wasted.32
- Estimates of in-kind government contributions. The VAS campaigns that Helen Keller supports are ultimately managed by national governments’ ministries of health. We would expect Helen Keller’s funding to divert some ministry of health resources (e.g., staff time, office space etc.) towards VAS campaigns that might otherwise have gone towards other activities. We estimate that these in-kind contributions account for 30% of the total costs to deliver each supplement.33 This is based on a single 2011 paper evaluating the costs of a deworming program in Niger (Leslie et al. 2011).34 We would guess that VAS and deworming programs (which both take the form of mass public health campaigns) would require relatively similar types of government contributions, but we nonetheless think of this estimate as a rough best guess. Our cost-effectiveness analysis is not very sensitive to this estimate, and so we have not prioritized further work on this question.
We use the cost per supplement excluding the costs of donated VAS capsules and in-kind government contributions when estimating the number of children reached per $1m spent by Helen Keller (summarized in the table above).35 We consider the spending on donated capsules and in-kind government contributions (but not financial contributions from other philanthropic actors) that we include in our analysis to be "leveraged."36 This means that we think that Helen Keller’s VAS spending on VAS campaigns results in more of these resources being used for VAS and less of these resources being used for other activities than they otherwise would be. Because we think Helen Keller’s spending causes these costs to be incurred, we adjust the impact of the program downward to account for benefits that are lost as a result of these funds not being spent elsewhere (more below).
3.3 How many children would have received VAS without campaigns?
Our understanding is that in countries where GiveWell funds VAS, children may also receive VAS through other sources (e.g., as part of each country’s routine immunization schedule).37 We estimate that 25% of children reached by GiveWell funding in most countries38 would have been reached from other sources in the absence of our funding, and therefore these children do not receive additional benefits from GiveWell funding for VAS.39
Our 25% best guess is not based on a specific calculation. Instead, we reach this figure from triangulating several different considerations and data sources:
- Estimates of routine coverage of VAS that we’ve seen vary by location but are generally reasonably high. In Kenya, Helen Keller estimates that approximately 20% of children are reached through the routine distribution system.40 Helen Keller has also funded (unpublished) surveys in regions of three countries where there was no external support for VAS campaigns and where Helen Keller may support in the future. These found coverage of 43%, 44%, and 47% respectively.41 We would expect these figures to be higher than in most countries where we support VAS (because they were thought to have stronger routine delivery of VAS), but they indicate that some governments in low-income countries may have the capacity to deliver moderate VAS coverage with little to no external funding.
- We would expect that data on routine coverage of VAS is fairly unreliable. Coverage data is either gathered through administrative data from a country’s healthcare system (which may be prone to a number of different biases), or through coverage surveys of caregivers asking about whether their child received VAS over the previous six months. We would expect these surveys to suffer from recall bias, particularly as some caregivers may not remember the timing of past treatments or the differences between treatments that their child received in healthcare appointments (some of which may have taken place months before).
- Our understanding is that the children who are most likely to receive VAS through the routine healthcare system are in the youngest age band eligible for VAS (6-12 months old), because these children are most likely to visit health centers for routine immunizations.42 We think that these are the children who are also most likely to benefit from VAS (mortality in the 6-59 month old period is concentrated in the youngest age bands). All else equal, we think that this should increase our downward adjustment (and therefore reduce our estimate of cost-effectiveness). Our 25% estimate roughly accounts for this factor (i.e., we use a slightly higher value than we otherwise would, to account for children receiving VAS in the absence of our funding being at higher risk of mortality), but we have not explicitly modeled this and it’s possible that we’re not accounting for it sufficiently.
We use a different approach in Madagascar, (relying on 2021 Demographic and Health Survey coverage estimates for the specific regions where Helen Keller delivers VAS campaigns).43 We would expect this method to be more reliable, but do not have equivalent data available for other countries (details in footnote).44
-
How many children would receive VAS in the absence of GiveWell-funded campaigns? We currently estimate that this figure is 25% in most countries, but this is a rough estimate and we use the simplifying assumption that it is the same across countries (which we think is likely to be incorrect). We may spend more time improving our estimates in the future with additional research (e.g., collecting data on the proportion of children who received VAS from other sources in Helen Keller’s post-campaign surveys).
- What proportion of children do Helen Keller-supported campaigns reach? We currently account for the possibility that Helen Keller’s coverage surveys overestimate the number of children reached with a -17% adjustment.45
This is a rough guess.
As of February 2024, we’re currently in the process of cross referencing Helen Keller’s surveys against other surveys (from the Demographic and Health Surveys), which we hope will provide an independent check on the proportion of children reached with VAS. But we haven’t yet finalized or published our analysis.
- How much do Helen Keller’s activities lead to increases in VAS coverage? We do not have direct evidence that GiveWell funding for VAS leads to increases in VAS coverage (e.g., from coverage surveys immediately before we started to fund VAS in a given location, and immediately afterwards). Instead, we rely on inferring coverage increases from the proportion of children reached in Helen Keller-supported campaigns, and rough estimates of how many children would have been reached in the absence of these campaigns. We would expect this to be less reliable (discussion in footnote).46
- An additional uncertainty is exactly how Helen Keller’s specific activities lead to increased VAS coverage. Helen Keller provides funding and technical support for governments to run campaigns.47 Intuitively, we would expect this to increase the number of children receiving VAS, either by ensuring campaigns that would have been skipped take place, or by increasing coverage in campaigns that would have taken place in any case.48 However, we have not deeply investigated all the links in this theory of change or attempted to corroborate this (e.g., by speaking to ministries of health where Helen Keller works).
- Target population data. Our estimates of the number of children reached with VAS are based on data on the number of children aged 6-59 months in regions with Helen-Keller supported campaigns. Our understanding is that these figures are based on administrative data from national governments. We have not investigated this data in detail, and it is possible that these estimates may be unreliable or outdated. In August 2022, we commissioned IDinsight to interrogate the target population estimates we use for Helen Keller's VAS program and others. As of February 2024, we have received the results from this work but have not yet concluded how they should affect our analysis or published the findings.
- Uncertainty about other actors’ spending. Our estimates of other NGOs’ costs may not be comprehensive and we do not have an easy way to know how comprehensive they are.
- One reason to think we may be undercounting costs in some locations is that we calculate surprisingly low cost per supplement estimates (varying between $0.53 and $0.72) for Helen Keller-supported programs in Côte d’Ivoire, the Democratic Republic of the Congo (DRC), Kenya, and Nigeria. Our best guess is that these figures are too low to be plausible. One reason they are so low may be that some other actors’ costs are not included in our analysis,49 although Helen Keller has suggested reasons for these lower costs that we also think are plausible (details in footnote).50
- Because of our uncertainty, we use an average cost per supplement figure of $1.02 (the weighted average of all other countries’ cost per supplement in our analysis) for these four countries.51 This is a somewhat conservative assumption, because there may be reasons that costs are lower in these countries. We hope to update our analysis to obtain a more accurate estimate for future grants.
4. What impact do VAS campaigns have?
4.1 Summary
Our cost-effectiveness analysis models two main benefits from VAS campaigns:
- Reduced mortality for children under age five (more).
- Increased long-run income, from improved health in a sensitive developmental window of childhood (more).
A summary of the contributions of each type of benefit to our estimate of the modeled value of the program is below, using Guinea as an example.52
What we are estimating % of modeled benefits Reduced mortality for young children 80% Long-term income increases 20% We also include a number of supplemental adjustments to account for additional benefits and offsetting impacts. Rather than explicitly modeling these, we have applied percentage adjustments based on our best guesses.
- We divide these into intervention-level factors (e.g., costs averted from treatment of illness), which increase our cost-effectiveness estimate by 67% overall (more), and grantee-level factors (relating to the implementation of the program), which reduce our estimate by 22% overall (more).
- We also include an adjustment to incorporate the impact of our grantee’s funding on other actors’ spending. This adjustment varies by location from -21% to -47% (-40% in Guinea). (More)
- Overall, we estimate that it costs between ~$1,000 (Niger) and ~$8,500 (Côte d’Ivoire) to avert a child’s death through VAS campaigns (varying by location).53 This equates to being approximately 9 to 59 times as effective as spending on unconditional cash transfers.54
4.2 Reduced mortality for young children
We estimate that each $1m spent on VAS campaigns averts ~230 to ~1,500 deaths of 6-59 month old children (varying by location, ~313 in Guinea).55 A summary of our calculations is below, using one country (Guinea) as an example:
What we are estimating Value (rounded) Number of additional children under five protected for one year (discussed above) ~413,000 Reduction in mortality among children receiving VAS (more) 5.9% Mortality rate for children under five not receiving VAS (more) 1.28% Total (under-five deaths averted) 313 Some of the major uncertainties in these estimates are:
- Whether VAS is still effective in the context of improved child health in the time since the studies we use in our analysis were conducted (more).
- How to interpret variation between studies of VAS (some finding large effects, others a small or no effect). (More)
- Our analysis relies on uncertain estimates of vitamin A deficiency (more) and VAS-susceptible disease mortality (more) in contexts where VAS is delivered today, relative to the underlying studies.
What is the impact of VAS on mortality?
Summary
Overall, we estimate that receiving VAS treatment reduces a child’s mortality risk by 4% (Benue state, Nigeria) to 12% (Madagascar and Chad), varying by location.56 A summary of our calculations is below using one country (Guinea) as an example:
What we are estimating Value The impact of being targeted for VAS from a published meta-analysis (more) 24% Proportion of children who received VAS in studies in the meta-analysis (used to convert to the impact of receiving VAS) (more) 87% Subtotal: Reduction in child mortality from receiving VAS in previous studies 27% Internal validity adjustment (more) -25% External validity adjustment (more) -71% Total (reduction in child mortality from receiving VAS) 6% How much does being targeted for VAS reduce mortality?
As a starting point, we use results from a systematic review and meta-analysis by Cochrane,57 Imdad et al. 2017, to estimate the impact of VAS on child mortality.58 This summarizes 47 randomized controlled trials of VAS,59 of which 19 reported findings on child mortality.60
The review’s main finding is that VAS significantly reduces child mortality. However, the results varied substantially between studies and the specific estimate of reduced mortality is sensitive to the choice of analysis the authors used (either 12% or 24% overall depending on the analytical approach).61 We use the 24% "random-effects" estimate as the main input into our cost-effectiveness analysis because we think that the impact of VAS might vary substantially across study contexts (more below).62 We have considered this issue in detail, but it remains a major uncertainty in our analysis, because if we are wrong about this call it implies we might be substantially overestimating the benefits of VAS.
Overview of the Cochrane meta-analysis
Imdad et al. 2017 evaluated 47 studies of VAS from 19 countries. The primary analysis (all-cause mortality) included 19 studies involving approximately 1.2 million children.63 The follow-up period for these studies varied from 3 months to 5 years, with most lasting 1 to 2 years.64
The main finding from this analysis was that VAS reduced child mortality by 12% (95% Confidence Interval ("CI") 7% to 17%) using a fixed-effects statistical model. As a sensitivity check, the authors also conducted an alternative analysis using a random-effects model which estimated that VAS reduced child mortality by 24% (95% CI 12% to 34%).65 We discuss the difference between the fixed-and random-effects models and how we interpret these results below.
Secondary analyses included:
- Cause-specific mortality.
- VAS reduces diarrhea mortality by 12% (95% CI 2% to 21%, nine studies).66
- VAS reduces measles mortality by 12%, although this was not statistically significant (95% CI 11% increase to 31% decrease, six studies).67
- VAS did not significantly reduce mortality from lower respiratory tract infection (LRTI), nine studies.68
- In general, the estimates of the effect of VAS on cause-specific mortality are more imprecise and vulnerable to bias than the primary analysis.69 The authors assessed the evidence quality for diarrhea mortality as high, and for measles and LRTI as low.70
- Cause-specific morbidity. Mortality was the primary outcome of interest in most studies of VAS and there is less evidence of VAS’s impact on morbidity. However, the review found:
The review assessed included studies for risk of various biases. While the risk of bias was variable across studies, the authors determined the risk of bias for the primary outcome (mortality) was low overall, and the significant effect was unlikely to be explained by bias.74 Because studies may be more likely to report secondary outcome data when they find positive results, the cause-specific mortality and morbidity analyses are potentially affected by selective reporting bias.75 We have not independently assessed these studies’ risk of bias.
We note that the meta-analysis of mortality includes trials of various sizes and our understanding is that not all these trials were designed to measure the impact of VAS on mortality. We’ve received feedback from Dr. Keith West, Professor of Infant and Child Nutrition at Johns Hopkins University, that smaller trials may not be as informative for assessing the impact of VAS on mortality (details in footnote).76 We’re considering (but haven’t yet prioritized) alternative analyses that exclude these trials.
The Deworming and Enhanced Vitamin A (DEVTA) study
One of our key uncertainties about the evidence for VAS is interpreting the findings from DEVTA (Awasthi et al. 2013a), a very large VAS trial included in the Cochrane review. The study found that VAS reduced child mortality by 4% and cannot rule out the possibility that VAS did not affect child mortality at all (the 95% confidence interval ranged from a 3% increase to an 11% decrease).77
At the time it was delivered, DEVTA was the largest randomized controlled trial ever conducted and included about one million children, roughly four times as many participants as the combined number of participants in all the other studies included in the Cochrane review.78 Key features of the study were79 :
- It tested both VAS and deworming in rural Uttar Pradesh (UP), India from May 1999 through April 2004. Children in different administrative blocks were randomized to receive either VAS, albendazole (a deworming medicine), both, or neither.
- VAS was administered by workers at village anganwadi child-care centers (AWCs). Children in the VAS group were scheduled to receive VAS every six months.
Why did DEVTA’s results differ from previous studies?
We have considered four possible reasons why DEVTA’s results might differ from previous studies:
- Lower mortality and better child health than in previous studies
- Lower vitamin A deficiency rates
- Possible low coverage in DEVTA
- Incomplete measurement of mortality
We do not find any of these explanations fully compelling. Our best guess is that coverage in DEVTA was lower than reported, and that this contributed to the unexpectedly small effect size, but coverage would need to be drastically lower than reported to explain the full gap. We discuss each potential explanation below.
Better overall child health and lower mortality than in previous studies
The baseline level of child mortality in DEVTA was lower than most of the other trials which are highly weighted in the Cochrane review. The absolute risk of death from age 1-6 years in DEVTA's control group was 2.64%, which implies a mortality rate of about 5.3 per 1,000 child-years.80 This is lower than control group mortality in four of the five studies which (along with DEVTA) account for the most weight in the Cochrane review,81 considerably lower than three of the five, and the same control group mortality as the study that had the lowest rate of the five (Herrera et al. 1992, which also found no impact of VAS). See Table 1 below.Table 1: Mortality rate and mortality risk ratio in DEVTA and the five main studies used in the Cochrane review's estimate of the effect of VAS on all-cause mortality
Study Age group Location Mortality in control group (per 1,000 child-years) Mortality risk ratio (95% CI)82 Awasthi et al. 2013a (DEVTA) 12 to 72 months83 72 administrative blocks in 7 districts, north India84 5.385 0.96 (0.89 – 1.03) Ross et al. 1993 6 to 90 months86 Kassena-Nankana District (Ghana)87 29.588 0.81 (0.68 – 0.98) West et al. 1991 6 to 72 months89 Sarlahi District, Nepal90 16.491 0.70 (0.56 – 0.88) Herrera et al. 1992 9 to 72 months92 Five rural councils in northern Sudan93 5.394 1.06 (0.82 – 1.37) Daulaire et al. 1992 1 to 59 months95 Jumla District, Nepal96 12697 0.74 (0.55 – 0.99) Sommer et al. 1986 0 to 71 months98 Aceh Province, Indonesia99 10.6100 0.73 (0.54 – 0.99)101 Lower overall child mortality rates may limit the effectiveness of VAS at preventing further mortality if, for instance, the deaths averted in previous trials are already being averted by other improvements in health.
The evidence from the Cochrane review indicates that deaths prevented by VAS are in part due to reduced diarrhea and measles mortality.102 If DEVTA participants were less vulnerable to dying from these diseases than participants in other studies, we would expect VAS to have a smaller effect on mortality. For example, measles vaccination campaigns and access to oral rehydration therapy may have decreased the deadliness of these diseases in some locations in the decade between most of the studies reviewed in the Cochrane report (the 1980s and 1990s) and DEVTA (1999 - 2004). Globally, there is evidence that deaths from diarrhea and measles did decline in this period.103
However, we do not have specific evidence that measles or diarrhea were less common in DEVTA than previous studies:
- Among the nonrandom subsample of DEVTA’s control group that received biomedical visits, 1.4% had measles over a period of four weeks and 44.1% had diarrhea.104 We do not have directly comparable data from the other five highly-weighted studies in the Cochrane review, but the available data suggests rates of measles and diarrhea that were similar.105
- We checked estimates of measles and diarrhea mortality from the Global Burden of Disease (GBD) project from the closest available times and locations to where each study in the meta-analysis was conducted (e.g., India in 2001 for DEVTA).106 This comparison is very rough because we’d expect historical estimates of cause-specific mortality to be even more unreliable than contemporary estimates, and GBD national-level estimates might not reflect the conditions of each study.107 In so far as this comparison is useful, it suggests that the share of mortality attributable to diarrhea and measles (~28% in India in 2001, proxying DEVTA)108 was similar to other studies in the meta-analysis (weighted average of 34% overall).109
- The explanation that lower baseline mortality could explain the discrepancy is also undermined to some extent by another analysis we have seen (of eight VAS studies) which found no correlation between each study’s baseline mortality rate and the impact of VAS on mortality in that study.110
Overall, our conclusion is that there is not strong evidence that lower rates of measles and diarrhea explain the unexpected DEVTA result.
Vitamin A deficiency rates
We have considered the possibility that the discrepancy between DEVTA and previous studies might be due to lower vitamin A deficiency (VAD) rates (e.g., because the prevalence of VAD has declined over time, and DEVTA took place later than other studies in the Cochrane review). The data does not appear to support this, although we cannot rule it out as an explanation entirely.111 The estimated rate of VAD among children in the control group who were tested in DEVTA was around 65%, compared to a weighted average of 59% across all studies in the Cochrane review.112 See this spreadsheet for a detailed comparison.Possible low coverage in DEVTA
Unlike many previous trials, DEVTA evaluated a large-scale program, where we would expect delivery to be more challenging. If a high proportion of DEVTA participants were not actually receiving treatment, this could help explain a smaller effect size.DEVTA’s published coverage rate was 86%.113 This rate is very similar to the coverage reported in previous trials.114 However, DEVTA’s coverage data has been called into question by researchers who believe the study was not implemented as rigorously as previous trials and that it is implausible to achieve such high coverage at such low cost.115
DEVTA implemented three main strategies to monitor the coverage rate:
- Anganwadi worker records based on mid-study census: In year 3 of the study, study monitors compiled a census of ~1 million eligible children from local records.116 Workers at anganwadi children’s centers (where VAS was delivered) counted children treated against this census after mass treatment days. These records were used to estimate the main 86% reported coverage rate from the study.117
- Caregiver reported coverage: Researchers conducted annual visits to randomly-selected anganwadi children’s centers once a year. A non-random group of children were selected (often from anganwadi worker lists, and therefore disproportionately children who were already registered with anganwadis).118 During these visits, caregivers were asked whether their child received VAS on the previous mass treatment day. 91% of caregivers reported receiving VAS, slightly higher than the main coverage results.119
- Random site visits: Unannounced visits were conducted to 25% of anganwadi centers in the vitamin A group on or just after treatment days. These found 99% were delivering vitamin A as planned.120
Our best guess is that these methods are fairly unreliable, and that the study’s reported coverage rate is likely to be an overestimate:
- There’s evidence that access to anganwadi centers (where VAS was delivered in DEVTA) was fairly low around the time the study was conducted. In India’s National Family Health Survey in 2005-6 (shortly after DEVTA ended), only 19% of children under age six had received any service from an anganwadi center in Uttar Pradesh in the previous year.121 We expect that it would be inherently challenging to increase coverage to the high rates seen in DEVTA from a low baseline.
- The specific methods used to assess the coverage rate are poorly documented in the study.122 It’s plausible that they were prone to bias (especially if workers were incentivized to report high coverage).
- The methods used to compile the study census are also poorly documented and we’re not sure what records the census is based on.123 We think it’s possible that the census did not count all eligible children in the study areas. Since our understanding is that coverage measurement was based on lists of eligible children from this census, any undercount would bias reported coverage upwards. The census was also only available from the middle of the study onwards and therefore doesn’t measure coverage from the first two years (although our best guess is that this is not a significant problem, details in footnote).124
- The caregivers interviewed about VAS coverage were drawn from a convenience sample in which children registered with anganwadi centers were overrepresented (likely biasing coverage upwards).125
DEVTA also reports evidence of substantial reductions in markers of vitamin A deficiency (details in footnote).126 Our understanding is that deficiency biomarkers were (like the caregiver interviews) only drawn from a convenience sample in which children registered with anganwadi workers were overrepresented127 , and so we’d expect these reductions to be somewhat overestimated. While it is not possible to directly derive a coverage estimate from these results, we interpret this as some evidence that coverage was not extremely low, but not strong evidence that coverage was as high as the 86% reported.
Overall, we expect that lower-than-reported coverage could be a factor contributing to the gap between DEVTA’s results and those from other studies in the meta-analysis. However, DEVTA's coverage rate would have to be substantially lower than estimated in order to explain the entire gap between the point estimate in the study and the point estimate from the meta-analysis of previously executed trials. A rough calculation suggests that the DEVTA coverage rate would have to be below 20% to fully explain this difference.128 We think this is unlikely.
Incomplete measurement of mortality
In 2023, we received feedback on our analysis of VAS from Kenneth Brown, Distinguished Professor Emeritus at UC Davis, arguing that the results of DEVTA might be biased because of ascertainment bias (i.e., mismeasurement of deaths).129 Similar points have been leveled by other researchers in the past.130 While we would expect the study’s methods for measuring mortality to be unreliable (details in footnote),131 we don’t have any reason to think this would apply more to children in areas receiving VAS than control areas, and so this does not significantly affect our interpretation of the study results.Should we use the fixed-effects or random-effects estimate?
Interpreting the findings of the Cochrane review is challenging because the review estimates two impacts of VAS on mortality of different magnitudes: a fixed-effects estimate that VAS reduces child mortality by 12%, and a random-effects estimate that VAS reduces child mortality by 24%. Each of these should be interpreted as estimating a different thing:
- Fixed-effects: A fixed-effect meta-analysis assumes that the true impact of the intervention is consistent ("fixed") in every study in the analysis. Differences between study results are assumed to be solely down to chance. The main estimate from the analysis can be interpreted as the typical intervention effect.132
- Random-effects: A random-effects meta-analysis assumes that the true impact of the intervention being estimated varies and follows some distribution.133 The main estimate from the analysis can be interpreted as the average impact of the intervention across heterogenous studies with different findings.134
In the Cochrane meta-analysis, the two estimates differ largely because of the treatment of DEVTA. DEVTA receives a very large proportion (over 60%) of the weight in the fixed-effect meta-analysis, because of its very large sample size and the high precision in its mortality estimate. It receives considerably less weight (around 14%) in the random-effects meta-analysis.135
We use the estimate from the random-effects analysis (that VAS reduces child mortality by 24%) as the main input for estimating the impact of VAS on mortality in our cost-effectiveness analysis.136 This is because we think that VAS is better suited to the assumptions of a random-effects meta-analysis (i.e., that the true impact of the intervention varies across study contexts).137 The studies evaluated in the Cochrane review involved different populations with varying levels of child mortality and vitamin A deficiency, as well as different dosages and delivery models.138 We think it is plausible that these differences may lead to meaningful differences in vitamin A efficacy across different studies.
Open questions and uncertainties
- Because the difference between the fixed-effects and random-effects estimates of VAS in the Cochrane review is so large (12% vs 24% reduction in mortality), our cost-effectiveness analysis is very sensitive to the choice of input we use. If we are wrong about this decision it implies we could be overestimating cost-effectiveness by a factor of ~2.139
- Our reasoning for preferring the random-effects approach is that the effectiveness of VAS is likely to vary across study contexts depending on factors like overall child health. We have explored several potential differences in study contexts between DEVTA and other key studies in the Cochrane review (as discussed above), but none of these explanations are fully persuasive.
How much does receiving VAS reduce mortality?
We estimate that the reduction in mortality among children receiving VAS treatment in the Cochrane studies was 27%. We get to this figure by dividing the estimated effectiveness of VAS on mortality (24%) by an estimate of the proportion of children in the Cochrane studies who received VAS (~87%); (24% / 87% = ~27%).140 This estimate is based on a weighted average from 12 studies in the Cochrane analysis which reported VAS coverage. See our coverage estimates spreadsheet for our calculations. We have a number of open questions about this adjustment, but we think these are unlikely to make a significant difference to our bottom line (details in footnote).141
Adjustment for internal validity (study quality)
We adjust our initial estimate of the impact of VAS on mortality among treated children (27%) downwards by -25%142 to account for possible problems with the quality of the underlying studies (their "internal validity").
This adjustment reflects our best guess that the true reduction in mortality in these studies was somewhat lower than the published estimate.
While we have not quantified a prior on the effect of VAS, we think the effect found in these studies seems high, compared to other benchmarks we’ve considered. These are:
- This effect is among the highest we have seen for any child health program (details in footnote).143
- We estimate that ~60% of children in the underlying studies were vitamin A deficient.144 It’s likely that VAS has the largest mortality impacts for these children. If we roughly assume that the mortality impact of VAS was only ⅓ as large for children without VAD as with VAD, it implies reduced all-cause mortality of almost 40% for children with VAD (calculation in footnote).145 If VAS did not avert mortality for non-deficient children at all, the implied mortality reduction among deficient children is almost 50%.146 We think these estimates are even more implausibly high.
We also have high uncertainty about the main reported result in the meta-analysis. Main drivers of uncertainty:
- We’re uncertain about the mechanism through which VAS reduces mortality (more below). All else equal, we would put more weight on a finding if the mechanisms for averting mortality were clearly understood and uncontested.
-
There is significant heterogeneity between studies in the meta-analysis, with some studies finding large impacts on mortality and some finding small or no effects. Of the 19 studies included in the all-cause mortality analysis, 6 studies reported relative risks close to or over 1.147 While these results are incorporated into the overall reported meta-analytic estimate, we’re not sure why VAS was ineffective in these studies, and they increase our overall uncertainty.
These uncertainties cause us to put less weight on the meta-analysis finding and more on the other benchmarks we’ve considered, which suggest a smaller effect. This leads us to make a downward adjustment.
In addition to this adjustment to reflect our skepticism about the size of the meta-analysis finding, we think there may be specific sources of bias that could lead to the meta-analysis finding to be overstated. In general, we think that published studies are more likely to overstate an intervention's efficacy than understate it (e.g., because of publication bias). Most of the studies in Imdad et al. 2017 were conducted in the 1980s and 1990s, and our best guess is that the overall quality of published research in that period was lower than it is today.
In 2024, we received feedback from Dr. Rachael Meager148 and Dr. Witold Więcek149 that the Cochrane meta-analysis we rely on in our analysis shows evidence of substantial publication bias. Based on unpublished work, Dr. Meager and Dr. Więcek told us that applying a statistical adjustment to account for the likelihood of this bias substantially decreases the overall estimate of VAS on mortality from the 24% random-effects estimate reported.150 The Cochrane meta-analysis uses a funnel plot to assess likelihood of publication bias, but does not identify publication bias as a problem, use statistical tests to quantify or apply adjustments to account for it.151
Our internal validity adjustment is intended to account for a number of factors that could mean the true impact of VAS is lower-than-reported, including publication bias. But we do not currently use any statistical methods to account for this in our analysis and we haven’t deeply investigated this question. It’s possible that doing so would substantially reduce our estimate of the impact of VAS on mortality.
We plan to actively investigate this question and consider whether we should update our adjustment. Research we may conduct to do this:
- Reviewing Dr. Meager and Dr. Więcek’s analysis in detail.
- Speaking to VAS experts to understand how likely it is that the VAS literature is affected by publication bias (e.g., asking whether they are aware of VAS trials that went unpublished).
Another thing we could do (but have not yet prioritized) to update our internal validity adjustment is conduct a deep review of each study in the meta-analysis to identify possible biases. The Cochrane reviewed assessed overall risk of bias for the main mortality outcome as low risk of bias,152 but we haven’t independently assessed this.
External validity adjustment
Summary
We include a downward adjustment for external validity of -41% (Madagascar) to -79% (Benue State, Nigeria), varying by location.153 This adjustment accounts for overall improvements in child health in the locations where GiveWell funds VAS today compared to the contexts in which it was studied in Imdad et al. 2017. We think that VAS is likely to be less effective at reducing mortality in the contexts where we fund it today because of lower VAD rates and because a lower share of child deaths are due to measles and diarrhea.
A summary of our calculations for one country (Guinea) is below as an example and our full calculations are available in our cost-effectiveness analysis.
What we are estimating Value Estimated prevalence of vitamin A deficiency (VAD) in studies in Imdad et al. 2017 (more) 59% Estimated prevalence of VAD among 6-59 month olds in Guinea today (more) 28% Subtotal: Component 1 - adjustment for changes in VAD rates (more) -53% % change in share of deaths due to measles and diarrhea in Guinea today relative to Imdad et al. 2017 (see here) -65% % change in share of deaths due to all infectious diseases in Guinea today relative to Imdad et al. 2017 (see here) +2% Weight given to changes in measles and diarrhea vs. all infectious diseases as mechanisms for VAS reducing mortality (see here) 80% / 20% Subtotal: Component 2 - adjustment for changes in causes of child mortality (more) -52% Adjustment for changes in VAD and causes of child mortality not being independent154 -25% Combined adjustment for VAD and causes of child mortality, adjusted for dependence 29% Total (adjustment for external validity) -71% Changes in vitamin A deficiency
The first component of our analysis is an adjustment of -69% to -36% (varying by location) to account for rates of VAD in locations where GiveWell supports VAS programs being lower than the VAD rates in Imdad et al. 2017.155 Our calculations are available on this sheet of our cost-effectiveness analysis.
We would expect that the effectiveness of VAS in a given context is likely to vary with the population deficiency rate. We assume that the impact of VAS on mortality declines linearly with the rate of deficiency in the target population. This is an uncertain assumption because it’s possible that VAS also averts mortality among non-deficient children, and the available evidence from the Imdad et al. 2017 trials suggests that the estimated deficiency rate in each context is not correlated with the impact of mortality in that trial (more below).
Our approach:
-
We estimate that overall VAD prevalence among children in the studies in Imdad et al. was 59%.156 This estimate is a weighted average of VAD prevalence rates for studies in the meta-analysis.157 Where prevalence data was not available in the underlying study, we used a combination of sources to create a best-guess estimate (details in footnote).158 In many cases deficiency data was not available, and so we see these estimates as very uncertain.
-
We estimate that contemporary VAD prevalence among 6-59 month olds in locations with the largest GiveWell supported programs ranges from 18% (Benue State, Nigeria) to 38% (DRC), varying by location (our estimate for Guinea is 28%).159 These estimates are based on several sources of data:
- Estimates of VAD from IHME's Global Burden of Disease (GBD) Project: We use estimates from GBD 2017 on the prevalence of VAD among 6-59 month old children.160 Note that this is a different source to the GBD estimates (GBD 2019) we use to estimate child mortality rates in our analysis. The reason for the discrepancy is that there were significant shifts in VAD rates in some locations GBD 2019 that we do not fully understand, reducing our confidence in the estimates (discussion below).
- Estimates of VAD from national surveys: Where they exist, we put some weight on national surveys of VAD (summarized in this sheet). The most recent surveys in each country took place between 1997 in Mali to 2011 in Kenya,161 and so we adjust their estimates of VAD downwards to account for our expectation that VAD rates have fallen over time. This adjustment is based on changes in measures that we think might be a proxy for VAD in Nigeria only between 2003 and 2018, and applied to other countries. We think it should be considered very rough.162
-
Estimates of proxies for VAD in Nigeria from state-level surveys: In Nigeria, the only country in our analysis where we analyze VAD at the state level, we have low confidence in state-level GBD estimates of VAD (details in footnote),163 and have not found any recent state-level VAD surveys to use instead. We therefore use national-level data from the most recent survey available (adjusted for change over time).164 We then adjust this data to create state-level estimates. Our adjustment uses estimates of four proxy measures (stunting, acute malnutrition, anemia, and poverty) from the Nigeria 2018 Demographic and Health Survey and 2018-19 Nigerian Living Standards Survey (NLSS).165 See this section of the CEA for our calculations.
- We assign each source a different amount of weight depending on our confidence in the data (except in Nigeria, where we assign 100% of the weight to our state-level estimates). The weight assigned to the national survey data varies from 50% (where we have reviewed data from a nationally representative survey) to 25% (where a survey exists but only at a subnational level) to 0% (where we have not found any recent survey data).166
- Finally, we divide our estimate of contemporary VAD rates in each location by overall prevalence in Imdad et al. 2017 to calculate our overall adjustment for falling VAD rates. This produces adjustments of -69% to -36%, varying by location.167
Changes in the causes of child mortality
The next component of our analysis accounts for changes in the share of child deaths attributable to diarrhea, measles, and other infectious diseases in locations where GiveWell funds VAS today compared to the Imdad et al. 2017 trials. We apply 80% weight to changes in diarrhea and measles mortality, and 20% weight to all other infectious diseases.168 This produces an additional adjustment of -56% to +24%, varying by location.169
In 2019, GiveWell conducted a literature review investigating the impact of VAS on cause-specific mortality in detail. We found:
- There is reasonably strong evidence that VAS reduces diarrhea and measles morbidity and mortality. This conclusion is based on the studies in Imdad et al. that investigated cause-specific morbidity and mortality (discussed above). For measles, this is also consistent with findings from another meta-analysis, Sudfeld et al. 2010, which investigated VAS as a treatment for children with measles.170
- The literature suggests that VAS probably doesn’t reduce mortality from malaria and lower respiratory tract infection, although the evidence for this conclusion was uncertain.171
- There was not enough evidence to evaluate whether VAS reduces mortality from whooping cough, tuberculosis or invasive non-typhoidal salmonella.172
Based on this review, we roughly estimate that 80% of the impact of VAS on all-cause mortality is expressed via reduced diarrhea and measles, and 20% is expressed through reductions in mortality from other infectious diseases.173 Although the literature review found weak or no evidence in favor of reductions in mortality from other infectious diseases, our reasoning is that there are many possible infectious causes of death that VAS could impact. It seems plausible that VAS has a small impact on multiple infections, even if that impact is difficult to pick up in published research.174To incorporate this into our analysis:
- We estimate the overall share of child deaths from measles, diarrhea and all infectious diseases in the contexts in which the Imdad et al. study takes place (14% measles, 20% diarrhea, 75% all infectious diseases).175 We use estimates from GBD 2019 for the countries and dates when the Imdad studies took place because of a lack of data from all the underlying studies, and so we see these estimates as very rough (discussion it footnote).176
- Next, we estimate (also using GBD 2019) the share of child deaths from measles, diarrhea and all infectious diseases today in locations where GiveWell supports VAS programs. We then calculate the contemporary share of deaths from these causes as a proportion of the share in Imdad et al. 2017. Generally, the share of deaths from measles and diarrhea is lower in contemporary contexts than in Imdad et al. 2017, and the share of deaths from other infectious diseases is roughly the same.177
- We then calculate a weighted average of changes in the share of child mortality attributable to these diseases in locations where VAS is delivered today, relative to Imdad et al. 2017. Changes in the share of measles and diarrhea mortality receive 80% of the weight, and changes in all infectious diseases receive 20%.178 This produces adjustments ranging from -56% to +24% in the countries with the largest GiveWell-supported programs.179
To produce our overall external validity adjustment, we multiply our adjustment for changes in vitamin A deficiency rates by our adjustment for changes in the causes of child mortality. This calculation includes an adjustment of 25% to account for non-independence. This is because we expect that these changes to be correlated to some extent and therefore we would risk "double penalizing" by simply multiplying each element together. We think of this adjustment as highly uncertain, because we’re not sure how correlated we should expect these changes to be (details in footnote).180
What factors explain variation in the effectiveness of VAS? Our external validity adjustment attempts to account for differences in context between the trials and the beneficiary setting that could influence the mortality impact of VAS. But we’re unsure whether our method is capturing all the relevant differences:- Since most of the trials we use to estimate the impact of VAS on under-5 mortality were conducted in the 1980s and 1990s, many potential determinants of VAS effectiveness (e.g., vaccination rates, diets, income) have or might have changed. We currently account for changes in vitamin A deficiency rates and diarrhea and measles mortality, which we think are likely to be important mediators. However, we could be missing other important factors, or not optimally modeling those we do account for.
- One factor that slightly increases our concern about this is that the two most recent trials in the Cochrane meta-analysis (DEVTA and Fisker et al. 2014) both find small and nonsignificant mortality impacts. We think it’s plausible that this is capturing a reduction in the impact of VAS because of factors not incorporated in our analysis. We do not put significant weight on this consideration because it’s only based on two trials, and there are factors reducing our confidence in both of them (details in footnote).181
- In 2023, we conducted an analysis to test the predictive power of our external validity adjustment. We estimated the mortality effect size we’d predict in 18 trials from the Cochrane meta-analysis based on our best guess about the level of deficiency, diarrhea/measles mortality, and mortality from all infectious diseases in that trial.182
We found no relationship between our predicted effect size and the main effect reported in each trial (see the graph below).183
Predicted vs. observed relative risk in Imdad et al. 2017 VAS trials 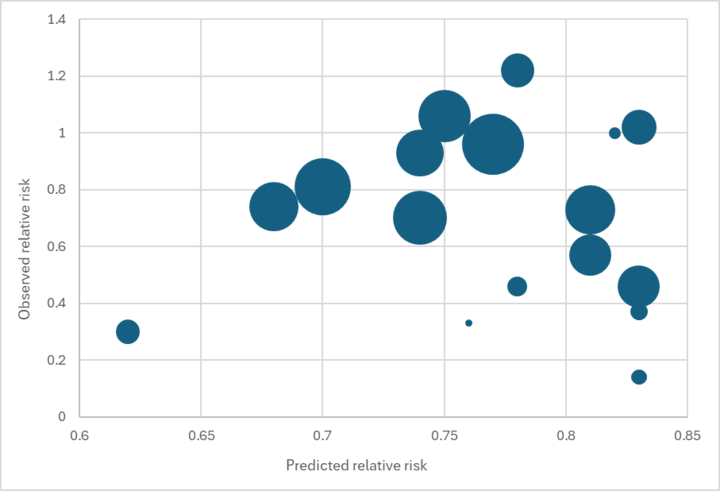
While we would not expect a perfect fit (e.g., because of other factors like VAS coverage affecting the reported effect size), we see this result as concerning. It reduces our confidence that our external validity adjustment is accurately capturing the true source of variation in results across contexts.
- Supplementation frequency may be a meaningful predictor of the impact of VAS on child mortality. VAS trials administered vitamin A to children at different frequencies ranging from weekly to every ten months.184 We have identified a possible relationship between supplementation frequency and VAS effectiveness, with more frequent supplementation yielding a larger reduction in child mortality. This relationship is not statistically significant in our initial analyses including the trials from the Imdad et al. 2022 meta-analysis (p = 0.17; R2 = 0.12),185 but we nevertheless believe it is probably true because it is supported by biological plausibility186 and two additional fortification and diet advice trials with large effect sizes not included in Imdad et al. 2022.187 The relationship suggests that vitamin A fortification is more than twice as effective as VAS every six months, per cumulative unit of vitamin A delivered. We are following up on this finding, and we plan to adjust our VAS CEA for it in the future. In contrast, in the same set of trials we did not identify a relationship between cumulative vitamin A dose and reduction in child mortality (p = 0.72; R2 = 0.0008).188
Uncertainties about methods for measuring VAD. The most common methods used to measure VAD are tests of concentrations of serum retinol or retinol-binding protein (RBP). Our understanding is that both of these methods have limitations. Specifically, both methods are responsive to inflammation (i.e., a low level could indicate VAD or inflammation, e.g. as a response to infection), and in the early stages of deficiency, levels of serum retinol and RBP may increase as the body attempts to "recycle" vitamin A. This could mean that VAD surveys which do not adjust for inflammation may overestimate the true prevalence of VAD.189We’ve received feedback from Dr. Sherry Tanumihardjo, an expert on vitamin A status assessment, that a more reliable method for assessing VAD status is the modified relative dose response (MRDR) test. Our understanding is that this test is not as sensitive to inflammation as other biomarkers.190
We’re unsure how this could affect our estimates. It’s possible that VAD as measured through MRDR would be substantially lower than our current estimates (based on GBD estimates and surveys of RBP or serum retinol). However:
- Our external validity adjustment estimates reductions in deficiency relative to the levels of deficiency in the underlying trials. Of the five trials where we have direct evidence on deficiency levels, our understanding is that all measured deficiency based on surveys of serum or plasma retinol.191 We would expect these results to be affected by the same concerns as our estimates of VAD today.
- Although we have heard from Dr. Sherry Tanumihardjo that MRDR is a stronger biomarker for assessing vitamin A status, we haven’t deeply investigated this and another expert we’ve spoken to (Keith West, Professor of Infant and Child Nutrition at Johns Hopkins University) told us that he believes both MRDR and serum retinol have advantages as biomarkers (details in footnote).192
We see uncertainty about how to interpret methods for measuring VAD as a weakness in our analysis and a priority for future research.
The reliability of VAD estimates. To estimate VAD rates we rely on a combination of the Global Burden of Disease (GBD) project estimates and national VAD surveys. We think that each of these sources is imperfect for different reasons (discussed below). As of February 2024, we are considering whether it would be valuable to fund new VAD surveys, but have not yet come to a decision on this.- GBD: GBD’s estimates of VAD prevalence rely on various modeling assumptions.193
We do not have a full understanding of these assumptions, and in the past we have noted that they can lead to surprising results that have led us to doubt their reliability:
- There was a significant shift in VAD rates in some locations between model releases for GBD 2017 and GBD 2019. We do not have a good understanding of why GBD’s modeling changes led to such substantial shifts in VAD estimates.194 Because of our uncertainty about the GBD 2019 estimates, we continue to use estimates from GBD 2017 in our analysis.
- GBD estimates do not take vitamin A food fortification into account. We are uncertain how much we should expect these programs to affect VAD prevalence (more below), but we think it is plausible that these programs could lead to meaningfully lower VAD estimates.195
- The GBD estimates take VAS coverage into account, so a country with high VAS coverage over time would be estimated to have lower vitamin A deficiency.196 To estimate the impact of VAS, we would ideally like to consider estimates of what VAD prevalence would be in the absence of VAS.197 We do not currently include an adjustment for this in our analysis, and we think it is plausible that an adjustment could lead us to increase our estimates of counterfactual VAD prevalence.198
-
National VAD surveys: We place some weight on national or subnational VAD surveys where they are available. But these surveys are not available for every country in our analysis and many are out of date (the most recent surveys in each country took place between 1997 in Mali to 2011 in Kenya).199 We adjust for possible changes to VAD rates over time in our analysis, but this adjustment is very uncertain.200
We have also seen a review paper, Stevens et al. 2015, which incorporates recent available VAD surveys and other relevant information (e.g., availability of animal-source foods) into a mathematical model to estimate rates of VAD as of 2013. It concludes that VAD rates among preschool age children fell from 39% to 29% overall in low- and middle-income countries between 1991 and 2013. Rates in sub-Saharan Africa (where GiveWell funds Helen Keller’s VAS program) were stable (45% in 1991, 49% in 2013).201 We haven’t deeply reviewed the paper’s methods, but we note:
- Its estimates are based on a trend from limited data after the year 2000 (12 surveys in sub-Saharan Africa between 2000 and 2013, and only 6 after 2001-2).202
- The confidence intervals for its sub-Saharan Africa estimate in 2013 are very wide, meaning that the estimates do not rule out large changes in VAD rates (49%, 95% CI 25% to 75%).
- Estimates from more recent surveys in Sierra Leone (2013), Malawi (2015-16), and Ghana (2017) not included in the study all fell below the study’s lower 95% confidence interval for sub-Saharan Africa.203
We’re therefore hesitant to incorporate the paper into our model and we think it’s unlikely that VAD rates have not fallen in sub-Saharan Africa since the early 1990s.
How much has fortification reduced rates of VAD? Many sub-Saharan African countries mandate fortification of staple foods with vitamin A. It’s possible that these programs have reduced VAD rates below the levels seen in earlier surveys, but we have seen very limited information on this to date. We investigated this question in 2018 and found:- Excluding the Democratic Republic of the Congo (DRC), all countries where Helen Keller (as of 2018) supported or planned to support VAS campaigns mandate that vegetable oil be fortified with vitamin A. A few others mandate or allow fortification of wheat flour or sugar with vitamin A as well. (Some countries also have programs encouraging the consumption of crops biofortified with vitamin A, but we have not investigated these programs in depth.)204 See this spreadsheet for a summary as of 2019.
- We found limited evidence on coverage of vitamin A fortified foods.
- In most countries in which Helen Keller has recently supported or plans to support VAS mass campaign programs, we have not seen any household- or market-level surveys testing whether food samples are adequately fortified.
- A market-level survey of vegetable oil in the city of Abidjan, Côte d'Ivoire, found that nearly all samples were adequately fortified, but other surveys we have seen found relatively low rates of adequately-fortified oil (44% in a study in Cameroon, 8% in a study in Nigeria).205
- Engle-Stone et al. 2017 found that rates of VAD among preschool-aged children in two cities in Cameroon did not significantly decline between 2009 and 2012, despite vitamin A fortification of vegetable oil becoming mandatory in 2011.206
- Helen Keller Intl told us in 2017 that it believes it would be very surprising if vitamin A deficiency were no longer a problem throughout sub-Saharan Africa, especially in countries with high child mortality and malnutrition rates.207 Dr. Sherry Tanumihardjo, an expert on vitamin A status assessment, told us in 2017 that since many vitamin A oil fortification programs in countries in sub-Saharan Africa are relatively new, it would not be surprising if many of the programs were not yet functioning well enough to have an impact on VAD rates among preschool-aged children.208
Based on this review, in 2018 we roughly estimated VAD rates of 20% in most countries with fortification programs where Helen Keller worked or planned to work.209 We subsequently updated these estimates upwards to incorporate estimates from the Global Burden of Disease Project (details in footnote).210 We haven’t revisited fortification in detail since 2019. Our impression is that evidence on the effectiveness of fortification is currently limited, and so we think it will be challenging to make progress on this question, but we may revisit this in the future.
Cross-country variation: Our external validity adjustment varies significantly across locations, and this is a significant factor in the cross-country variation in our cost-effectiveness estimates (discussion in footnote).211 While we’d expect some variation across countries, we’d expect these estimates to be noisy and it’s possible we’re exaggerating the true differences between locations.
What is the mortality rate among children targeted for VAS campaigns?
Summary
We estimate that there is a ~0.7% to ~1.8% risk that a child not receiving VAS will die from all causes per year in places where GiveWell supports campaigns, varying by location (1.28% in Guinea).212 A summary of our calculations for one country, Guinea, is below as an example:
What we are estimating Value Baseline annual child mortality, from GBD data (more) 1.24% Reduction in mortality among children receiving VAS (discussed above) 5.9% Baseline proportion of children receiving VAS (see here in our cost effectiveness analysis) 45% Total (Adjusted child mortality for children who would not receive VAS without GiveWell funding) 1.28% Baseline mortality
Our mortality estimates are drawn from the Institute of Health Metrics and Evaluation (IHME) Global Burden of Disease (GBD) project. We use the latest model available (from 2019). We use national-level estimates for annual all-cause mortality rates among 6-59 month olds (the target population for VAS) with the exception of Nigeria, Cameroon, and Madagascar, where we use state-level (or similar) estimates.213
The GBD estimates do not use 6-59 month olds as a grouping, and so we need to restructure the data to estimate mortality rates for this group. To do this, we use estimates from Demographic and Health Survey microdata from 18 surveys in sub-Saharan Africa and South Asia on the age profile of child mortality in the first year of life (discussion in footnote).214 This results in an estimate that 53% of all child deaths between 1 and 12 months occur in months 2 through 5.215 Overall, we estimate annual mortality for children 6-59 months ranging from ~0.62% (DRC) to ~1.66% (Niger) per year (1.24% in Guinea).216
Adjustment to account for existing VAS programs
The GBD mortality estimates that we use aim to capture the overall mortality risk in each location. Our best guess is that these estimates already incorporate the benefits of existing VAS delivery (taking into account that some people are already protected by VAS and therefore have lower morality). We have not explicitly confirmed this with the Institute for Health Metrics and Evaluation, as we have for the GBD estimates of malaria mortality (which we have heard from the Institute for Health Metrics and Evaluation do incorporate the impact of previous insecticide-treated net campaigns).217
By contrast, our analysis aims to estimate the impact of increasing access to VAS among children who would not otherwise receive it. We therefore need to estimate mortality among children who are not protected by VAS (and who we would expect to have higher mortality rates than average).
Our adjustment uses (i) estimates of the overall proportion of children who received VAS in the previous six months from recent Demographic and Health Surveys (details in footnote)218 and (ii) the estimated protective effect of receiving VAS in each country. This allows us to "reverse engineer" mortality among children who would not otherwise receive VAS.219
Overall, this adjustment slightly increases our mortality estimates in all locations, aligning with our expectation that mortality rates would be higher-than-average among children who wouldn’t receive VAS without GiveWell funding. We apply this adjustment to the GBD estimates to reach our final estimate of baseline annual all-cause mortality risk for children aged 6-59 months in the absence of VAS (varying from 0.65% to 1.76% per child).220
Shortcomings and uncertainties
- Uncertainty about GBD mortality estimates: Our understanding is that the GBD estimates rely on a number of modeling assumptions.221 We have not investigated all the modeling assumptions underlying these estimates in detail, and we have substantial uncertainty about them.
- Cross-country mortality variation: The GBD estimates we rely on indicate that mortality varies significantly across countries. We use these values without any adjustments on the assumption that they reflect real differences. However, we would expect these estimates to be somewhat noisy and it’s possible we’re exaggerating the true differences between locations (discussion in footnote).222
- Are we calculating higher deaths among children who don’t receive VAS correctly? Our adjustment to account for higher mortality among children who wouldn’t receive VAS without GiveWell funding involves modifying the GBD estimates to account for the impact of VAS on mortality. But we have not investigated how the GBD produces these estimates, and it’s possible we’re introducing errors through this procedure.
4.3 Long-term income increases
Summary
Our best guess is that VAS leads to small income/consumption increases in adulthood. We estimate that these income gains account for 20% of the modeled benefits of VAS in all locations in our analysis.223
We include these benefits because studies of other child health programs we have investigated (malaria and deworming) have found evidence that averted illness in childhood leads to increased income and consumption in later life.224 We think that VAS probably leads to similar benefits, but have not been able to find any direct evidence investigating this question. For simplicity, we benchmark our calculations to our analysis of the income gains from seasonal malaria chemoprevention (SMC), another child health program where we’ve reviewed the evidence in more detail.
A summary of our calculations is below using one country, Guinea, as an example (full calculations in this section of our analysis).
What we are estimating Value Ratio of benefits from income effects to benefits from deaths averted in GiveWell’s analysis of SMC (more) 0.31 Subjective adjustment for VAS leading to lower proportional income increases than SMC (more) -20% Adjusted ratio of benefits from income effects to benefits from deaths averted for VAS 0.25 Units of value generated from deaths averted among people under age 15 in Guinea (see here) 37,219 Units of value generated from long-term income increases (see here) 9,125 Total units of value generated by VAS in Guinea per $1m spent (see here) 46,344 Total (% of total cost-effectiveness from long-term income increases) 20% Our approach
VAS and long-term income increases
We think it’s possible that VAS leads to income effects in adulthood, via improving health and averting disease in a sensitive developmental window of childhood. However, we haven’t been able to find direct evidence of this. In 2019 we conducted a literature review on this question and did not identify any studies looking at the impact of VAS on income or consumption in adulthood.
Benchmarking to SMC
Instead, we benchmark our income effects estimates for VAS to our analysis of income effects from seasonal malaria chemoprevention (SMC), another program targeting children under 5. Our analysis of the income benefits of SMC (and other malaria programs) is based on an in-depth review of two natural experiments (Bleakley 2010 and Cutler 2010) that found malaria elimination programs were associated with income gains in malarious regions in India and Colombia, Mexico, Brazil, and the US.225
- We use a combined estimate from these studies and adjust it downwards by -70% to reflect our doubts about the quality of the evidence (among other adjustments).
- Overall, we estimate that each malaria case averted in childhood increases later-life income by 0.6% per year.226
We benchmark the income benefits for VAS to SMC using the following method:
- Averaging across locations, we estimate that the value of income benefits from SMC are equivalent to 31% of the value from deaths averted (as measured in GiveWell units of value, an arbitrary unit we use to compare the moral value of different kinds of outcomes).227 We use the same 31% estimate as a starting point for our estimate of the income benefits of VAS programs.
- This assumption means the income benefits we estimate in location vary in direct proportion to mortality averted in that location.
Subjective adjustment for mechanisms
We assume that the income benefits of VAS are 20% lower than those for SMC (relative to the level of mortality averted by each program).228 This is a rough and subjective adjustment, based on a comparison between VAS and anti-malaria programs on three outcomes that we’d expect to be among the most likely mechanisms for income effects (growth, cognition, and disability).
Overall, we think the available literature provides somewhat stronger evidence that anti-malaria programs have an impact on outcomes that we think are plausible candidates for income effects mechanisms than VAS. This comparison is uncertain because we’re unsure about the mechanism through which child health programs lead to income effects, we haven’t considered the evidence on long-term disability in detail, and there might be factors we haven’t considered.
- Growth: Our best guess is that VAS has a smaller effect on growth, compared to SMC. In our 2019 literature review, we analyzed five RCTs and estimated that SMC results in a small but statistically significant gain in weight but has no impact on height (details in footnote).229 Evidence from four RCTs suggested that VAS has no impact on either weight or height.230
- Cognition: Our best guess is that SMC is slightly more likely to lead to cognitive benefits than VAS, largely because of a more plausible mechanism. However, the evidence of an impact for both interventions is limited.
- We assessed evidence for VAS and anti-malaria programs on measures of cognitive function. Based on four RCTs of postnatal VAS, we found that VAS did not improve cognitive function at statistically significant levels (although the confidence interval encompassed possible small increases of up to 2.25 IQ points).231
- For SMC, the evidence was mixed, with some trials finding increases in cognitive ability and others finding no impact (an overall meta-analysis of the three most relevant trials found no impact).232 A small proportion of malaria cases (we estimate ~2%) result in serious neurological symptoms, and so we concluded (with low confidence) that SMC probably improves cognitive outcomes overall, and this effect may be concentrated in a small proportion of children (and is therefore difficult to detect in studies).233
- Disability: We didn’t include evidence on disability in our 2019 review. Our best guess is that VAS is more likely to avert long-term disability than malaria, since vitamin A deficiency can cause blindness.234 However, we haven’t done a careful side-by-side comparison of the prevalence of disability caused by malaria vs vitamin A deficiency, so we put little weight on this.
Shortcomings and uncertainties
Overall, we see this method as a pragmatic way to estimate income effects where we do not have direct evidence. But we see it as highly uncertain. Key open questions:
- What should our prior about income effects be? Our approach assumes that VAS leads to later life income increases, even though we’ve not identified any direct evidence of this. This is because we have reviewed direct evidence of income benefits from other programs that improve health in childhood (averting malaria and deworming), and we think there’s a plausible link from improved health in childhood to increased adult income. However, this is a speculative assumption.
- Should we benchmark only to mortality? Our method benchmarks only to the mortality averted by each program, not the morbidity averted. We think this is a reasonable assumption because we’d expect the level of severe disease to be highly correlated with both income benefits and mortality. But it could be wrong, for example, if the true mechanism for income effects was via averting a large number of mild cases of a disease, each of which contributed a small amount to long-term income (rather than a smaller number of serious cases).
4.4 Additional benefits
Summary
Our cost-effectiveness analysis includes a number of additional benefits which we have opted not to explicitly model.235 Instead, we incorporate them as rough percentage best guesses. These adjustments increase our estimate of the impact of VAS by 67%.236 See the table below for a summary.
What we are estimating Value Short-term consequences of reduced infectious disease morbidity 6% Short-term anemia effects 9% Investment of income increases 3% Vision benefits 9% Benefits from other programs supported by VAS campaigns (e.g., deworming, immunizations) 18% Treatment costs averted from prevention 20% Interaction between VAS and vaccines 2% Total (adjustment for supplemental benefits) 67% We are particularly uncertain about these adjustments (details on our method in footnote)237 and they should be thought of as rough best guesses. See this spreadsheet for our full calculations.
Unlike for GiveWell’s other top charities, we do not (as of February 2024) include any negative adjustments to account for possible harms or offsetting impacts for VAS. It’s possible this suggests that we’re underestimating negative impacts and we recently received some expert feedback that VAS could lead to potential harms we’re not currently including in our analysis. We discuss these below.
As of February 2024, we include the following additional benefits in our analysis:
- Short-term consequences of reduced infectious disease morbidity (+6%). Imdad et al. 2017 finds that VAS reduces morbidity (illness) from measles and diarrhea.238 We also think (although there is less reliable evidence for this) that VAS may reduce morbidity from other infectious diseases.239
- Short-term anemia effects (+9%). de Sá Barreto da Cunha et al. 2019 is a meta-analysis of 23 studies which finds that VAS reduces anemia by around a quarter (26%).240 We interpret this analysis as moderate evidence of VAS on anemia, because although the effect size is large, some aspects of the inclusion criteria reduce our confidence in the findings.241 We incorporate this benefit in our analysis with an upwards adjustment of 9%.242 Note that this adjustment is intended to capture short-term benefits for anemia only, as we believe that anemia may be a mechanism for VAS’s (possible) benefits on long-run income.243
- Investment of income increases (+3%). We think that VAS might increase people’s incomes in later life (see above). If this is correct, some recipients might invest a portion of their increased income. We include a 3% adjustment to account for this.244 This is in the same range as our cost-effectiveness analyses which include development benefits.245
- Vision benefits (+9%). Vitamin A deficiency can cause dry eyes (the leading cause of preventable childhood blindness),246 and there is evidence that VAS averts night blindness and its precursors.247 Our 9% upward adjustment is a rough estimate, based on a GiveWell analysis which estimates that the total benefits of VAS on blindness equate to around 0.7x248 the value of spending on unconditional cash transfers (GiveWell’s benchmark for comparing different programs).249
- Benefits from other programs supported by VAS campaigns (+18%). VAS campaigns often deliver additional interventions alongside VAS, including deworming, "mop-up" immunizations (for children who have missed scheduled immunizations), and screening for severe acute malnutrition and moderate acute malnutrition and referring for care.250 VAS programs may incur additional costs to deliver these interventions that we include in our cost per supplement analysis, but we do not include the benefits of these interventions except in this supplemental adjustment. We think of our +18% adjustment as a very rough best guess and a way we may be underestimating the cost-effectiveness of supporting VAS campaigns. Which interventions have been delivered with VAS have varied by location and over time.251
-
Interaction between VAS and vaccines (+1.5%). In 2018, we conducted a literature review to investigate the hypothesis that VAS might interact with vaccination to influence mortality risk. Our review found that the evidence on this question was highly uncertain, but that it was plausible that VAS enhanced the "nonspecific" effects of vaccines (the effects of a vaccine that are not due to its impact on the targeted disease).252 We account for this possibility with an upwards 1.5% adjustment. Below, we discuss the evidence for the hypothesis that these interactions could lead to negative effects on mortality for some groups.
- Treatment costs averted from prevention (+20%). By reducing childhood mortality and morbidity, VAS may also avert costs that would have been incurred to seek and receive treatment for disease. These savings include the direct costs of treating associated diseases (incurred by households or the medical system) as well as indirect costs (e.g., caregivers taking time off work to care for sick children). We account for these savings with a 20% upward adjustment.253 This adjustment is consistent across all of GiveWell’s top charities focused on improving child health.254 We chose to use a consistent figure because our model for estimating the value of costs of illness averted was very similar across these interventions (all around 20%)255 , and we thought that explicitly modeling this benefit stream across countries would not be worth the added complexity. For more detail on our reasoning, see our write-up on the cost of illness averted.
Factors we have excluded
- Potential negative interactions between VAS and vaccines. We discuss above the evidence that VAS could lead to beneficial interactions with vaccines. Another version of this hypothesis suggests that VAS and vaccination could interact with harmful impacts on mortality for some groups. Benn et al. 2009 reanalyzed data from an earlier VAS trial in Ghana to test the hypothesis that VAS reduced mortality in children whose most recent vaccine was a live vaccine (e.g., measles), but could lead to increased mortality in children (particularly girls) whose most recent vaccine was an inactivated vaccine (e.g., DTP).256 The data re-analysis found that VAS was associated with nonsignificant increases in mortality among girls who had received vaccinations.257 The authors of Fisker et al. 2014, a 2007-2010 trial in Guinea-Bissau of VAS, intended for the trial to test for interactions between VAS, live or inactivated vaccines, and gender.258 The trial found no significant effect on mortality overall, a nonsignificant increase in mortality for boys, and no evidence of a differential effect based on receiving live or inactivated vaccines.259
Because the trend towards higher mortality for boys is in the opposite direction to the effect theorized and non-significant, we do not interpret these results as strong evidence of harmful vaccine interactions. We have also completed a literature review on the biological plausibility of interactions between VAS, vaccines, and sex, and did not find reasons to believe that harmful impacts are highly plausible.260 In 2023, we sought feedback on our work from one of the authors of Benn et al. 2009 and Fisker et al. 2014, Dr. Christine Benn, who shared additional evidence on this question (discussed below).
- Adverse side effects. Some children experience side effects after taking vitamin A supplements, including diarrhea, headache, nausea, and vomiting.261 WHO VAS guidance cites an estimate that the prevalence of these side effects is 3% to 7% (we have not separately vetted this estimate).262 We do not include these effects in our analysis because we expect that the total negative impact is very small compared to the overall benefits of VAS.
-
Potential vitamin A overdose. Excessive vitamin A intake can cause a serious condition called vitamin A toxicity.263 When we most recently investigated this question, our understanding was that cases of vitamin A toxicity were very rare globally, and that VAS programs were not thought to be a cause of cases of vitamin A toxicity (details in footnote).264 We have since received some feedback that we could be underestimating these risks, but have not yet deeply investigated the evidence underlying this (more below).
- Diverting skilled labor from other activities. VAS mass campaigns involve Ministry of Health staff, nurses, and other health workers. We are uncertain of the degree to which participating in VAS programs reduces their ability to complete other duties, but we note that our understanding is that VAS campaigns usually take between a few days and a few weeks to complete. We do not include this drawback in our analysis here because we attempt to account for the monetary cost of government officials’ time in our cost per supplement calculations, but this is an extrapolation from very little data (from one costing study of a mass deworming campaign in Niger).265
- Offsetting births. Life-saving interventions like VAS campaigns might not increase the number of children alive if parents respond to lower mortality by having fewer children. We explain this issue in more detail in this 2016 blog post. This is not merely an empirical question, but also an ethical one—whether or not you view the program as less valuable if there are offsetting births or not depends on your ethical framework. Empirically, our reading of the evidence is that child deaths in places where GiveWell funds VAS campaigns are likely to be only partially offset by additional births. In 2014, GiveWell Senior Advisor David Roodman published a detailed study exploring the evidence linking life-saving interventions and fertility and concluded that in places with high fertility rates (as is currently the case in much of sub-Saharan Africa266 ), there is likely less than 0.5 offsetting births per child death.267 Given the ethical uncertainty in how to account for this effect, we do not account for it in our cost per life saved calculations. Stakeholders who have contributed to the moral weights that we use to compare life-saving to income-increasing programs may have taken it into account.
- VAS capsule degradation. We have received feedback that capsule degradation (levels of Vitamin A in capsules being lower than intended) is a risk that GiveWell does not fully account for in our cost-effectiveness analysis.268 This is supported by one study we have reviewed, which tested maternal and infant VAS in Tanzania and found high levels of degradation in one of the four types of capsule used (just 32% of the expected level of vitamin A at the end of the study).269 The other three types of capsule retained good levels of vitamin A.270 We have not yet added an adjustment for this risk in our cost-effectiveness model, but may do so in the future.271
- Marginal funding goes to lower priority areas. The data we use to estimate the impact of VAS is national-level (with the exception of Nigeria, Cameroon, and Madagascar, where we use region- or state-level estimates). We would normally expect that, if there are funding constraints, some countries will make prioritization decisions to exclude lower burden areas from VAS campaigns. In effect, providing additional funding for VAS campaigns may allow these lower burden areas to be covered. This would imply we could be overestimating cost-effectiveness by using data at the national level.
We do not currently apply an adjustment for most countries in our cost-effectiveness analysis for VAS. This is because we think the impact of additional funding to VAS implementers is sometimes to allow additional campaign rounds to be conducted across the whole country, and sometimes to enable additional regions to be included in a campaign, but with no clear pattern (details in footnote).272
We have not investigated this question recently or in detail, and it’s possible that not including an adjustment here means that we’re overestimating the impact of our VAS funding.
4.5 Grantee-level adjustments
Summary
Our cost-effectiveness analyses also include adjustments relating to the specific organizations we recommend rather than the intervention itself. These reflect aspects of the organization’s delivery of a program that might have an impact on cost-effectiveness. Rather than explicitly model these, we apply them as rough percentage best guesses.
As of February 2024, our estimate is that these factors reduce the cost-effectiveness of Helen Keller’s VAS program by 22%. A summary of our calculations is below:
What we are estimating Value Quality of monitoring and evaluation (see here) -17% Within-organization fungibility (see here) -5% Total (adjustment for grantee-level factors) -22% At the time of writing, we use a total grantee-level adjustment of -24% for Nutrition International’s VAS program. Our reasoning is fairly similar to Helen Keller’s program (differences discussed in footnote).273 The summary below focuses on our reasoning for Helen Keller, which receives most GiveWell VAS funding.
As of February 2024, these adjustments are the largest we apply to any GiveWell top charity.274 The biggest driver of this is our adjustment for Helen Keller’s monitoring and evaluation, which we discuss in detail on our separate page on Helen Keller’s VAS program.
Adjustments in detail
Quality of monitoring and evaluation
We use a downward adjustment of 17% for the quality of Helen Keller’s monitoring and evaluation.275 This adjustment reflects our best estimate at the extent to which methodological aspects of Helen Keller’s monitoring could inflate its estimates of the number of children reached with VAS. These estimates feed into our cost-effectiveness analysis as part of our estimates of cost per supplement delivered (see above).
Helen Keller conducts monitoring surveys after the VAS campaigns it supports to estimate the proportion of children reached. While we believe these surveys are valuable overall, they are less comprehensive than some other organizations we have funded and may not be representative of all the areas that Helen Keller supports, meaning that the reported coverage estimates might inflate estimates of the number of children reached (details in footnote).276 We therefore use a higher figure for this adjustment than for some of our other grantees. See our separate report on Helen Keller’s program for more details.
Within-organization fungibility
We use a downward adjustment of 5% for within-organization fungibility.277 This reflects our understanding that the impact of our funding for Helen Keller’s VAS program may be to free up some Helen Keller funding and fundraising efforts that would have gone to VAS for other uses. Our best guess is that these other uses will be less cost-effective overall than VAS.
This adjustment is relatively small because we think Helen Keller has limited unrestricted funding relative to the size of its VAS program.278
5. How does the program affect other actors’ spending?
5.1 Summary
Part of our cost-effectiveness analysis involves asking what impact funding a program has on other actors’ spending. Additional funding for VAS campaigns may lead other organizations or governments to spend more (we refer to this as "leveraging" funding, or "crowding in") or less (we refer to this as "funging," from "fungibility," or "crowding out") on VAS than they otherwise would.
We include a "leverage and funging" adjustment in our cost-effectiveness analysis to account for this. As of February 2024, our leverage and funging adjustment is -21% to -47%, varying by location (-40% in Guinea). A summary of calculations is below, using Guinea as an example:
What we are estimating Value Grant size (arbitrary value) $1,000,000 Value of Helen Keller’s spending on VAS in Guinea (more) 0.060 Total units of value generated by Helen Keller spending 60,187 Costs covered by other actors per $1m spent by Helen Keller (more) Guinea government ~$460,000 Nutrition International (vitamin A capsules) ~$75,000 What would happen if we did not fund the program (more) The Guinea government would replace Helen Keller’s costs 10% probability Other philanthropic actors would replace Helen Keller’s costs 35% probability Nobody would replace Helen Keller’s costs 55% probability Estimated value of activities that would be funded by other actors instead of VAS Activities funded by the Guinea government (more) 0.005 Activities funded by Nutrition International (more) 0.006 Activities funded by other philanthropic actors (more) 0.012 Change in value under different scenarios Nobody would replace Helen Keller’s costs (leverage) -1,513 The Guinea government would replace Helen Keller’s costs (funging) -5,513 Other philanthropic actors would replace Helen Keller’s costs (funging) -16,757 Final adjustments Adjustment for leverage (more) -3% Adjustment for funging (more) -37% Total: Adjustment for leverage and funging -40% We think of these adjustments as particularly uncertain inputs in our analysis. Our biggest areas of uncertainty are:
- Our analysis of how other actors will behave if we did not make a grant are necessarily subjective guesses, as we can only speculate about their future priorities and decisions.
- Our adjustments rely on estimates of the value of other programs that other actors might fund instead of VAS. We outline the estimates and our reasoning for them below, but these are rough estimates based on limited information. We have also invested considerably less time into producing these estimates than we have in our main cost-effectiveness analyses, and they should be thought of as rougher guesses.
5.2 Leverage
Leverage refers to extra funding for VAS campaigns causing other actors to spend more on VAS than they otherwise would. We already account for the main part of this effect in our cost per child reached calculations (where we exclude in-kind government resources and donated VAS capsules that we think our funding leverages). This means the benefit of these resources is already baked into our main calculations. To account for these resources on the benefit side, we make a small negative adjustment here reflecting that they will not be used for other programs. We estimate that this effect reduces our initial cost-effectiveness estimate by 3% in Guinea.279
We use the following reasoning:
- We think that each $1m spent by Helen Keller causes the Guinea government to incur ~$460,000 of in-kind costs (e.g., staff time), and Nutrition International to incur ~$75,000 in additional costs (from donated VAS capsules).280
- We exclude these costs from the cost side of the cost-effectiveness equation when we estimate the number of children reached by VAS and deaths averted in the main part of our cost-effectiveness analysis (more above). This means that the benefit of these resources is already incorporated in our initial impact calculations. We account for these resources on the benefit side by deducting the value of the programs we think they would have been would have been spent on otherwise (see this blog post for more on why we use this approach).
- Our best guess is that if these resources were not used for VAS, both the Guinea government and Nutrition International would have used them for something ~10% as cost-effective as VAS campaigns in Guinea.281 In total, diverting these funds away from other programs "costs" 2,751 units of value (calculation in footnote, more on units of value here).282
- We think there’s approximately a 55% chance that nobody would replace GiveWell’s VAS funding in Guinea in GiveWell’s absence. This implies that the funding causes the government and Nutrition International to divert their resources away from other programs into VAS campaigns. For more on the reasoning behind the 55% estimate, see below.
- Our final leverage adjustment involves multiplying 2,751 units of value by 55%, and deducting the total (1,513) from our estimate of the total value generated by Helen Keller’s spending (60,187 units of value).283 This equates to a -3% adjustment.284
- Intuitively, the reason this adjustment is small is that we think the other activities the Guinea government and Nutrition International might use their resources on are considerably less cost-effective than VAS campaigns in Guinea. This means the value lost from diverting these funds away from other activities is relatively small.
5.3 Funging
Funging refers to extra funding for VAS campaigns causing other actors to spend less on VAS than they otherwise would. We estimate that this effect reduces cost-effectiveness by ~37% in Guinea.285
Our reasoning is:
- At the time we made our most recent grant, we thought there was a 10% chance that the Guinea government would replace GiveWell’s spending on VAS campaigns in GiveWell’s absence, and a 35% chance that other philanthropic actors (UNICEF or Nutrition International) would do so.286 This was a rough estimate, based on our understanding of the VAS funding landscape in Guinea. See below for more details on our reasoning.
- If other actors were to replace GiveWell’s funding, this implies that the true impact of the spending is to free up their resources for other activities.287 Our best guess is that the activities other funders might fund instead are ~8% (for the Guinea Government) to 20% (for other philanthropic actors) as cost-effective as VAS campaigns in Guinea,288 and therefore we would lose 47,877 (if other philanthropic actors replaced GiveWell’s spending) to 55,130 (if the domestic government replaced GiveWell’s spending) units of value, relative to our initial estimate of the total value generated by Helen Keller’s spending (60,187 units of value) (calculation in footnote).289
- We think that in Guinea there’s a 10% chance that the domestic government would replace GiveWell’s funding in GiveWell’s absence, and a 35% chance that other actors would.290 For our final funging adjustment, we therefore multiply the value that would be lost in each of those scenarios by the likelihood of each scenario occurring (10% and 35%) and deduct the total (22,270 units of value) from our estimate of the total value generated by Helen Keller’s spending (60,187 units of value).291 This equates to a -37% adjustment.292
- Intuitively, the reason this adjustment is relatively large is that we think there’s a substantial (45%)293 chance that the real impact of GiveWell’s funding for VAS in Guinea is simply to free up other actors’ funding for other activities that we think are probably less cost-effective.
5.4 Key parameters
Percentage of costs paid by different actors
We estimate the proportion of program costs paid for by different actors. These estimates are based on our cost analysis (discussed above). Overall, we think that each $1m spent by Helen Keller on VAS causes:294
- The Guinea government to incur ~$460,000 in in-kind costs (e.g., staff time).
- Nutrition International to incur ~$75,000 in costs for donated capsules.
We also think that WHO has contributed some funding to Helen Keller-supported campaigns in Guinea, but we exclude those costs from this analysis (discussion in footnote).295
What would happen if Helen Keller did not fund VAS?
We make guesses about what would happen to other actors’ spending on VAS if GiveWell did not fund the campaign. For Guinea, we most recently estimated these probabilities as part of a 2023 grant. We guessed that if GiveWell had not provided Helen Keller funding for the campaign:296
- There was a 10% chance that the Guinea government would replace GiveWell’s funding (Scenario 1).
- There was a 35% chance that other philanthropic actors (UNICEF or Nutrition International) would replace GiveWell’s funding (Scenario 2).
- There was a 55% chance that nobody would have replaced GiveWell’s funding (Scenario 3).
These guesses were based on our analysis of the VAS funding landscape. Some of the points we considered were:
- Our understanding is that the global funding landscape for VAS is not very crowded, relative to some other programs that GiveWell funds.297 We think that the main funders of VAS campaigns globally are national governments (through in-kind contributions like staff time, and sometimes through financial support), Global Affairs Canada (GAC) (through grants to Nutrition International and UNICEF), UNICEF's flexible funding, and GiveWell-directed donations.298 All else equal, we think this reduces the probability that other actors would replace this funding in Helen Keller’s absence.
- In Guinea, our understanding is that there have not been funding gaps for VAS campaigns since 2018.299 Since that time, Helen Keller, Nutrition International and UNICEF have supported campaigns in individual regions, although Helen Keller told us in 2022 that Nutrition International had no remaining funding for VAS in Guinea.300 All else equal, we expect that this increases the probability that other actors (most likely UNICEF) would replace Helen Keller’s funding in Helen Keller’s absence.
How valuable is VAS, compared to the activities that other actors might fund instead?
Our leverage and funging adjustments estimate the impact of shifting funding to or from VAS campaigns in Guinea, relative to other activities that governments and other funders might fund instead. This means that we need to estimate the value of these other activities.
To do this, we compare activities in terms of "units of value," an arbitrary unit GiveWell uses to compare the moral value of different types of outcomes (e.g., increased income vs reduced deaths). We benchmark the value of each benefit to a value of 1, which we define as the value of doubling someone’s consumption for one year. See our 2020 update on moral weights for more details on how we think about comparing value across different interventions.
Our analysis of leverage and funging for VAS in Guinea involves four specific estimates:
- Helen Keller spending on VAS in Guinea (before leverage and funging): 0.060 units of value per dollar (more)
- Activities that domestic governments might fund instead of VAS: 0.005 units of value per dollar (more)
- Activities that Nutrition International might support instead of donated VAS capsules: 0.006 units of value per dollar (more)
- Activities that other philanthropic actors might fund instead of VAS in Guinea: 0.012 units of value per dollar (more)
Our estimates of the other activities that might be funded instead of VAS are based on considerably less work than our main cost-effectiveness analysis, and so we think of them as rougher guesses.
Helen Keller spending on VAS in Guinea
We estimate that each dollar spent by Helen Keller on VAS campaigns in Guinea generates 0.060 units of value.301 This figure is the final output generated by our cost-effectiveness analysis, after factoring in all adjustments except leverage and funging.
Activities that domestic governments might fund instead of VAS
We estimate that each dollar of in-kind resources that the Guinea Government contributes to VAS campaigns would generate 0.005 units of value if used for other activities.302 This is around 1/12 as valuable as spending on VAS campaigns.303
In summary, our approach is:
- We estimate that 80% of these resources would be used on health programs, 10% would be used for education programs and 10% would be used on social security programs.304 This is a very rough best guess, for which we have not done any in-depth research.
- Next, we estimate the value of spending in each category (details on our approach in footnote).305
This results in the following estimates:
- Health: 0.0056 units of value per $ spent
- Education: 0.0028 units of value per $ spent
- Social security: 0.0026 units of value per $ spent
- Finally, we take a weighted average of the value of each type of spending, with our estimates of how the spending would be allocated (80% health / 10% education / 10% social security) as the weights. This results in an overall estimate of 0.005 units of value per dollar spent.306
Activities that Nutrition International might support instead of donated VAS capsules
We estimate that each dollar that Nutrition International contributes to VAS campaigns in Guinea via donated capsules would generate 0.006 units of value if used for other activities.307 This estimate is based on assuming that Nutrition International’s spending on other activities is equal to 100% of the value of domestic government spending on health (discussed above). This is a very rough guess.
Activities that other philanthropic actors might fund instead of VAS in Guinea
We estimate that each dollar that other philanthropic actors (in this case, UNICEF) would contribute to VAS in Guinea in Helen Keller’s absence would generate 0.012 if used for other activities.308 This value is an average of (i) our estimate of the value of Helen Keller’s spending on VAS in Kenya and (ii) our estimate of the value of domestic government health spending.309 This is because:
- The main organization we think Helen Keller might be crowding out in Guinea is UNICEF.
- In Guinea (and a number of other countries in our analysis),310 our understanding is that much of UNICEF’s VAS funding comes from a grant from Global Affairs Canada. Our understanding is that some of this grant is earmarked for VAS, but not all of it.311 We would guess that funds crowded out by Helen Keller Intl's VAS might plausibly be redirected towards either (a) VAS in other countries or (b) other health interventions covered by the grant. We use Helen Keller’s spending on VAS in Kenya as a proxy for (a) and domestic government health spending as a proxy for (b).
- We use a lower figure for this parameter (0.006) in countries where we think that UNICEF does not receive Global Affairs Canada funding for VAS.312
6. Additional perspectives beyond our cost-effectiveness model
6.1 Summary
In theory, our cost-effectiveness analysis intends to capture the total impact of a program per dollar spent. But we recognize that our cost-effectiveness calculations are not able to capture every factor that could make a program more or less impactful. Focusing only on our cost-effectiveness model may mean we’re missing things that are difficult to quantify.
As a result, we think it’s helpful to look at other perspectives and types of evidence that may not be captured in our bottom line cost-effectiveness number. Some additional questions we have considered are:
- Does VAS have unintended negative consequences?
- Do experts and practitioners see VAS as a good program?
- Is there evidence that large-scale VAS campaigns lead to reductions in mortality?
- Should GiveWell fund other ways of reducing vitamin A deficiency?
- Is GiveWell’s funding of VAS crowding out other funders over the long term?
- Is it intuitively plausible that VAS is cost-effective?
- How does our cost-effectiveness model compare to others?
- How accurate was our analysis of VAS in hindsight?
- Will VAS remain impactful in the future?
We see asking these questions as a type of "cluster thinking," or considering a program from multiple perspectives. The more additional perspectives we’ve considered, in general the more confident we are in our funding recommendations.
Overall, the additional perspectives we’ve considered reduce our confidence in VAS. While we still think VAS is probably an excellent investment overall, we are somewhat less confident in VAS than our (very high) headline cost-effectiveness estimates would suggest. Our biggest open questions and reservations are:
- There is more controversy about VAS in the scientific literature than GiveWell’s other top recommended programs. In general, we tend to have more confidence in programs that command widespread support from the scientific community. (More)
- Some critics have claimed that VAS could cause harm in some circumstances, especially among non-deficient children. While we have engaged with some of these claims in detail, we have only recently heard about some of them and haven’t yet fully investigated how well-supported they are. (More)
- We have not seen evidence that large-scale VAS programs (as opposed to studies of VAS under experimental conditions) lead to reductions in mortality. (More)
- We expect that another program to avert child mortality, mass distribution of azithromycin, will scale up significantly in areas where we fund VAS campaigns in the future. This could either lower our cost-effectiveness estimate for VAS (since VAS might have less additional benefit) or increase it (if there were opportunities to deliver both interventions together, saving costs). (More)
6.2 Does VAS have unintended negative consequences?
Why is this important? When trying to estimate the total impact of VAS, we need to offset the benefits with any negative impacts.
How we’ve accounted for this
Our bottom line: We don’t currently account for any negative health impacts from VAS campaigns. Before 2023, we assessed the risk as low, although we have recently received expert feedback that we could be underestimating the potential harms. Our level of concern on this question remains fairly low, but we may do more work to investigate this in the future.
In more detail:
- We discuss the risk of adverse events from VAS and toxicity via vitamin A overdose above. Our most recent assessment was that these risks are small, relative to the benefits of VAS, although we have not recently investigated either question.
- In 2018, we also reviewed evidence for claims by Dr. Christine Benn, Professor in Global Health at the University of Southern Denmark, that the mortality impact of VAS was modified by vaccination status and sex. Dr. Benn argued that VAS might increase mortality among some subgroups (e.g., girls whose most recent vaccine was an inactivated vaccine, like DTP). We discuss our assessment of the evidence above. At the time, we concluded that the biological plausibility of these claims was low (but not negligible) and that the available literature did not provide persuasive evidence of an increased mortality risk. We decided not to make any updates to our cost-effectiveness analysis.
- In 2023, we asked three experts to review our analysis of VAS and heard additional information about possible health risks:
- Dr. Benn reiterated her concerns about VAS-vaccine interactions and highlighted new evidence (discussed below) on this question from large-scale observational studies.313
- We received feedback from Dr. Sherry Tanumihardjo, Professor of Nutritional Sciences at the University of Wisconsin-Madison, that excessive vitamin A intake can lead to harmful effects on the liver and abnormal bone development.314 Dr. Tanumihardjo reports that there is some evidence from studies in Malawi and South Africa that children receiving vitamin A from multiple sources including VAS and vitamin A fortification are at risk of harmful levels of vitamin A consumption.315 We haven’t yet fully reviewed this evidence. We’re unsure about the magnitude of these harms, at what level of vitamin A status they are likely to appear, and whether they pose a risk in countries where GiveWell funds VAS programs. (GiveWell does not fund VAS in either Malawi or South Africa).
- Dr. Kenneth Brown, Distinguished Professor Emeritus at UC Davis, also highlighted uncertainty about the possibility of excessive vitamin A intake in locations where multiple vitamin A interventions overlap, although he commented that this was unlikely to be "an important issue for public health in most of sub-Saharan Africa."316
- In 2023, we also reviewed additional scientific literature critical of VAS. A 2010 commentary by Michael Latham argues that VAS may increase the risk of respiratory infection among children with adequate vitamin A status.317 This is potentially concerning, since respiratory infections are a leading cause of under-5 mortality in low-income settings. The Cochrane meta-analysis of VAS trials does not report a significant overall impact of VAS on respiratory infection incidence or mortality risk in children under 5.318 However, we have not yet investigated whether the response may be different among the subset of children who do not have vitamin A deficiency.319
- Overall, our level of concern about major adverse health outcomes that could substantially counteract the benefits of VAS remains low, but we are receptive to additional evidence on this question and may do more work to investigate this in the future.
6.3 Do experts and practitioners see VAS as a good program?
Why is this important? We’re more confident in programs that have wide support from experts in countries where VAS campaigns take place, and the global health community more widely.
How we’ve accounted for this
Our bottom line: There is more controversy about the evidence for VAS than GiveWell’s other top recommended programs. While we’ve attempted to account for some of the criticisms in our analysis, this controversy decreases our confidence in VAS because we may have got some judgment calls wrong, and we have not systematically tried to engage with VAS critics.
In more detail:
- Our impression is that the scientific debate around VAS is more contentious and polarized than GiveWell’s other top recommended programs.
- While there is significant support in the global health community for VAS (e.g., WHO strongly recommends VAS in areas of high deficiency320
and the authors of the VAS Cochrane meta-analysis concluded that the evidence for VAS reducing morbidity and mortality was strong enough that additional placebo-controlled trials would be unethical),321
we have also seen a number of commentators arguing that large-scale VAS programs should be discontinued.322
Critics have raised concerns about VAS including:
- Weaknesses in the evidence that VAS reduces child mortality (e.g., due to unexplained heterogeneity between studies).323
- Uncertainty about whether VAS is likely to reduce mortality in contemporary health environments (e.g., because of increased vaccine coverage since the earlier trials were conducted).324
- Health risks (e.g., from possible harmful vaccine interactions).325
- VAS programs diverting attention and resources away from other public health programs, and other efforts to improve nutritional status (e.g., breastfeeding promotion).326
- While we haven’t reviewed all these commentaries in detail, we have thought about a number of the concerns they raise and discuss them throughout the report (details in footnote).327 Overall, we agree that many of these questions are significant sources of uncertainty or reasons why we’d expect the impact of VAS to be lower than reported in the underlying studies, but our best estimate is that VAS is still highly cost-effective after accounting for them.
- We still see this controversy as a concern. In general, we tend to have more confidence in programs that command widespread scientific support and it’s possible that we have got some of our key judgment calls about the evidence wrong. We also have not systematically sought feedback from VAS critics on our VAS research and it’s possible that this means we’re missing something.
6.4 What is the observational evidence on VAS and mortality?
Why is this important? We generally rely on randomized controlled trials (RCTs) for evidence about the causal impact of a program. But all else equal, it strengthens our confidence if observational evidence is also supportive, for example, evidence that large-scale programs show similar impact to studies conducted in experimental conditions. There might be a number of reasons why these programs might not show the same impacts as RCTs.
How we’ve accounted for this
Our bottom line: The only large-scale observational study of VAS on mortality we have seen does not provide evidence of mortality reductions. While we think this study is not very informative, it is a small negative update. We have not reviewed other observational evidence.
In more detail:
- In 2023, we received a summary of an unpublished meta-analysis from Dr. Christine Benn of four observational studies of national immunization campaigns in Guinea-Bissau, Bangladesh, and Ghana.328 Some of these campaigns were co-delivered with VAS.
- Dr. Benn’s meta-analysis (details on methodology in footnote)329 found no evidence that the campaigns co-delivered with VAS were associated with decreases in mortality. Using a random-effects analysis, the study found that the VAS campaigns (either alone or co-delivered with another vaccine) were associated with a 12% increase in mortality risk in the period after the campaign relative to the period before (relative risk 1.12, 95% CI 0.86 - 1.47). This is not statistically significant, but the statistical significance of this finding depends on how the studies are pooled (discussion in footnote).330 The mortality risks in each country varied from an 11% decrease (relative risk 0.89, 95% CI 0.72 - 1.09) in Ghana to a 39% increase in Guinea-Bissau (relative risk 1.39, 95% CI 1.20 - 1.61).331
- At the time of writing (February 2024) we have lightly reviewed these results and considered how they could affect our analysis. Based on this review, we do not think this study provides compelling evidence that VAS does not reduce mortality, because:
- The underlying data are observational and therefore at higher risk of bias than the evidence from RCTs. We’ve received feedback from the author that she believes confounding is unlikely to be driving the results,332 but we haven’t deeply investigated or tried to corroborate this.
- The confidence interval for the random-effects analysis (VAS is associated with a 14% decrease to a 47% increase in mortality) encompasses our estimate of the effect of VAS (~4% to ~12% reduction in mortality across locations, more above).
- The analysis has not yet been published or peer reviewed.
- The analysis is based on only three locations, with substantial heterogeneity across sites.
- Because of our doubts about this evidence, we do not currently incorporate it into our analysis. We may do more work on this question as part of a wider assessment of recent evidence for VAS-vaccine interactions in the future, and consider whether we should update our estimate about the effect of VAS on mortality to account for this. We’re also aware of additional observational evidence on VAS and mortality (e.g., correlations between vitamin A status, mortality, and disease risk) that we have not yet investigated in depth.
6.5 Should GiveWell fund other ways of reducing vitamin A deficiency?
Why is this important? To date, the only vitamin A program GiveWell has funded has been VAS, and we’ve only supported delivering VAS through mass campaigns. It might be that we’re missing other cost-effective ways of reducing deficiency.
How we’ve accounted for this
- We haven’t yet investigated whether we could fund other programs to improve vitamin A deficiency among children eligible for VAS in any detail.
- In 2023, we conducted an initial unpublished analysis suggesting that vitamin A fortification could be a promising funding opportunity. Reasons for thinking this:
- There is some limited evidence that fortification may reduce vitamin A deficiency.333
- One randomized controlled trial of VAS found that low-dose, weekly vitamin A supplementation (plausibly mimicking fortification) led to a large reduction in under-5 mortality.334
- A non-randomized controlled trial of vitamin A fortification in Indonesia reported a large reduction in under-5 mortality.335
- We’d expect fortification programs to be relatively cheap.
- However, direct evidence of the impact of fortification on mortality is limited, we don’t know what opportunities for funding fortification programs exist, and we haven’t spoken to experts about the relative benefits of fortification and supplementation programs. We plan to prioritize a deeper investigation into fortification, including biofortification, in the future.
- We’ve also not deeply considered funding VAS in other ways, some of which may be promising in addition to VAS campaigns (e.g., advocacy to increase global funding for VAS, as we think it is underfunded in general).
6.6 Is GiveWell’s funding of VAS crowding out other funders over the long term?
Why is this important? Our adjustments for the impact of GiveWell funding on other actors’ spending mainly consider the probability that another actor would fund VAS if we didn’t in the short term. They do not fully account for the long-term impact. For example, it might be that GiveWell’s funding could create an expectation of future funding and displace other actors’ funding that would have gone to VAS into other programs.
How we’ve accounted for this
- While we regularly think about this question in our grantmaking, we’ve found it challenging to get good information on whether or not it is happening.
- Our best guess is that the other main external funders of VAS (UNICEF and Global Affairs Canada) have contributed less to VAS than they otherwise would in recent years because of GiveWell’s VAS funding. However, we haven’t been able to find clear evidence of this. Our understanding is that Global Affairs Canada funding for VAS via UNICEF appears to have remained roughly stable since GiveWell began funding VAS programs, although this is based on limited information.336 UNICEF’s discretionary funding for VAS may have become more limited over the same period337 , but we don’t have a good understanding of what share of UNICEF’s total VAS spending comes from discretionary funds or how/why it chooses to support VAS in specific countries.
- We plan to continue investigating this question through conversations with other funders and VAS experts, although we expect that this will remain an open question and source of uncertainty.
6.7 Is it intuitively plausible that VAS is cost-effective?
Why is this important? In general, we are more confident in our funding recommendations if we can easily explain the intuitive case for why a program is cost-effective. Thinking through the intuition behind a program can help us reveal where we might have made mistakes.
How we’ve accounted for this
- We set out the intuitive case for VAS in the report summary. Overall, we see the strength of this case as moderate.
- In their most simple terms, GiveWell’s cost-effective analyses can be boiled down to the following components: (a) burden (does the intervention tackle a big problem), (b) impact (does the intervention have a significant impact on the problem), (c) cost (is the intervention cheap to deliver), and (d) impact of our funding the program on intervention uptake (does our funding lead to more people receiving the intervention).
- The case for VAS on these criteria is mixed:
- Burden: Mortality among children under five is high in locations where GiveWell funds VAS, although we’re unsure about the number of diarrhea and measles deaths most likely to be averted by VAS (more above).
- Impact: We think that VAS probably leads to a meaningful reduction in child mortality, with the caveats discussed above. An additional concern here is that the mechanism for VAS reducing mortality is unclear, and we tend to have more confidence in programs with clear mechanisms.
- VAS is very cheap (more above).
- We expect that GiveWell funding leads to an increase in the number of children reached with VAS, although we’re unsure about this because (a) we think a substantial number of children would receive VAS through other sources in the absence of campaigns (more), (b) there’s a moderate chance these campaigns would have been funded by others in GiveWell’s absence (more), and our estimates of both of these factors is based on limited information.
6.8 How does our cost-effectiveness model compare to others?
Why is this important? GiveWell’s analysis is only one attempt to model the cost-effectiveness of different global health programs. We would find it concerning if other analyses found that VAS is significantly less cost-effective than we currently estimate.
How we’ve accounted for this
- We haven’t searched for or analyzed other cost-effectiveness analyses of VAS. We may do this in the future, although we see this as a relatively low priority because there might be a number of definitional and methodological reasons why we would reach different conclusions to other analyses.
6.9 How accurate was our analysis of VAS in hindsight?
Why is this important? Our cost-effectiveness analyses are "forward-looking." They aim to project the future impact of funding a program at the time we make a grant decision. We would be concerned if backwards checks of our analysis found significant problems we hadn’t considered at the time we made our decisions, or were overly optimistic in general.
How we’ve accounted for this
- In general, GiveWell has paid less attention to backwards checks to understand how accurate our predictions were, and more attention to making our forward projections as accurate as possible. This is a weakness in our approach and something we aim to improve in the future.
- In 2023, we began conducting a retrospective analysis to understand how our best guesses about VAS cost-effectiveness had changed over time. We compared our VAS cost-effectiveness analyses for grants made to Helen Keller between 2018 and 2021 with an updated analysis, incorporating our best guesses as of 2023. As of the time of writing (February 2024), we have not yet finalized this work and we are unsure about the timeline for completing this analysis.
6.10 Will VAS remain impactful in the future?
Why is this important? Our cost-effectiveness analysis aims to model the impact of our funding at the time we make a grant, but this may reflect program delivery several years in the future. We could be making mistakes if we don’t anticipate likely changes in the VAS landscape.
How we’ve accounted for this
- We have generally paid attention to making our analysis accurate at the time we make a grant. We want to improve this aspect of our work in the future and think in more detail about possible future changes, although this is inherently uncertain.
- Our biggest open question for the future of VAS is how it will be affected by the scale-up of azithromycin (an antibiotic used to treat infection). WHO issued a conditional recommendation for mass distribution in 2020 in high mortality settings,338 and we expect that it will scale-up significantly in locations where GiveWell funds VAS (which have very high child mortality rates) in the near future.
- Our best guess is that deaths potentially averted by azithromycin distribution will overlap with deaths potentially averted by VAS, implying that each intervention will have a smaller effect if delivered together than if delivered separately. However, our understanding is that the mechanism for azithromycin averting mortality is not well understood (as for VAS),339 and so we’re unsure how much the benefits of each intervention are likely to overlap. This concern may also apply to interactions between VAS and other child health programs (e.g., ORS340 and zinc distribution) too, although we see azithromycin as the most important research priority because of the potential mechanism overlap, substantial effect size, and possibility of rapid scale-up.
- We plan to investigate this in more detail in the future for grants where we think both interventions could be delivered together, and we may also explore opportunities to fund co-delivery of both interventions (since this could offer opportunities to deliver each intervention at lower cost).
7. Previous VAS grants
8. Sources
- 1
Xerophthalmia (dry eyes), is "the leading cause of preventable childhood blindness" WHO, Global prevalence of vitamin A deficiency in populations at risk 1995–2005, 2009, p 1.
- 2
"Vitamin A deficiency (VAD) impairs body functions and may cause death. Adverse health consequences may also include xerophthalmia (dry eyes), susceptibility to infection, stunting and anaemia (Sommer 1996; Rice 2004)." Imdad et al. 2010, p. 9.
- 3
"Low vitamin A intake during nutritionally demanding periods in life, such as infancy, childhood, pregnancy and lactation, greatly raises the risk of health consequences, or vitamin A deficiency disorders (VADD)." WHO, Global prevalence of vitamin A deficiency in populations at risk 1995–2005, 2009, p. 1.
- 4
"Chronic VAD may develop when animal sources and fortified foods are limited, as in diets that rely heavily on vegetables and fruits (Ramakrishnan 2002)." Imdad et al. 2010, p. 9.
- 5
"In settings where vitamin A deficiency is a public health problem, vitamin A supplementation is recommended in infants and children 6–59 months of age as a public health intervention to reduce child morbidity and mortality (strong recommendation)." p. 1.
See p. 5 of the WHO guidelines for the 4-6 month recommended schedule.
WHO, Guideline: vitamin A supplementation in infants and children 6-59 months of age, 2011, pp. 1, 5. - 6
"Mass distribution campaigns are the main delivery mechanism for VAS. These campaigns are organized at least every 6 months…"
"Because mass campaigns take place only every 4 to 6 months, children who reach the age of 6 months between two campaigns, may have to wait several months before they get their first dose of Vitamin A despite being the most vulnerable age group.
"To remedy this, HKI is working closely with country-level health sector experts to add a contact point in national immunization calendars – at 6 months, when no other vaccination is scheduled.
"Additionally, HKI supports routine facility-based and outreach delivery of vitamin A for all children under 5 in countries where stronger health systems offer sufficient access to quality services. Few countries are ready for this approach and these still need to develop social mobilization actions to create demand to match the capacity to offer services." Helen Keller Intl, VAS overview brochure, p. 2. - 7
This spreadsheet lists the distribution methods and co-delivered interventions for VAS mass distribution campaigns that Helen Keller supported with GiveWell-directed funding in 2018 through 2021.
- 8
This understanding is based on many conversations with Helen Keller and other VAS stakeholders over time.
- 9
In January 2022, GiveWell recommended a $9m grant to Nutrition International to support VAS campaigns in Chad. This was the first VAS grant we had made to a grantee other than Helen Keller Intl. The grant is summarized here.
- 10
We focus on these locations because they are the locations that GiveWell actively supported in our most recent main grant cycle, as of February 2024 (see our grant pages for Helen Keller’s program here and Nutrition International’s VAS program in Chad here). Some columns in our cost-effectiveness analysis are for countries (or Nigerian states) that GiveWell has either considered for previous grants but not yet funded (e.g., Uganda), or funded in the past but discontinued funding because we estimate that VAS in that country was below our cost-effectiveness bar (e.g., Kenya). We think that the range used here is the best reflection of the value of VAS in locations supported by GiveWell donors.
- 11
We used the following process:
- Two GiveWell staff members familiar with our research on VAS gave confidence intervals for the parameters in the Simple CEA sheet of our cost-effectiveness analysis. The intervals were for Helen Keller Intl's program in Guinea (the example program we discuss in this report). These intervals address the following question: "For each parameter, provide an upper and lower bound for the range of values that you think has a 50% probability of containing the true value (i.e., a 25% probability the true value is lower than the range, and a 25% probability the true value is higher)."
- Where we felt that it was difficult to form an intuitive judgment about a parameter (e.g., because it comprised several separate parameters), we gave intervals for each individual parameter.
- One of the two GiveWell staff members compared both sets of intervals and decided upon a final interval for each parameter, using their subjective judgment.
- We applied the intervals used for Guinea to other countries as follows:
- We first calculated both the relative differences and absolute differences between our best guesses and our 25th and 75th percentile values for each parameter. For example, if our best guess value for a parameter was 50% with 25th and 75th percentile values of 25% and 75%, then the relative differences would be -50% and +50%, and the absolute differences would be -25 percentage points and +25 percentage points.
- We assigned confidence intervals to each country that matched the widths of our confidence intervals for Guinea, putting some weight on the relative difference between the confidence interval bounds and the best guess and some weight on the absolute difference. The higher our best guess value for a parameter in a country was compared to our best guess for Guinea, the more weight we put on the absolute difference between the confidence interval bounds and our best guess. The purpose of this method was to avoid assigning extremely wide confidence intervals to parameters in countries where our best guess was much higher than our best guess for Guinea. In some limited cases, we manually adjusted estimates where the intervals seemed implausible, compared to our best guess for Guinea.
- Finally, we used monte carlo simulations to transform the confidence intervals for individual parameters into an aggregated confidence interval for each parameter. These are the intervals that appear in the summary table of this page, and the Guinea columns in the Sensitivity Analysis sheet of our cost-effectiveness analysis.
- Two GiveWell staff members familiar with our research on VAS gave confidence intervals for the parameters in the Simple CEA sheet of our cost-effectiveness analysis. The intervals were for Helen Keller Intl's program in Guinea (the example program we discuss in this report). These intervals address the following question: "For each parameter, provide an upper and lower bound for the range of values that you think has a 50% probability of containing the true value (i.e., a 25% probability the true value is lower than the range, and a 25% probability the true value is higher)."
- 12
$1m is an arbitrary amount that we use to quantify the benefits of the program in the rest of our analysis. See this row in our cost-effectiveness analysis.
- 13
Note: We focus on our estimates for Helen Keller here rather than Nutrition International. Our estimates of the cost per supplement delivered for Nutrition International’s programs are based either on projected future budgets or on adapted versions of our cost per supplement analysis for Helen Keller, and we have less confidence in them than our estimates for Helen Keller. For more detail, see this section of our cost-effectiveness analysis.
- 14
See this row of our cost-effectiveness analysis. Note: This range is based on the following locations: Burkina Faso, Cameroon, Côte d'Ivoire, DRC, Guinea, Madagascar, Mali, Niger, and five states in Nigeria: Adamawa, Benue, Ebonyi, Nasarawa, and Taraba. See this section for our reasoning.
- 15
Applying this adjustment, the number of additional children we estimate will receive VAS as a result of Helen Keller's program ranges from ~413,000 (in Guinea) to ~760,000 in Mali. See this row in our cost-effectiveness analysis.
- 16
See this row in our cost-effectiveness analysis.
- 17
See these rows in our cost-effectiveness analysis.
- 18
See this row in our cost-effectiveness analysis. The per round cost ($0.91 in Guinea), presented in the table above ($0.77 + $0.14), is the annual cost divided by 2.
- 19
See this column in our cost per supplement analysis.
- 20
The % of target children receiving VAS.
- 21
See this row in our analysis of Helen Keller’s monitoring.
- 22
Our understanding is that workers implementing these campaigns may know in advance which campaign rounds / locations will be surveyed. If that is the case, we would guess that workers would be more incentivized to ensure high coverage in surveyed campaigns than non-surveyed campaigns (which have less oversight). This could result in overall coverage estimates being biased upwards. See this section of our review of Helen Keller’s VAS program for more details on this concern.
- 23
We would expect these figures to be inflated somewhat by methodological features of the campaigns (e.g., social desirability bias for a self-reported outcome like whether a child has received VAS). We account for this separately in our analysis with a downward adjustment for monitoring and evaluation. This is discussed in this section of the report.
- 24
Note - this figure does not appear directly in our analysis, because we only present the number of children reached in each individual campaign. We obtain this figure by dividing 6,003,796 (the total number of supplements we estimate were delivered, here) by 7,677,689 (the sum of the total number of children targeted in this column).
- 25
See these rows in our cost-effectiveness analysis for this figure and this section below for more details on our reasoning.
- 26
Helen Keller’s spending includes both funding in the form of grants to national governments to pay for VAS campaigns ("Sub Agreements") and spending by Helen Keller itself on programs ("Activities").
Helen Keller’s summaries of its spending also include some funding for "Regional & Global support" or "Management" costs. Our understanding is that these costs are central support costs (e.g., staff time at Helen Keller’s head or regional offices) which are not attributable to any single country. We divide these costs proportionately between each country in our analysis in proportion to that country’s share of total program spending. See the "HKI costs" section of each country sheet in our cost per supplement analysis. - 27
See the "Total" column for each year’s breakdown of spending in this sheet.
- 28
See this cell in our cost per supplement analysis.
- 29
Key assumptions:
- National-level financial contributions are allocated proportionally to Helen Keller areas: Helen Keller typically supports campaigns in designated focus areas in each country, but our understanding is that some other actors’ funding is designated for the whole country. Where this is the case, we include this funding in our analysis, allocated proportionally to the size of targeted populations in Helen Keller-supported areas and other areas.
- For example, Helen Keller has told us that the Burkina Faso Ministry of Health made financial contributions of $455,834 to the first VAS campaign of 2019. Our understanding is that this spending from the Ministry of Health provides payments to Community Health Workers who distribute vitamin A supplements. We assume that this funding was not allocated only for Helen Keller-supported areas, and allocate it in our analysis proportionally to the size of targeted populations in Helen Keller-supported areas and other areas. See this section of our cost per supplement analysis explanatory notes for further details.
- We include an estimate of indirect costs for implementing organizations, but not funders: Our understanding is that some NGOs contributing funding to Helen Keller-supported campaigns are best understood as "implementers" (i.e., they have an in-country office and play a role in delivering campaigns), whereas others are best understood as "funders" (i.e., they only provide financial contributions, and do not play a role in delivering campaigns). We would guess that implementers incur additional costs beyond its grants directly to national governments (e.g., costs for staff time). For these organizations (e.g., the WHO in Guinea, Niger and Mali), we therefore typically include a rough estimate of indirect costs, which we do not include for funders (e.g., the Global Fund in Burkina Faso). Our specific method for calculating indirect costs varies somewhat by organization. Our assumptions for these estimates are highly uncertain. See our cost per supplement analysis explanatory notes for detailed reasoning by country.
- We do not (with some exceptions) include costs incurred by UNICEF: Our understanding is that in the countries where Helen Keller supports VAS campaigns, the other main NGO supporting these campaigns is UNICEF. Typically, Helen Keller and UNICEF both provide support at the national level and also have designated focus regions where each organization supports campaign delivery (see this section of our separate report on Helen Keller’s program for more information). Because in most cases we are estimating the costs of campaigns in Helen-Keller supported regions only, we largely exclude estimates of UNICEF’s costs from our analysis. We make an exception and include UNICEF spending for the first campaign round in Niger in 2019 and the first campaign round in Koulikoro and Sikasso regions in Mali in 2020 (see the detailed reasoning for Niger and Mali respectively in our explanatory notes).
See our detailed explanatory notes about our cost per supplement analysis for further information by country.
- National-level financial contributions are allocated proportionally to Helen Keller areas: Helen Keller typically supports campaigns in designated focus areas in each country, but our understanding is that some other actors’ funding is designated for the whole country. Where this is the case, we include this funding in our analysis, allocated proportionally to the size of targeted populations in Helen Keller-supported areas and other areas.
- 30
Our understanding is that WHO provided costs for polio campaigns in Guinea in 2018 and 2019 and VAS was co-delivered alongside these campaigns (more discussion here). We estimate that WHO incurred ~$1.9m on these campaigns in Guinea in 2018-19, and that 44% of these costs were incurred in locations supported by Helen Keller. This implies a cost of $0.14 per capsule delivered ($1.9m x 44%) / ~6m = $0.14. See this row in our analysis.
- 31
- "Micronutrient Initiative (MI) (the name of the organization changed ~1 month ago to Nutrition International or NI) is only active in 4 of the 13 countries were HKI is operational, however MI provides the needed number of vitamin A capsules to all countries where HKI works. MI’s role essentially takes place at the national level, providing technical and policy guidance to governments. In most cases, MI delivers the vitamin A capsules to UNICEF, who organizes their management with the national government and ensures that they reach the field." Helen Keller Intl, HKI country-level technical support related to vitamin A supplementation (unpublished).
- "We have been a global leader in vitamin A supplementation since our inception 30 years ago, supporting governments to integrate VAS into existing health platforms and ensuring children are not missed with lifesaving VAS. We have led in setting the manufacturing standards and providing vitamin A capsules to eligible countries through the in-kind donation program – implemented with UNICEF, and with support from the Government of Canada – procuring and donating more than 10 billion capsules since 1997." Nutrition International, "Strengthening health systems to deliver lifesaving vitamin A," 2022. Accessed May 2023.
- 32
For our calculations, see the "Supplement costs" section of each country sheet in our cost per supplement analysis. We assume the cost to procure and distribute each capsule is the same across countries.
- 33
See this row of our cost per supplement analysis.
- 34
See footnote 88 of our separate report on Unlimit Health, the deworming organization which ran the study, for a detailed summary of our method in calculating this 30% figure.
- 35
Including these costs, we estimate that each child reached costs $1.39 in Guinea. Excluding these costs, we estimate a cost of $0.91. See this section in our cost per supplement analysis.
- 36
Our reasoning for this assumption is that, if Helen Keller spends more on VAS campaigns in a given country, the number of capsules required for the program and the amount of government time dedicated to these campaigns is likely to increase in response. Our best guess is that this is not true for other NGOs’ spending on Helen Keller-supported campaigns. We assume that these resources would have been spent on VAS in any case regardless of the size of the Helen Keller VAS program.
- 37
In some (but not all) of the countries where GiveWell funds VAS, VAS is delivered as part of the country’s routine immunization schedule at routine healthcare appointments. See Nigeria’s routine childhood immunization schedule here for an example.
- 38
See this row in our cost-effectiveness analysis for the 25% estimate. In Madagascar, we use 44% for this estimate (see GiveWell, Baseline VAS coverage in 6 regions in Madagascar proposed by Helen Keller Intl, 2023).
- 39
Note: this is separate from our estimates of whether GiveWell funding for VAS would be replaced by another actor in our absence. We account for this possibility separately in another part of our analysis.
- 40
"Vitamin A supplements in Kenya are administered to children aged 6-59 months through various delivery approaches. Throughout the year, children can access VAS in primary health care facilities, but this routine coverage only accounts for around 20 percent of children." Helen Keller Intl, Room for More Funding Report, 2021, p. 21.
- 41
These survey figures are unpublished, because we have not yet asked Helen Keller for permission to publish the names of these countries.
- 42
"Vitamin A supplements in Kenya are administered to children aged 6-59 months through various delivery approaches. Throughout the year, children can access VAS in primary health care facilities, but this routine coverage only accounts for around 20 percent of children, essentially children below 12 months, as many caregivers do not bring their children to the health facilities after the end of the immunization contact points at one year of age." Helen Keller Intl, Room for More Funding Report, 2021, p. 21.
- 43
See our analysis in GiveWell, Baseline VAS coverage in 6 regions in Madagascar proposed by Helen Keller Intl, 2023 .
- 44
We see the Madagascar data as providing a relatively clean estimate of routine VAS coverage, because our understanding is that no VAS campaigns took place in the period immediately before the survey (in 2021) in Madagascar.
"Starting in 2019, MCHW was phased out, and VAS was integrated into routine health services…Throughout 2020 and 2021, no significant VAS activities took place in the country." Helen Keller Intl, VAS scoping visit - Madagascar, October 2022, p. 2.
We have not seen equivalent data for other countries. While other Demographic and Health Surveys also measure VAS coverage, we think that these will be capturing coverage through campaigns as well as routine services, and it is hard to separate the two out.
In 2023, GiveWell commissioned Rethink Priorities to investigate what other data sources could be used to inform our estimates of VAS coverage in the absence of GiveWell campaigns. The main finding from the research was that limited data was available to answer this question, and it was challenging to separate VAS coverage achieved through routine services from coverage achieved in campaigns in the sources available. Because we remain uncertain about this question, we have not updated our estimates. We plan to spend more time on this question in the future. A summary of the Rethink Priorities work is available here. - 45
See these rows in our cost-effectiveness analysis.
- 46
Our analysis estimates the number of children reached using the following method:
- First, we estimate how many children are reached with VAS with GiveWell funding, based on target population estimates and Helen Keller coverage surveys.
- Second, we roughly guess how many children would have been reached with VAS from other sources regardless of Helen Keller’s funding.
- We use these two estimates to produce an overall estimate of the number of children reached as a result of GiveWell VAS funding.
- Note that this method is distinct from directly measuring the impact of GiveWell funding on VAS coverage. For example, we could conduct baseline VAS surveys before funding VAS in a given location, then surveys after funding an initial campaign, and use these to estimate the increase in the proportion of children receiving VAS.
- 47
See this section of our separate report on Helen Keller’s program for more detail.
- 48
In 2017, we created a number of case studies to understand what impact Helen Keller funding had in countries where it provided funding for VAS between 2013 and 2016. We concluded that there was some evidence that its funding enabled campaigns to occur and some evidence of increasing coverage rates, although the strength of the evidence varied by country. We haven’t conducted further work on this question since 2017.
- 49
Our reasoning differs somewhat country-to-country:
- Côte d’Ivoire: We think our cost per supplement estimate is implausibly low ($0.53) and we have previously heard from Helen Keller that some costs may have been omitted from the information they shared with us.
- Kenya: We think our cost per supplement estimate is low ($0.78), and we have low confidence in this estimate because it relies on two coverage surveys, one in 2019 and one in 2020, that may not be representative of all Helen Keller-supported areas in Kenya.
- DRC: We think our cost per supplement estimate is implausibly low ($0.58), especially considering that Helen Keller’s program in DRC is relatively new, and we would have expected start-up costs to be high.
- Nigeria: We think our cost per supplement estimate is low ($0.72), and Helen Keller didn't report spending by any other actors in Helen Keller-supported regions for these campaigns, other than a small amount of spending by Saving One Million Lives in 2020. We would guess that some other actors’ spending may have been excluded from the totals we received.
See this section of our cost per supplement explanatory notes onwards for further information.
- 50
Helen Keller has informed us:
- In Côte d’Ivoire the government uses a different model with less training for distributors than in other locations.
- In DRC, there is a lot of pressure from other actors to keep costs low. Helen Keller also attributed low costs to a highly experienced VAS team in DRC.
- In Nigeria, VAS campaigns use a fixed point rather than a door-to-door model, which is likely to keep costs low.
Helen Keller also agreed that costs were likely to be lower in Kenya than other countries, although we are uncertain what specific factors contributed to this.
Source: Helen Keller conversations with GiveWell, October 28, 2022 and January 26, 2023 (unpublished). - 51
See this section of our cost per supplement analysis.
- 52
See this section of our cost-effectiveness analysis.
- 53
See this row of our cost-effectiveness analysis. This range is based on the following locations: Burkina Faso, Cameroon, Chad, Côte d'Ivoire, DRC, Guinea, Mali, Madagascar, Niger, and five states in Nigeria: Adamawa, Benue, Ebonyi, Nasarawa, and Taraba (for Helen Keller), and Chad (for Nutrition International). We focus on these locations for the reasons discussed above.
- 54
See this row of our cost-effectiveness analysis. This range is based on the following locations: Burkina Faso, Cameroon, Chad, Côte d'Ivoire, DRC, Guinea, Mali, Madagascar, Niger, and five states in Nigeria: Adamawa, Benue, Ebonyi, Nasarawa, and Taraba (for Helen Keller), and Chad (for Nutrition International). We focus on these locations for the reasons discussed above.
- 55
See this row in our cost-effectiveness analysis. This range is based on the following locations: Burkina Faso, Cameroon, Chad, Côte d'Ivoire, DRC, Guinea, Mali, Madagascar, Niger, and five states in Nigeria: Adamawa, Benue, Ebonyi, Nasarawa, and Taraba (for Helen Keller), and Chad (for Nutrition International). We focus on these locations for the reasons discussed above.
- 56
See this row in our cost-effectiveness analysis. This range is based on the following locations: Burkina Faso, Cameroon, Côte d'Ivoire, DRC, Guinea, Mali, Madagascar, Niger, and five states in Nigeria: Adamawa, Benue, Ebonyi, Nasarawa, and Taraba (for Helen Keller) and Chad (for Nutrition International). We focus on these locations for the reasons discussed above.
- 57
Cochrane, formerly known as the Cochrane Collaboration, is a not-for-profit research organization which synthesizes health research in systematic reviews.
"Cochrane is an international network with headquarters in the UK, a registered not-for-profit organization, and a member of the UK National Council for Voluntary Organizations.
…There are now over 7,500 Cochrane Systematic Reviews which we publish in the Cochrane Library. We also play a key role in developing new methods in evidence synthesis." Cochrane, "About us", accessed February 17th 2023. - 58
Note: An updated version of the same meta-analysis, Imdad et al. 2022, has been published since we conducted this analysis. This update did not identify any new studies meeting the inclusion criteria and the main findings were unchanged. For simplicity, we continue to cite Imdad et al. 2017 throughout this report.
- 59
Two of the trials included, Herrera et al. 1992 and Stansfield 1993, were quasi-randomized rather than truly randomized.
"We excluded quasi-RCTs with the exception of Herrera 1992 and Stansfield 1993; we made this decision post hoc (Differences between protocol and review). Given the design of the interventions and the placebos as well as steps to blind those administering the sequence, we do not think these studies are meaningfully different from RCTs. Herrera 1992 assigned participants alternately by household, while Stansfield 1993 used a random starting point and alternating distribution of red or green pills. Lack of a truly random sequence was not related to other sources of bias (for example, performance bias) because individuals delivering the capsules had no ongoing contact with participants, and the manufacturer (Roche) held the code until the study was completed." See Imdad et al. 2017, pp. 7-8. - 60
"We identified 47 studies (4 of which are new to this review), involving approximately 1,223,856 children. Studies took place in 19 countries: 30 (63%) in Asia, 16 of these in India; 8 (17%) in Africa; 7 (15%) in Latin America, and 2 (4%) in Australia. About one-third of the studies were in urban/periurban settings, and half were in rural settings; the remaining studies did not clearly report settings. Most of the studies included equal numbers of girls and boys and lasted about a year. The included studies were at variable overall risk of bias; however, evidence for the primary outcome was at low risk of bias. A meta-analysis for all-cause mortality included 19 trials (1,202,382 children)." Imdad et al. 2017, abstract.
- 61
This range depends on whether a fixed-effects (12% mortality reduction) or random-effects (24% reduction) analysis is used. We use the random-effects finding as the main input in our cost-effectiveness analysis See this section for further details on each method and our reasoning for using the random-effects analysis.
"At longest followup, there was a 12% observed reduction in the risk of all-cause mortality for vitamin A compared with control using a fixed-effect model (risk ratio (RR) 0.88, 95% confidence interval (CI) 0.83 to 0.93; high-quality evidence). This result was sensitive to choice of model, and a random-effects meta-analysis showed a different summary estimate (24% reduction: RR 0.76, 95% CI 0.66 to 0.88); however, the confidence intervals overlapped with that of the fixed-effect model." Imdad et al. 2017, abstract. - 62
See this row in our cost-effectiveness analysis.
- 63
"We identified 47 studies (4 of which are new to this review), involving approximately 1,223,856 children. Studies took place in 19 countries: 30 (63%) in Asia, 16 of these in India; 8 (17%) in Africa; 7 (15%) in Latin America, and 2 (4%) in Australia. About one-third of the studies were in urban/periurban settings, and half were in rural settings; the remaining studies did not clearly report settings. Most of the studies included equal numbers of girls and boys and lasted about a year. The included studies were at variable overall risk of bias; however, evidence for the primary outcome was at low risk of bias. A meta-analysis for all-cause mortality included 19 trials (1,202,382 children)." Imdad et al. 2017, abstract.
- 64
See this document for our summary of each study’s follow-up period. Note that the follow-up window was unclear for one study (Vijayaraghavan et al. (1990)).
- 65
"At longest followup, there was a 12% observed reduction in the risk of all-cause mortality for vitamin A compared with control using a fixed-effect model (risk ratio (RR) 0.88, 95% confidence interval (CI) 0.83 to 0.93; high-quality evidence). This result was sensitive to choice of model, and a random-effects meta-analysis showed a different summary estimate (24% reduction: RR 0.76, 95% CI 0.66 to 0.88); however, the confidence intervals overlapped with that of the fixed-effect model." Imdad et al. 2017, abstract.
- 66
"Nine trials reported mortality due to diarrhoea and showed a 12% overall reduction for VAS (RR 0.88, 95% CI 0.79 to 0.98; 1,098,538 participants; high-quality evidence)." Imdad et al. 2017, abstract.
- 67
"Six studies reported a lower risk of mortality due to measles, but the effect was not statistically significant (RR 0.88, 95% CI 0.69 to 1.11; 1,088,261 participants." Imdad et al. 2017, p. 18.
- 68
"Lower respiratory tract infection Nine studies did not show any significant difference between the intervention and placebo group (RR 0.98, 95% CI 0.86 to 1.12; 1,098,538 participants." Imdad et al. 2017, p. 18.
- 69
The confidence intervals, particularly for measles, included a wide range of possible effects:
- Diarrhea mortality: the confidence interval ranged from a 2% to a 21% mortality decrease.
- Measles: the confidence interval ranged from an 11% increase to a 31% decrease.
- Lower respiratory tract infection: the confidence interval ranged from an 12% increase to a 14% decrease.
See the footnotes immediately above for citations.
In addition, Imdad et al. 2017 notes that secondary outcomes reported in trials are more likely to be affected by selective reporting bias because studies might only report secondary outcome data if they find positive results.
"Most of the trials in the review included multiple outcome measures, and positive results are more likely to be included in reports than negative results. Only seven (14%) studies appeared to be free of selective outcome reporting (Florentino 1990; Rahmathullah 1990; West 1991; Dibley 1996; Benn 1997; DEVTA trial 2013; Fisker 2014). We judged 26 (55%) studies to be at unclear risk of bias and 14 (29%) studies to be at high risk of bias (Pinnock 1988; Van Agtmaal 1988; Vijayaraghavan 1990; Ross 1993 HEALTH; Ross 1993 SURVIVAL; Stansfield 1993; Ramakrishnan 1995; Pant 1996; Bahl 1999; Arya 2000; Cherian 2003; Lin 2008; Lin 2009; Lima 2014). Most of the studies did not cite a published protocol, which is why we assessed a large proportion of studies to be at unclear risk of bias."
"Some secondary outcomes did not contain a majority of the children randomised in the review, and these results may be vulnerable to selective outcome reporting bias." Imdad et al. 2017, pp. 16, 23. - 70
"Nine trials reported mortality due to diarrhoea and showed a 12% overall reduction for VAS (RR 0.88, 95% CI 0.79 to 0.98; 1,098,538 participants; high-quality evidence)."
"Six studies reported a lower risk of mortality due to measles, but the effect was not statistically significant (RR 0.88, 95% CI 0.69 to 1.11; 1,088,261 participants."
"Lower respiratory tract infection Nine studies did not show any significant difference between the intervention and placebo group (RR 0.98, 95% CI 0.86 to 1.12; 1,098,538 participants." Imdad et al. 2017, abstract, p. 18. - 71
"Six studies reported a 50% decrease in measles incidence (RR 0.50, 95% CI 0.37 to 0.67; 19,566 participants…We judged this evidence to be of moderate quality." Imdad et al. 2017, p. 20.
- 72
"Fifteen studies reported a 15% decrease in diarrhoea incidence (RR 0.85, 95% CI 0.82 to 0.87; 77,946 participants…We judged this evidence to be of low quality (see Summary of findings for the main comparison)." Imdad et al. 2017, p. 18.
- 73
"Eleven studies reported no combined effect for VAS on LRTI incidence (RR 0.99, 95% CI 0.92 to 1.06; 27,540 participants…We judged the quality of this evidence to be low (see Summary of findings for the main comparison)." Imdad et al. 2017, p. 21.
- 74
"In summary, the primary outcome was at low risk of bias, and the size and the significance of the effect cannot be explained by bias. While there was some evidence of small study bias for secondary outcomes, further research is unlikely to change the conclusion that VAS, delivered with high quality and coverage, prevents death among children aged 6 to 59 months in low- and middle-income countries." Imdad et al. 2017, p. 23.
The full assessment of risks of bias for each trial is in Imdad et al. 2017, pp. 14-16. - 75
"Most of the trials in the review included multiple outcome measures, and positive results are more likely to be included in reports than negative results. Only seven (14%) studies appeared to be free of selective outcome reporting (Florentino 1990; Rahmathullah 1990; West 1991; Dibley 1996; Benn 1997; DEVTA trial 2013; Fisker 2014). We judged 26 (55%) studies to be at unclear risk of bias and 14 (29%) studies to be at high risk of bias (Pinnock 1988; Van Agtmaal 1988; Vijayaraghavan 1990; Ross 1993 HEALTH; Ross 1993 SURVIVAL; Stansfield 1993; Ramakrishnan 1995; Pant 1996; Bahl 1999; Arya 2000; Cherian 2003; Lin 2008; Lin 2009; Lima 2014). Most of the studies did not cite a published protocol, which is why we assessed a large proportion of studies to be at unclear risk of bias."
"Some secondary outcomes did not contain a majority of the children randomised in the review, and these results may be vulnerable to selective outcome reporting bias." Imdad et al. 2017, pp. 16, 23. - 76
Dr. West told us that "smaller trials not intended, designed, powered or executed to enable the efficacy of vitamin A on child mortality to be assessed are unlikely to be informative for this outcome." Keith West, email to GiveWell, February 25th, 2024.
- 77
"Comparing the 36 retinol-allocated versus 36 control blocks in analyses of the primary outcome, deaths per child-care centre at ages 1.0–6.0 years during the 5-year study were 3.01 retinol versus 3.15 control (absolute reduction 0.14 [SE 0.11], mortality ratio 0.96, 95% CI 0.89–1.03, p=0.22), suggesting absolute risks of death between ages 1.0 and 6.0 years of approximately 2.5% retinol versus 2.6% control." Awasthi et al. 2013a, abstract.
- 78
"Trials assigned approximately 1,223,856 participants, with sample sizes ranging between 35 participants in Van Agtmaal 1988 to approximately 1 million participants in DEVTA trial 2013." Imdad et al. 2017, p. 12.
Source that DEVTA was the largest randomized trial ever conducted (as of 2010): Imdad et al. 2010, p. 15.
"DEVTA is the largest randomised controlled trial ever conducted, including approximately one million children. That is, the trial included four times the combined participants of all included studies in this review."
Note that DEVTA was randomized at the administrative block level. This limits the statistical power of the study to some extent.
"Participants in this cluster-randomised trial were pre-school children in the defined catchment areas of
8338 state-staffed village child-care centres (under-5 population 1 million) in 72 administrative blocks. Groups of four
neighbouring blocks (clusters) were cluster-randomly allocated in Oxford, UK, between 6-monthly vitamin A (retinol
capsule of 200 000 IU retinyl acetate in oil, to be cut and dripped into the child’s mouth every 6 months), albendazole
(400 mg tablet every 6 months), both, or neither (open control). Analyses of retinol effects are by block (36 vs 36 clusters)." Awasthi et al. 2013a, abstract. - 79
"Participants in this cluster-randomised trial were pre-school children in the defined catchment areas of
8338 state-staffed village child-care centres (under-5 population 1 million) in 72 administrative blocks. Groups of four
neighbouring blocks (clusters) were cluster-randomly allocated in Oxford, UK, between 6-monthly vitamin A (retinol
capsule of 200 000 IU retinyl acetate in oil, to be cut and dripped into the child’s mouth every 6 months), albendazole
(400 mg tablet every 6 months), both, or neither (open control). Analyses of retinol effects are by block (36 vs 36 clusters). The study spanned 5 calendar years, with 11 6-monthly mass-treatment days for all children then aged 6–72 months."
"Within the participating blocks, the study population was all young children living in the defined catchment areas of 8338 village anganwadi child-care centres (AWCs; anganwadi means courtyard) that the ICDS regarded as functional (except in one block17) (figure 1). A typical rural AWC employs an ICDS-funded AWC childcare worker and serves a village with a population of about 1000 (with 10–15% aged 1.0–6.0 years); large villages can have more AWCs. AWCs register about two thirds of the children of age 1.0–5.0 years (and one-third of 5-year-olds) for possible nutritional supplementation."
"When treatment became due (in April or October), in each treatment-allocated block a mass-treatment day was selected on which all children of apparent age 6–72 months in all study AWCs in that block would be given the trial treatment by their AWC worker. Those treated were checked off on the AWC lists, and the few children missed were often found by the AWC worker and treated soon afterwards." Awasthi et al. 2013a, abstract, p. 1470.
"UP is an ideal setting for this study, because government programmes have already been instituted that should be able to supply food supplements and micronutrients to preschool children. The study will use this infrastructure (the anganwady system) to deliver deworming medicine and vitamin A to children in those blocks randomly allocated to one and/or other active treatment. . . . The cost-effectiveness of mass treatments . . . depends not only on the costs and effectiveness of the drugs themselves, but also on the practicability of delivering them to children reliably and sustainably at low additional cost. Both of these important questions will be addressed." Awasthi et al. 2013a Appendix, p. 2. - 80
The absolute risk of death from age 1-6 years in DEVTA's control group was 2.64%: Awasthi et al. 2013a, p. 1474. This implies a mortality rate of 5.3 per 1,000 child-years.
- Calculation: The 2.64% risk of death over a five year period (ages 1-6) equates to an average annual mortality rate of 0.53% (2.64 / 5). This 0.53 deaths per 100 children per year is equivalent to 5.3 deaths per 1000 child-years (0.53 x 10).
- 81
We selected these studies for comparison because, together with DEVTA, they account for approximately 90% of the statistical weight for the all-cause mortality analysis in the fixed-effects analysis, and around 60% of the weight in the random-effects analysis (see this section for a discussion of the difference between the analyses and how we interpret them).
Meta-analysis weights for the fixed-effects analysis are in Imdad et al. 2017, Analysis 1.1, p. 90. The weights for each study are:- DEVTA: 61.7%
- Ross et al. 1993 (SURVIVAL): 9.85%
- West et al. 1993: 6.44%
- Herrera et al. 1992: 5%
- Daulaire et al. 1992: 3.81%
- Sommer et al. 1986: 3.58%
These weights sum to 90.38%.
Meta-analysis weights from the random-effects analysis are available here:- DEVTA: 13.6%
- Ross et al. 1993 (SURVIVAL): 11.5%
- West et al. 1993: 10.5%
- Herrera et al. 1992: 9.8%
- Daulaire et al. 1992: 8.9%
- Sommer et al. 1986: 8.7%
These weights sum to 63%.
- 82
Mortality risk ratios for each study are available in Imdad et al. 2017, Analysis 1.1, p. 90.
- 83
Our understanding is that VAS was administered to children aged 6-72 months in the treatment group, but that mortality (the primary outcome) was measured for children aged 12-72 months only.
"When treatment became due (in April or October), in each treatment-allocated block a mass-treatment day was selected on which all children of apparent age 6–72 months in all study AWCs in that block would be given the trial treatment by their AWC worker. Those treated were checked off on the AWC lists, and the few children missed were often found by the AWC worker and treated soon afterwards."
"Table 2 shows the findings for child mortality at ages 1.0–2.9 years, 3.0–6.0 years, and 1.0–6.0 years, along with the relative risk for the age range 1.0–6.0 years. Deaths per child-care centre at ages 1.0–6.0 years during the 5-year study (the primary trial endpoint) were 3.01 retinol versus 3.15 control (absolute reduction 0.14 [SE 0.11], mortality rate ratio [RR] 0.96, 95% CI 0.89–1.03, p=0.22), suggesting absolute risks of death between ages 1.0 and 6.0 years of approximately 2.5% retinol versus 2.6% control." Awasthi et al. 2013a, pp. 1470, 1473. - 84
"Of 118 administrative blocks in the seven DEVTA districts in north India, 46 with many AWCs not functioning in 1998 were not included. 72 blocks remained; parts of each of them became the study areas." Awasthi et al. 2013a, p. 1470.
- 85
The absolute risk of death from age 1-6 years in DEVTA's control group was 2.64%: Awasthi et al. 2013a, p. 1474. This implies a mortality rate of 5.3 per 1,000 child-years.
- Calculation: The 2.64% risk of death over a five year period (ages 1-6) equates to an average annual mortality rate of 0.53% (2.64 / 5). This 0.53 deaths per 100 children per year is equivalent to 5.3 deaths per 1000 child-years (0.53 x 10).
- 86
"The Survival Study included 21 906 children aged 6-90 months in 185 geographical clusters, who were followed for up to 26 months." Ross et al. 1993, abstract.
- 87
"The trials took place in the guinea savannah area of Ghana in theKassena-Nankana District, on the border with Burkina Faso (figure 1)." Ross et al. 1993, p. 7.
- 88
We note that the control group all-cause mortality rate is given as 29.9 per 1,000 child-years in the original paper. We estimate 29.5 per 1,000 child-years by dividing the overall number of control group deaths (495) by the number of years of follow-up (16,779). We’re unsure why there is a discrepancy between these two estimates, but have not investigated further because the difference is so small. "The 21906 children who entered the Survival Study were followed up for 33 287 child-years (16 508 vitamin A group, 16 779 placebo group)...There were 892 deaths among the children in the Survival Study, which gave an overall mean mortality rate for all clusters of 27.11 per 1,000 child-years of follow-up. 397 of the deaths were in vitamin A clusters (mean mortality rate 24.4 per 1000 child-years) and 495 in placebo clusters (29.9 per 1000 child-years). " Ross et al. 1993, p. 10.
- 89
"Community trials of the efficacy of vitamin A supplementation in reducing preschool childhood mortality have produced conflicting results. To resolve the question, a randomised, double-masked, placebo-controlled community trial of 28 630 children aged 6-72 months was carried out in rural Nepal, an area representative of the Gangetic flood plain of South Asia." West et al. 1991, abstract.
- 90
"A randomised, double-masked, placebo-controlled vitamin A supplementation trial was carried out from September, 1989, to December, 1990, in the rural, plains (Terai) district of Sarlahi. This area was selected because it has endemic vitamin A deficiency, no previous vitamin A supplementation programme, and ecological, cultural, and demographic similarities to the Gangetic floodplain communities of South Asia, with which it is continuous; the factor enhances the general applicability of the findings." West et al. 1991, p. 67.
- 91
West et al. 1991, Table III, p. 68.
- 92
"Previous studies of the effect of 6-monthly vitamin A supplementation on child mortality have given conflicting results. In other trials, more frequent doses of vitamin A have significantly reduced mortality among children at risk of vitamin A deficiency. We have done a double-blind, placebo-controlled trial of vitamin A supplementation in the Sudan among 28 753 children aged 9-72 months at risk of vitamin A deficiency." Herrera et al. 1992, abstract.
- 93
"The study was conducted between June, 1988, and December,1990, among children between 9 and 72 months of age in five rural councils in northern Sudan where vitamin A deficiency was present." Herrera et al. 1992, p. 267.
- 94
"During the 18 months of follow-up, there were 120 deaths (8.4/1000) in the vitamin A group and 112 deaths (7.9/1000) [in the control group]." Herrera et al. 1992, p. 269.
Calculation: In the control group there were 7.9 deaths/1,000 children over a course of 18 months. To calculate the deaths per 1,000 child years, we multiply that number by 2/3. 7.9 x 2/3 = 5.3. - 95
"SUBJECTS--All children aged under 5 years; 3786 in eight subdistricts given single dose of vitamin A and 3411 in remaining eight subdistricts given no supplementation."
"Risk of death for children aged 1-59 months in supplemented communities was 26% lower (relative risk 0.74, 95% confidence interval 0.55 to 0.99) than in unsupplemented communities." Daulaire et al. 1992, abstract. - 96
"Setting-Jumla district, Nepal." Daulaire et al. 1992, abstract.
- 97
Daulaire et al. 1992, Table III, p. 208.
- 98
The age profile of the children in Sommer et al. is not completely clear. The study targeted children aged 12 - 71 months, and this is the group whose outcomes are reported in the study abstract. However, mortality data is also recorded for younger children (aged 0 - 11 months) and the effect size calculation reported in Imdad et al. 2017 appears to include this group. For consistency, we use the figures reported in Imdad et al.
"5 939 preschool children were examined at baseline and again 11 to 13 months later. Capsules containing 200 000 IU vitamin A were distributed to preschool children aged over 1 year by local volunteers 1 to 3 months after baseline enumeration and again 6 months later. Among children aged 12-71 months at baseline,mortality in control villages (75/10 231, 7.3 per 1000) was 49% greater than in those where supplements were given (53/10 919,4.9 per 1000) (p<0.05)." Sommer et al. 1986, abstract.
"Vitamin A was not intended to have been distributed to children under the age of 12 months, but it would appear that some 0-12 month-old children received the vitamin A capsule. Outcome data were reported on a cohort of 0-12 month-old children." Imdad et al. 2017, p. 80. - 99
"The study was carried out in Aceh Province, which is at the northern tip of Sumatra and where xerophthalmia is prevalent." Sommer et al. 1986, p. 1169.
- 100
This figure represents the control group mortality rate for children aged 0 - 71 months, not children aged 12 - 71 months only (the main analysis reported in Sommer et al. 1986). Sommer et al. 1986, Table VI, p. 1171.
- 101
The primary analysis in Imdad et al. reports a risk ratio of 0.73 for Sommer et al. 1986. Risk ratios are reported in reverse in Sommer et al. 1986 (i.e., the ratio is reported as the control groups’ mortality relative to the treatment group), but our understanding is that this value corresponds to the risk ratio for children aged 0 - 11 months. Imdad et al. 2017, Analysis 1.1, p. 90; Sommer et al. 1986, Table VI, p. 1171.
- 102
We currently estimate that 80% of the impact of VAS on child mortality is expressed through reduced diarrhea and measles mortality, and 20% of the impact is expressed through other mechanisms. See this section for further details.
- 103
- Decline in diarrhea mortality. "Mortality from diarrhoea has declined over the past two decades from an estimated 5 million deaths among children under five to 1.5 million deaths in 2004,7 which parallels downward trends in overall under-five mortality during this period." UNICEF/WHO, Diarrhoea: Why children are still dying and what can be done, 2009, p. 5. We have not vetted this study but do believe the result that deaths from diarrhea have declined.
- Decline in measles mortality. "In 1980, before widespread global use of measles vaccine, an estimated 2.6 million measles deaths occurred worldwide. . . . [T]he estimated number of annual measles deaths worldwide decreased from 733,000 in 2000 to 164,000 in 2008." CDC, Morbidity and Mortality Weekly Report, "Progress in Global Measles Control, 2000-2010," 2012, p. 73. We have not vetted this study but do believe the result that deaths from measles have declined.
- 104
Awasthi et al. 2013a, p. 1472.
- 105
- Ross et al. 1993: the mean daily prevalence of measles and diarrhea in the placebo group from were 0.1% and 15.9% respectively.
- West et al. 1991: About 5.5% of children had measles during the four months preceding the study and 11% of children had diarrhea during the week preceding the study.
- Herrera et al. 1992: 0.3% of children had measles in the seven days preceding the study and just over 17% had diarrhea in the seven days preceding the study.
- Sommer et al. 1986: about 22% of children had measles at any time in the past and about 7.9% of children had diarrhea in the seven days before the study.
Because of the differing time periods covered, these data are not directly comparable to prevalence rates among DEVTA participants, but they seem to suggest reasonably similar overall levels of illness.
Ross et al. 1993, p. 10, Table 1; West et al. 1991, p. 68, Table I; Herrera et al. 1992, p. 269, Table I; Sommer et al. 1986, p. 1170, Table III. - 106
The earliest available GBD estimates are from 1990. Some of the trials were conducted before this, so we use the national-level estimates from the country where the trial was conducted as a proxy. This is a very rough method, increasing our overall uncertainty about this comparison.
- 107
For example, if a study was conducted in a region with higher or lower levels of mortality than the national average.
- 108
See this cell in our supplementary analysis.
- 109
See this cell in our supplementary analysis.
- 110
- "The second consideration might be overall mortality rates. Figure 5.3 portrays the relative effectiveness of vitamin A supplementation in relation to control group mortality rates (a poor proxy for baseline mortality rate). No particular relationship is apparent and none could be detected in statistical analyses involving a variety of models in which individual projects were weighted (see Technical Annex)." p. 67.
- See Figure 5.3, p. 68.
- 111
Note: the sample of children in DEVTA who were tested for VAD was a convenience sample (i.e., children were selected by workers non-randomly, normally depending on which children were registered with the anganwadi childcare center). This leaves open the possibility that the reported data is not representative of the overall study population. Our best guess is that this data collection process is more likely to underestimate than overestimate VAD (i.e., because the children selected were probably the easiest children to reach and therefore may have had different diets, access to healthcare, poverty levels, and overall health from the general population).
That said, our guess at the dynamics of the sampling bias could be mistaken, and we cannot entirely rule out the possibility that DEVTA’s participants had a lower incidence of VAD than participants in other studies. - 112
- DEVTA: Awasthi et al. 2013a, Table 1, p. 1472.
- All studies in Imdad et al. 2017: See this section of our 2019 analysis of VAD.
- 113
"Independently, enquiries a week after mass-treatment days about lists of named children from the mid-study census confirmed supplementation of 96% (133 602/138 966) of those registered with the AWC and 72% (80 048/111 227) of those not, largely independent of age (data not shown). Because two-thirds of under-5s and one-third of 5-year-olds were AWC-registered, overall compliance was about 86% (not 91%, as previously estimated)." Awasthi et al. 2013a, p. 1472.
- 114
See GiveWell, Coverage estimates from RCTs of vitamin A supplementation included in Imdad et al 2017 meta-analysis for a comparison.
- 115
- "The program was delivered very inexpensively compared with previous programs and it used existing centers and care providers. Limited investment in the implementation of the intervention (e.g. training and monitoring) may help explain the relatively poor result." GiveWell's non-verbatim summary of a conversation with Evan Mayo-Wilson, June 10, 2013.
- "Excluding donated drug, the total cost was US $100 000 per year (US$0.10 per child), but this expense was mostly for evaluating the intervention." Awasthi et al. 2013b (deworming), p. 1484.
- According to an account of an unpublished workshop on DEVTA, "DEVTA provided the anganwadi workers with less than half a day’s training." Sommer, West, and Martorell 2013, p. 591, citing a workshop on the DEVTA Study at Worcester College, Oxford, UK from Nov. 3-4, 2008; the workshop proceedings have not been published.
- "But this was neither a rigorously conducted nor acceptably executed efficacy trial: children were not enumerated, consented, formally enrolled, or carefully followed up for vital events, which is the reason there is no CONSORT diagram." Sommer, West, and Martorell 2013, p. 1
- "To achieve 96% coverage in Uttar Pradesh in children found in the anganwadi workers’ registries would have been an astonishing feat; covering 72% of children not found in the anganwadi workers’ registries seems even more improbable. In 2005–06, shortly after DEVTA ended, only 6.1% of children aged 6–59 months in Uttar Pradesh were reported to have received a vitamin A supplement in the previous 6 months according to results from the National Family Health Survey,2 a national household survey representative at national and state levels. The level of contact between anganwadi workers and children has historically been very low. Although 76% of children aged 0–71 months in 2005–06 lived in areas covered by an anganwadi worker, only 22% of children received any service from the anganwadi worker. Thus, it is hard to understand how DEVTA ramped up coverage to extremely high levels (and if it did, why so little of this effort was sustained)." Sommer, West, and Martorell 2013, p. 1.
- Note: some of the authors of DEVTA have challenged this interpretation of the National Family Health Survey. They note that DEVTA was delivered in only 7 of 70 districts in Uttar Pradesh and only 3% of the administrative blocks in the state. This may explain the discrepancy between the coverage figures from DEVTA and the results of the National Family Health Survey.
- "The reference implies that the DEVTA program did not achieve the compliance it had reported. However, DEVTA was completed in autumn 2004, a significant amount of time before the National Family Health Survey. Additionally, DEVTA operated in only 7 out the 70 districts in UP and provided VAS in only 3% of the blocks (sub-districts) in UP. Among those blocks, VAS was distributed only from ones that had functioning AWCs." GiveWell's non-verbatim summary of a conversation with Richard Peto and Simon Read, April 10, 2014, p. 8
- 116
"During the third study year, monitors abstracted from local records name, sex, age, and father’s name for all (just over 1 million) pre-school children in the study areas." Awasthi et al. 2013a, pp. 1470-71.
- 117
"Independently, enquiries a week after mass-treatment days about lists of named children from the mid-study census confirmed supplementation of 96% (133 602/138 966) of those registered with the AWC and 72% (80 048/111 227) of those not, largely independent of age (data not shown). Because two-thirds of under-5s and one-third of 5-year-olds were AWC-registered, overall compliance was about 86% (not 91%, as previously estimated18)." Awasthi et al. 2013a, p. 1472.
- 118
"Annually, Oxford randomly selected one AWC per block for fieldwork teams to survey 30 pre-school children (six per year of age) 1–5 months after a mass-treatment day, seeking from them blood and faecal samples. In practice, full information with complete assay results was obtained for about 24 children per block. The children surveyed were not randomly chosen and were often taken from AWC lists, hence mainly registered with the AWC. Caregivers were asked whether the previous mass treatment had been received (and, if so, whether any acute illness followed) and about recent (past 4 weeks) illnesses." Awasthi et al. 2013a, p. 1471.
- 119
"Consistent with this finding, the biomedical surveys of randomly chosen AWCs, which tended to over-sample AWC-registered children, found caregivers reporting 91% (2337/2581) had received retinol on the previous mass-treatment day." Awasthi et al. 2013a, p. 1472.
- 120
"Unannounced visits to a quarter of the AWCs in vitamin A blocks on or just after each mass-treatment day found 99% (10 925/11 090 visits) were distributing treatment." Awasthi et al. 2013a, p. 1472.
- 121
See the National Family Health Survey (NFHS-3) India 2005-06, table 9.19, p. 254. Note Sommer, West, and Martorell 2013 raise a similar point in their critique of DEVTA, but use an estimate of 22% for this figure. This figure is uncited and we’re not sure why there’s a discrepancy.
- 122
The methods used are reported as follows: "Independently, enquiries a week after mass-treatment days about lists of named children from the mid-study census confirmed supplementation of 96% (133 602/138 966) of those registered with the AWC and 72% (80 048/111 227) of those not, largely independent of age (data not shown). Because two-thirds of under-5s and one-third of 5-year-olds were AWC-registered, overall compliance was about 86% (not 91%, as previously estimated 18)." Awasthi et al. 2013a, p. 1472. We’re unsure from this description how coverage was measured.
- 123
"During the third study year, study monitors abstracted from local records name, sex, age, and father’s name for all (just over 1 million) pre-school children in the study areas." Awasthi et al. 2013b (deworming), p. 1480. Because the compliance data relied on the study to identify a sample, there is no compliance data from the first two years of DEVTA.
- 124
It is plausible that compliance could be lower during the earlier years of the study:
- In general, we would guess that distribution improves over time as workers and monitors become familiar with their roles.
- In the first years of the study, workers were unable to use the Census data to identify, locate, and treat children who were absent from mass treatment days. "Those treated were checked off on the AWC lists, and the few children missed were often found by the AWC worker and treated soon afterwards." Awasthi et al. 2013a, p. 1470.
This factor is unlikely to be very important because the mortality rate ratio during the first two years of the study (0.96) is the same as the mortality rate ratio from the last three years of the study. (0.96). Awasthi et al. 2013a, p. 1474. If DEVTA’s results were caused by lax procedures at the study’s start, we would expect to see a smaller effect in the first half of the study.
- 125
"Annually, Oxford randomly selected one AWC per block for fieldwork teams to survey 30 pre-school children (six per year of age) 1–5 months after a mass-treatment day, seeking from them blood and faecal samples. In practice, full information with complete assay results was obtained for about 24 children per block. The children surveyed were not randomly chosen and were often taken from AWC lists, hence mainly registered with the AWC. Caregivers were asked whether the previous mass treatment had been received (and, if so, whether any acute illness followed) and about recent (past 4 weeks) illnesses." Awasthi et al. 2013a, p. 1471.
- 126
Children in areas receiving VAS had higher levels of retinol, a lower prevalence of deficiency, and a lower prevalence of bitot’s spots (a potential precursor to blindness).
"Among 2581 versus 2584 children surveyed during the second half of the study, mean plasma retinol was one-sixth higher (0.72 [SE 0.01] vs 0.62 [0.01] μmol/L, increase 0.10 [SE 0.01] μmol/L) and the prevalence of severe deficiency was halved (retinol <0.35 μmol/L 6% vs 13%, decrease 7% [SE 1%]), as was that of Bitot's spots (1.4% vs 3.5%, decrease 2.1% [SE 0.7%])." Awasthi et al. 2013a, abstract. - 127
"Annually, Oxford randomly selected one AWC per block for fieldwork teams to survey 30 pre-school children (six per year of age) 1–5 months after a mass-treatment day, seeking from them blood and faecal samples. In practice, full information with complete assay results was obtained for about 24 children per block. The children surveyed were not randomly chosen and were often taken from AWC lists, hence mainly registered with the AWC. Caregivers were asked whether the previous mass treatment had been received (and, if so, whether any acute illness followed) and about recent (past 4 weeks) illnesses…
Consistent with this finding, the biomedical surveys of randomly chosen AWCs, which tended to over-sample AWC-registered children, found caregivers reporting 91% (2337/2581) had received retinol on the previous mass-treatment day…
…Retinol assays were available (only during the second half of the study) for 5165 children with complete information on all assays and questionnaire replies, 2581 in retinol-allocated versus 2584 in control blocks (table 1). Among them, mean retinol was 0.72 (SE 0.01) μmol/L versus 0.62 (0.01) μmol/L, a 16% increase (p<0.00001)." Awasthi et al. 2013a, pp. 1471-1473. - 128
Our rough estimate assumes:
- The overall effect size of non-DEVTA trials is 24% (the main reported effect from Imdad et al. 2010, an earlier version of the meta-analysis that excludes DEVTA).
- Coverage in non-DEVTA trials was around 87%.
This implies that for coverage alone to explain the difference between DEVTA and non-DEVTA trials, DEVTA coverage would need to be approximately 15% (4% / (24% / 87%)).
- 129
"However, the GiveWell document fails to consider the problem of ascertainment bias, which may be the most important concern if substantial mortality went unreported, as is likely the case given the data collection methods. Because of the small number of research staff members, the limited training of the child-care center staff, the small proportion of reported mortality that was confirmed, and the lack of study population enumeration data and population-based mortality assessment, the methods do not seem to be sufficiently rigorous for the results to be plausible (see, for example, comments by Sommer et al, 2013)." Kenneth Brown, Comments on GiveWell Vitamin A Supplementation cost-effectiveness analyses, 2023 (unpublished).
- 130
"But this was neither a rigorously conducted nor acceptably executed efficacy trial: children were not enumerated, consented, formally enrolled, or carefully followed up for vital events, which is the reason there is no CONSORT diagram." Sommer, West, and Martorell 2013, p. 1.
- 131
Deaths were recorded by 18 study monitors going village-to-village by motorcycle. Monitors were to visit all (~500) anganwadi children’s centers over the course of six months and visit and record all households where a child under age 10 had died in the previous year. These checks were conducted again by a different monitor six months later, and 5% of all villages were visited by supervisors as an additional check.
We would expect that this method would undercount deaths, since monitors are likely to have missed some households (particularly remote households). The number of monitors (18) relative to the study size (around one million children) makes this more likely.
"Deaths were recorded by 18 full-time motorcycle village-to-village monitors.17 Monitors covered four neighbouring blocks at a time, one in each treatment group, and within 6 months went to all (roughly 500) study AWCs in those blocks to identify and visit all households where in the past year a liveborn infant or child younger than 10 years had died, recording age (often given only approximately, so our analyses of mortality at 1–5 completed years of age include all deaths at recorded ages 1.0–6.0 years), sex, name, parental names, and (by simple verbal autopsy) likely cause." Awasthi et al. 2013a, p. 1471. - 132
"A fixed-effect meta-analysis provides a result that may be viewed as a ‘typical intervention effect’ from the studies included in the analysis. In order to calculate a confidence interval for a fixed-effect meta-analysis the assumption is usually made that the true effect of intervention (in both magnitude and direction) is the same value in every study (i.e. fixed across studies). This assumption implies that the observed differences among study results are due solely to the play of chance (i.e. that there is no statistical heterogeneity)." Deeks et al., Cochrane Handbook for Systematic Reviews of Interventions, section 10.10.4, "Incorporating heterogeneity into random-effects models." Accessed May 22nd, 2023.
- 133
The conventional choice is a normal distribution. According to Cochrane, one criticism of random-effects meta-analysis is that the shape of the distribution is not known, and there is no easy way to validate the choice of any particular distribution.
"The random-effects meta-analysis approach incorporates an assumption that the different studies are estimating different, yet related, intervention effects (DerSimonian and Laird 1986, Borenstein et al 2010). The approach allows us to address heterogeneity that cannot readily be explained by other factors. A random-effects meta-analysis model involves an assumption that the effects being estimated in the different studies follow some distribution. The model represents our lack of knowledge about why real, or apparent, intervention effects differ, by considering the differences as if they were random. The centre of the assumed distribution describes the average of the effects, while its width describes the degree of heterogeneity. The conventional choice of distribution is a normal distribution. It is difficult to establish the validity of any particular distributional assumption, and this is a common criticism of random-effects meta-analyses. The importance of the assumed shape for this distribution has not been widely studied." Deeks et al., Cochrane Handbook for Systematic Reviews of Interventions, section 10.10.4, "Incorporating heterogeneity into random-effects models." Accessed May 22nd, 2023. - 134
"A random-effects model provides a result that may be viewed as an ‘average intervention effect’, where this average is explicitly defined according to an assumed distribution of effects across studies. Instead of assuming that the intervention effects are the same, we assume that they follow (usually) a normal distribution. The assumption implies that the observed differences among study results are due to a combination of the play of chance and some genuine variation in the intervention effects." Deeks et al., Cochrane Handbook for Systematic Reviews of Interventions, section 10.10.4, "Incorporating heterogeneity into random-effects models." Accessed May 22nd, 2023.
- 135
DEVTA receives 61.7% of the weight in the fixed-effects analysis, and 13.6% of the weight in the random-effects analysis.
- Meta-analysis weights for the fixed-effects analysis are in Imdad et al. 2017, Analysis 1.1, p. 90.
- Meta-analysis weights from the random-effects analysis were derived from downloading the RevMan file published alongside Imdad et al. 2017, which can be found under the "Download data" link here.
- 136
See this row in our cost-effectiveness analysis.
- 137
"A random-effects model provides a result that may be viewed as an ‘average intervention effect’, where this average is explicitly defined according to an assumed distribution of effects across studies. Instead of assuming that the intervention effects are the same, we assume that they follow (usually) a normal distribution. The assumption implies that the observed differences among study results are due to a combination of the play of chance and some genuine variation in the intervention effects." Deeks et al., Cochrane Handbook for Systematic Reviews of Interventions, section 10.10.4, "Incorporating heterogeneity into random-effects models." Accessed May 22nd, 2023.
- 138
For summaries of the variation between studies, see:
- GiveWell, Vitamin A deficiency and vitamin A fortification [2019] for a comparison of locations, dates and vitamin A deficiency rates between studies.
- GiveWell, Round 1 VAS effect size estimate, 2024 for a comparison of dosages and treatment schedules between studies.
- Table 1 above for a comparison of baseline mortality rates in a sample of studies which receive high weight in the meta-analysis.
- 139
Note that this may be partially offset by a reduction in our internal validity adjustment (one component of which assesses what proportion of the mortality reduction in Imdad et al. 2017 can be explained by reductions in measles and diarrhea). See this section for further details on how this adjustment works.
- 140
See this row of our cost-effectiveness analysis for our calculation.
- 141
- Most studies did not report how coverage was measured or how coverage data was collected (see this column of our coverage estimates analysis for details by study). We would guess that in many studies this data was based on self-reports from caregivers. This kind of data is at risk of being inflated by social desirability bias (survey respondents being more likely to overreport "good" behaviors). This implies we could be overestimating coverage (and therefore underestimating the impact of VAS on children who are treated).
- This adjustment assumes that the findings reported in Imdad et al. 2017 are "intention-to-treat" estimates (including all children originally allocated to receive the intervention) rather than "per-protocol" estimates (including only children who actually received VAS). Imdad et al. does not report which type of analysis was used for each study. We assume that most of the effects included in Imdad et al. 2017 are intention-to-treat estimates because these are the most common estimates of interest according to the Cochrane Handbook, but we have not reviewed the underlying studies in detail to confirm this.
- "The effect of interest in any particular analysis of a randomized trial is usually either the effect of assignment to intervention (the ‘intention-to-treat’ effect) or the effect of adhering to intervention (the ‘per-protocol’ effect). These effects are discussed in Chapter 8, Section 8.2.2. The data collected for inclusion in a systematic review, and the computations performed to produce effect estimates, will differ according to the effect of interest to the review authors. Most often in Cochrane Reviews the effect of interest will be the effect of assignment to intervention, for which an intention-to-treat analysis will be sought. Most of this chapter relates to this situation. However, specific analyses that have estimated the effect of adherence to intervention may be encountered." Higgins et al., Cochrane Handbook for Systematic Reviews of Interventions, "Chapter 6: Choosing effect measures and computing estimates of effect." Accessed August 16th, 2023.
- This conversion does not take possible spillover effects into account (i.e., people who don’t receive VAS may nonetheless gain some protection from VAS campaigns, if VAS reduces overall transmission of infectious diseases). Imdad et al. reports that VAS reduces incidence of some infectious diseases (diarrhea and measles), so it may be that we should expect spillover effects, but we haven’t investigated this question in detail. If there were spillover effects, this could affect our estimates in two ways:
- Spillovers to the control group, which could lead us to underestimate the effect of VAS. Our current adjustment assumes that children in the control group got no benefit. If there were spillovers to the control group, we would be underestimating the benefit of VAS. All of the top five most highly weighted trials in the meta-analysis were cluster RCTs that randomized entire communities for treatment, rather than individuals, and so we’d expect this to be unlikely (we haven’t checked for all RCTs in the meta-analysis).
- Spillovers to children who did not receive VAS in the treatment group, which could lead us to over- or underestimate the effect of VAS. Our conversion implicitly assumes that children in the treatment group who did not receive VAS received no benefit, and all the benefits of VAS were concentrated among the children who did receive VAS. In fact, some children who did not receive VAS may have received benefits through reduced disease transmission. We would expect this not to bias our results if coverage of VAS was similar between trial contexts and contemporary VAS programs (because the conversion doesn’t affect the overall benefit of VAS, just how it is allocated between children who do and don’t receive VAS). But the conversion could yield inaccurate estimates of the impact of VAS if coverage rates differed significantly between trial contexts and contemporary VAS campaigns (due to varying transmission patterns). We’re unsure whether this would positively or negatively update our analysis.
- 142
See this row in our cost-effectiveness analysis.
- 143
The meta-analysis finds that VAS reduces mortality by 24%, compared to 17% for a Cochrane meta-analysis of insecticide-treated nets (one of GiveWell’s other top recommended programs as of February 2024) and 14% for Azithromycin. See this row in our supplementary analysis for further details. While this is not evidence in and of itself that the VAS estimate is too high, it did contribute to us wanting to conduct sense checks.
- 144
See this section of the report for details on how we reach this estimate.
- 145
We think that 59% of children in the underlying studies were VAD, the impact on mortality was 24%, 87% of children in the underlying studies received VAS, and we roughly guess that the mortality impact of VAS was only ⅓ as large for children without VAD. (24% / 87%) / (59% + ((100% - 59%) x 33%)) = ~38%. See this section of our supplementary analysis for this calculation.
- 146
We think that 59% of children in the underlying studies were VAD, the impact on mortality was 24%, and 87% of children in the underlying studies received VAS. (24% / 87%) / 59% = ~47%. See this sheet of our supplementary analysis for rough calculations.
- 147
See this sheet of our supplementary analysis for more details. Studies with relative risks of approximately 1:
- Agarwal 1995: RR 1.22 [0.66, 2.25]
- Barreto 1994: RR 1.00 [0.14, 7.08]
- DEVTA trial 2013: RR 0.96 [0.89, 1.03]
- Herrera 1992: RR 1.06 [0.82, 1.37]
- Fisker 2014: RR 0.93 [0.66, 1.31]
- Vijayaraghavan 1990: RR 1.02 [0.57, 1.82]
- 148
Dr. Meager is an Associate Professor at the University of New South Wales.
- 149
Dr. Więcek is the Director of WAW Statistical Consulting, and Consulting Director at the Development Innovation Lab, University of Chicago.
- 150
This understanding is based on unpublished correspondence with Dr. Meager and Dr. Więcek. Our understanding is that this is still an interim analysis, and has not yet been published or peer reviewed. As a result, we do not report the authors’ updated estimate of the VAS effect on mortality, as we think it’s possible that this may change.
- 151
See Imdad et al. 2017, pp. 19-20. "To test for small study bias, we repeated the analysis using a random-effects model. The overall estimate was identical to the fixed-effect estimate, though the CI widened compared to the fixed effect model, suggesting that heterogeneity is not explained by small studies reporting larger effects (RR 0.84, 95% CI 0.73 to 0.98; 15 studies). See Table 1. The funnel plot we produced was dominated by two studies accounting for 74% of the overall effect (Figure 5), and the plot was relatively flat."
- 152
"In summary, the primary outcome was at low risk of bias, and the size and the significance of the effect cannot be explained by bias. While there was some evidence of small study bias for secondary outcomes, further research is unlikely to change the conclusion that VAS, delivered with high quality and coverage, prevents death among children aged 6 to 59 months in low- and middle-income countries." Imdad et. al. 2017, p. 23.
The full assessment of risks of bias for each trial is in Imdad et. al. 2017, pp. 14-16. - 153
See this row of our cost-effectiveness analysis. This range is based on the following locations: Burkina Faso, Cameroon, Côte d'Ivoire, DRC, Guinea, Mali, Madagascar, Niger, and five states in Nigeria: Adamawa, Benue, Ebonyi, Nasarawa, and Taraba (for Helen Keller) and Chad (for Nutrition International). We focus on these locations for the reasons discussed above.
- 154
We include this adjustment because we expect that these changes to be correlated to some extent and therefore we would risk "double penalizing" our adjustment by simply multiplying each adjustment together. See this section of the report for further discussion. See this row in our cost effectiveness analysis for this adjustment.
- 155
See this row in our cost-effectiveness analysis. This range is based on the following locations: Burkina Faso, Cameroon, Côte d'Ivoire, DRC, Guinea, Mali, Madagascar, Niger, and five states in Nigeria: Adamawa, Benue, Ebonyi, Nasarawa, and Taraba (for Helen Keller) and Chad (for Nutrition International). We focus on these locations for the reasons discussed above.
- 156
See this cell in our cost-effectiveness analysis, and this sheet in our supplementary analysis for our calculations.
- 157
We use the same random-effects weights we use for our main analysis of the impact of VAS. See this column in our supplementary analysis for these weights.
- 158
Where VAD prevalence (as measured by blood serum retinol concentration) data was not available, we used a combination of the following:
- Rates of xerophthalmia, if measured in the trial.
- Data on the most recent (as of 1995, close to the time of many of the trials) national-level surveys on serum retinol levels recorded in WHO, Global Prevalence of Vitamin A Deficiency, 1995.
- Regional-level (e.g., sub-Saharan Africa) estimates of the prevalence of VAD in 1991 (close to the time of many of the trials) in Stevens et al. 2015.
Of the 19 studies included in our analysis:
- Five studies reported data on baseline VAD rates (DEVTA, Dibley 1996, Donnen 1998, Ross et al. 1993 Health and Ross et al. 1993 Survival).
- Six studies reported data on baseline xerophthalmia (dry eyes, a symptom of VAD) rates, but not VAD itself (Agarwal 1995, Benn 1997, Daulaire 1992, Herrera 1992, Sommer 1986, and West 1991). Xerophthalmia is a clinical indicator of VAD and can be used to estimate deficiency (see WHO, Global prevalence of vitamin A deficiency in populations at risk 1995–2005, 2009, p. 2). We extrapolate the rates of xerophthalmia in these studies to VAD rates based on a very rough analysis of VAD rates from a 2015 study of VAD prevalence over time (Stevens et al. 2015).
- Seven studies do not report data on either xerophthalmia or VAD (Barreto 1994, Chowdhury 2002, Fisker 2014, Pant 1996, Rahmathullah 1990, Venkatarao 1996, and Vijayaraghavan 1990). In these cases we use estimates from either Stevens et al. 2015 or a 2009 WHO estimate of VAD in populations at risk, depending on which source provides an estimate closer to the country and year in question.
- One study (Lin 2008) receives no weight in the meta-analysis, so we exclude it from our estimate.
See these columns in our supplementary analysis for our reasoning in each case.
- 159
See this row of our analysis for location-specific values. This range is based on the following locations: Burkina Faso, Cameroon, Côte d'Ivoire, DRC, Guinea, Mali, Madagascar, Niger, and five states in Nigeria: Adamawa, Benue, Ebonyi, Nasarawa, and Taraba (for Helen Keller) and Chad (for Nutrition International). We focus on these locations for the reasons discussed above.
- 160
See this row in our cost-effectiveness analysis.
- 161
See this row in our cost-effectiveness analysis. The most recent survey dates for each country were: Burkina Faso (2010), Cameroon (2009), Côte d'Ivoire (2007), DRC (1999), Kenya (2011), Mali (1997), and Mozambique (2002).
- 162
Specifically, we assume that VAD rates fall by 1.33% per year between the date the survey was conducted and the date we conducted our analysis (2022). See this row of our cost-effectiveness analysis. This figure is based on the annualized rate of change in three measures that we think might be a proxy for VAD rates (stunting, acute malnutrition, and poverty) between national health surveys conducted in Nigeria in 2003 and 2018. We use estimates from Nigeria only and apply them to other countries because this adjustment is relatively small and have not yet prioritized it.
See this section of our separate analysis of VAD in Nigeria for further details. Note that we have not validated how far each of these proxy measures is correlated with VAD, and we assume that the rate of improving circumstances in other countries is the same as in the Nigeria data. We therefore think of this analysis as a rough and uncertain best guess. - 163
Reasons for our low confidence in the Global Burden of Disease Project state-level estimates of VAD in Nigeria:
- We investigated the state-level VAD estimates for Nigeria and found them to be implausibly low (2% to 4% in many states, see this spreadsheet).
- These low rates are in tension with what we would expect, based on other sources of information:
- They are considerably lower than VAD rates in other sub-Saharan African countries where Helen Keller and Nutrition International works (in the ~25% to 35% range in GBD 2017 - see this row of our cost-effectiveness analysis).
- They are considerably lower than the level recorded in the most recent nationally representative survey in Nigeria that we have found (30%). The survey was conducted in 2001, and while we might expect some fall in VAD over time, we think this fall is too dramatic to be plausible.
- We’re unsure what modeling changes were driving this update between GBD 2017 and GBD 2019.
- 164
Maziya-Dixon et al. 2006 is the most recent nationally representative VAD survey we are aware of, and was conducted in 2001.
- 165
These estimates are compiled in this section of the CEA. The 2018 Nigeria DHS survey is available here. For measures of poverty, we use the Nigerian Living Standards Survey (NLSS) estimates reported in the 2019 Poverty and Inequality in Nigeria Summary Report (available here, downloaded Feb 28th, 2022).
- 166
See these rows in our cost-effectiveness analysis for our location-specific weights.
Note that in Kenya, there are particularly large differences between VAD prevalence rates in the GBD estimates and the most recent national survey. The GBD 2017 estimate of VAD prevalence for 6-59 month olds is approximately 33%, compared to 9.2% in the Kenya 2011 national survey.
We conducted an in-depth review of the 2011 survey to investigate the reliability of the data. We found several potential issues with the survey data and methodology, but nothing to justify ignoring the data altogether. We therefore decided to assign 50/50 weight to each source.
See this document for further details on our reasoning and this column in our cost-effectiveness analysis for our calculations. - 167
See this row in our cost-effectiveness analysis. This range is based on the following locations: Burkina Faso, Cameroon, Côte d'Ivoire, DRC, Guinea, Mali, Madagascar, Niger, and five states in Nigeria: Adamawa, Benue, Ebonyi, Nasarawa, and Taraba (for Helen Keller) and Chad (for Nutrition International). We focus on these locations for the reasons discussed above.
- 168
See these rows in our cost-effectiveness analysis.
- 169
See this row in our cost-effectiveness analysis. This range is based on the following locations: Burkina Faso, Cameroon, Côte d'Ivoire, DRC, Guinea, Mali, Madagascar, Niger, and five states in Nigeria: Adamawa, Benue, Ebonyi, Nasarawa, and Taraba (for Helen Keller) and Chad (for Nutrition International). We focus on these locations for the reasons discussed above.
- 170
"The evidence I identified supports a substantial effect of VAS on mortality from diarrhea and measles, but does not support a substantial effect of VAS on other prominent infectious causes of mortality in under-five children in sub-Saharan Africa. Reasoning:
- Imdad et al. 2017 is a Cochrane meta-analysis that reports that mass VAS reduces diarrhea mortality (relative risk 0.88; 95% CI 0.75 to 0.98) and incidence (relative risk 0.85; 95% CI 0.82 to 0.87) in under-five children in RCTs. These estimates are statistically significant, have relatively tight confidence intervals, and were judged "high-quality" and "low-quality", respectively.
- Imdad et al. 2017 reports that mass VAS (non significantly) tends to reduce measles mortality (relative risk of 0.88; 95% CI 0.69 to 1.11) and greatly reduces measles incidence (relative risk of 0.50; 95% CI 0.37 to 0.67). These estimates were judged "low-quality" and "high-quality", respectively. Other meta-analyses of mass VAS are consistent with these estimates. In the meta-analysis Sudfeld et al. 2010, VAS tended to reduce measles morbidity in children already infected with measles (relative risk of 0.63; 95% CI 0.37 to 1.08) and reduced it quite substantially in the three trials that provided higher doses of vitamin A (relative risk of 0.38; 95% CI 0.18 to 0.81). Together with the fact that the evidence underlying the Imdad et al. 2017 mortality estimate is judged "low-quality", this suggests to me that mass VAS probably reduces measles mortality, and likely to a greater degree than Imdad et al. 2017 suggests. I favor a relative risk of 0.67 to 0.69, but this relies on uncertain judgment calls."
GiveWell, Disease-specific mortality effects of vitamin A supplementation, 2019, p. 2.
- 171
- "VAS probably does not meaningfully impact lower respiratory tract infection (pneumonia) mortality, but I do not believe this with high certainty. Evidence from meta-analyses of VAS RCTs appears consistent that VAS does not reduce LRTI mortality or incidence. The confidence interval in Imdad et al. 2017 is relatively tight (relative risk of 0.98; 95% CI 0.86 to 1.12), suggesting little room for a meaningful effect ("low-quality" evidence). In contrast to mortality, Imdad et al. 2017 reports that VAS may substantially reduce LRTI prevalence (relative risk of 0.60; 95% CI 0.45 to 0.81), and I am uncertain how to reconcile this with the mortality estimate. However, this latter estimate is based on only two trials, while the former is based on nine trials (both are dominated by DEVTA).
- I do not recommend including malaria mortality in our model, but I am uncertain about this due to a possible discrepancy between mortality and incidence/morbidity estimates. The most pertinent RCT did not identify an impact of VAS on malaria mortality (relative risk 1.03; 95% CI 0.74 to 1.43). However, Imdad et al. 2017 reports a significant reduction in malaria incidence (relative risk of 0.73; 95% CI 0.60 to 0.88; based on one trial), and of the three pertinent RCTs reporting malaria morbidity, one reports a significant reduction and another reports a nonsignificant reduction of a similar magnitude (the third, with very wide confidence intervals, reports a nonsignificant increase). An additional meta-analysis reports no significant impact of VAS on placental malaria risk in pregnant women (relative risk of 1.09; 95% CI 0.95 to 1.25; based on two trials). Overall, I believe the evidence weakly suggests that mass VAS probably does not substantially impact malaria mortality."
GiveWell, Disease-specific mortality effects of vitamin A supplementation, 2019, pp. 2-3.
- 172
- "I was unable to evaluate the impact of VAS on whooping cough incidence or mortality due to a lack of evidence.
- The evidence I encountered on VAS and tuberculosis was insufficient to evaluate whether VAS impacts tuberculosis mortality.
- I was unable to evaluate the impact of VAS on invasive non-typhoidal salmonella incidence or mortality due to a lack of evidence."
GiveWell, Disease-specific mortality effects of vitamin A supplementation, 2019, p. 3.
- 173
The review tentatively concludes: "I recommend two possible approaches for our external validity adjustment. Of these, I slightly prefer the second.
- Assume that VAS only impacts diarrhea and measles mortality.
- Assume that the mortality benefit of VAS is primarily expressed via diarrhea and measles mortality, but also has a small effect on overall infectious disease mortality (due to impacts on specific VAS-responsive infectious diseases that occur in sub-Saharan Africa but whose VAS-responsiveness I have not been able to identify here). I am uncertain how much to weight each cause, but 85 percent of weight on diarrhea and measles, and 15 percent of weight on everything else seems reasonable to me. This is in contrast to our current model, which weights each of these at 50 percent. I slightly favor this model because there are many possible infectious causes of death with insufficient evidence to determine how they are impacted by vitamin A status. It seems more likely than not that other infectious diseases may contribute to the mortality reduction effect of VAS to some degree."
GiveWell, Disease-specific mortality effects of vitamin A supplementation, 2019, p. 4.
Note that we have since updated our best guess of the relative contribution of diarrhea / measles and other infectious diseases from 85% / 15% to 80% / 20%. - 174
"I am slightly inclined to favor the latter approach because, with the many possible infectious causes of death it seems more likely than not that VAS reduces mortality from other less impactful diseases for which there is insufficient evidence to observe this effect. However, I am not certain which model is more accurate." GiveWell, Disease-specific mortality effects of vitamin A supplementation, 2019, p. 34.
- 175
See this section in our cost-effectiveness analysis.
- 176
See this sheet in our analysis of baseline mortality for our calculations. Note that:
- GBD data is only available beginning in 1990. We use data from 1990 for trials that took place before 1990.
- These estimates could be biased up or down if the studies took place in locations with better or worse child health than the national average.
- Our overall estimate is a weighted average, using the study weights in Imdad et al. 2017 (random-effects analysis).
- 177
See these rows in our cost-effectiveness analysis.
- 178
See these rows in our cost-effectiveness analysis.
- 179
See this row in our cost-effectiveness analysis. This range is based on the following locations: Burkina Faso, Cameroon, Côte d'Ivoire, DRC, Guinea, Mali, Madagascar, Niger, and five states in Nigeria: Adamawa, Benue, Ebonyi, Nasarawa, and Taraba (for Helen Keller) and Chad (for Nutrition International). We focus on these locations for the reasons discussed above.
- 180
Our current non-independence "gives back" 25% of any penalty for relative changes in causes of mortality (e.g., the -52% adjustment for changes in the causes of mortality in Guinea is effectively cut to -39%).
We don’t know how much we should expect falls in VAD and changes in the causes of child mortality to be correlated. The two possible extremes are:- The two changes are totally dependent. In this case, we would take their average for our adjustment (-52% + -53%) / 2 = -52.5%.
- The two changes are totally independent. In this case, we would take their product for our adjustment (100% - 52%) x (100% - 53%) - 100% = -78%.
We think of our 25% adjustment as a rough best guess. See this row in our cost-effectiveness analysis.
See these rows of our external validity analysis for further details on our reasoning and the specific calculation. - 181
DEVTA estimated a relative risk for the impact of VAS on mortality as 0.96, and Fisker et al. 2014 estimated a relative risk of 0.93 (more in our supplementary analysis here).
- DEVTA: We discuss our concerns about DEVTA in the section above.
- Fisker et al. 2014:
- Additional VAS campaigns were conducted during the trial, and so some children (in both treatment and control groups) received VAS more than once. We do not know what proportion of children this applies to, although we note that the number of person-years of observation falls by roughly half between the analysis conducted at 6 months and to the next VAS campaign, see figure 2. We expect that this would attenuate any measurable impact of receiving VAS relative to being in the control group.
- To account for this, the study authors conducted an analysis of mortality during only the first six months of the trial (although some children in the control group still received VAS in this period, and we’re unsure how many). The overall number of deaths in this period was low (80 non-accident deaths in total), so this analysis has low statistical power (95% CI 0.59 - 1.41).
"The unforeseen increased frequency of VAS campaigns posed analytical challenges. Information on campaign VAS was obtained during home visits and thus available only for surviving children. Using the information obtained during visits could introduce bias, and censoring all children at the date of a campaign severely reduced the follow-up time and compromised the power. Conducting follow-up to 12 months of age would mean that most children had received VAS twice during follow-up and this would lead to dilution of any effect of the intervention. Hence, we conducted 2 types of analyses. In the main analysis, we followed children for 6 months after enrollment, irrespective of subsequent VAS; this main analysis includes some follow-up time after campaign VAS which may have diluted the effect of the experimental treatment."
"Between August 2007 and November 2010, 7587 children were enrolled. Within 6 months of follow-up 80 nonaccident deaths occurred (VAS: 38; placebo: 42). The mortality rate ratio (MRR) comparing VAS versus placebo recipients was 0.91 (95% confidence interval 0.59-1.41) and differed significantly between boys (MRR 1.92 [0.98-3.75]) and girls (MRR 0.45 [0.24-0.87]) (P = .003 for interaction between VAS and gender)."
Fisker et al. 2014, e742, e739. - 182
See this column in our analysis of the estimated effect sizes in each trial.
- 183
We performed weighted regression using the study weights from the random-effects analysis of the Imdad et al. 2022 meta-analysis. The correlation between predicted and observed relative risk is negligible (p = 0.80, R2 = 0.004). This analysis is currently unpublished.
- 184
Supplementation intervals for each trial can be found here.
- 185
This analysis is currently unpublished.
- 186
Several experts have told us that the impact of VAS on vitamin A status lasts about two to four months, depending on how it is measured (serum retinol vs. the modified relative dose response test). This is substantially shorter than the typical supplementation interval of 6 months, suggesting that VAS does not sustain vitamin A levels for the entire 6-month period.
"It can also be helpful to wait a few months after supplementation has occurred to take measurements – for a serum retinol survey, for example, the effects of VAS fade within two months, so any survey conducted more than two months after supplementation should reflect the population’s serum retinol levels independent of the effect of vitamin A supplementation." Givewell's non-verbatim summary of a conversation with Dr. Sherry Tanumihardjo, March 26, 2018.
We have also heard from other (unpublished) expert conversations that the impact of VAS on vitamin A status is no longer detectable after six to eight weeks using retinol binding protein or serum retinol, and three to four months using modified relative dose response (more on methods for measuring VAD here).
This is also consistent with data from a large-scale supplementation campaign in the Philippines, that receipt of VAS is associated with a 21% relative reduction in vitamin A deficiency rates measured by serum retinol at 1-2 months after supplementation, a 14% relative reduction at 3-4 months, and no apparent reduction at 5-6 months (1.4%). This is calculated by dividing the rate of children with vitamin A deficiency in each post-supplementation category by the rate among children who did not receive VAS. Data are from table 2 of Pedro et al. 2004.
Pedro et al. 2004, table 2, p. 323. - 187
- A controlled, non-randomized trial of vitamin A fortification of monosodium glutamate in Indonesia reports a mortality RR of 0.55 in the 12-60 month age group. The paper reports the odds ratio for mortality, and this is statistically significant. To calculate RR, we use the mortality rate for intervention and control groups in table 6, and divide the former by the latter. 17 / 31 = 0.55.
The odds ratio for under-5 mortality in children 12-60 months is 1.87 [1.41, 2.48] (table 6). The denominator and numerator are reversed relative to how they are typically reported (the inverse is an OR of 0.53). We assume the finding would also be statistically significant if expressed as RR.
"Preschool children in control villages died at 1.8 times the rate of children in program villages." Muhilal et al. 1988, abstract.- One of the VAS trials included in the Imdad et al. 2022 meta-analysis has a nutrition education arm intended to increase vitamin A intake (excluded from the meta-analysis because it was not a VAS intervention). The trial reports a large reduction in under-5 mortality (RR 0.64; 95% Cl 0.48-0.86). "The risk of mortality at 2 years was reduced for both the nutrition education (RR = 0.64; 95% Cl = 0.48-0.86) and capsule distribution (RR = 0.57; 95% CI = 0.42-0.77) cohorts." Pant et al. 1996, abstract.
- 188
This analysis is currently unpublished.
- 189
This understanding is based on conversations with Dr. Sherry Tanumihardjo, a researcher specializing in vitamin A.
"Serum retinol concentration, measured in blood samples, is the most commonly used vitamin A status biomarker. When serum retinol concentrations are below 0.7 μmol/L, individuals are considered to be vitamin A deficient, but the World Health Organization recommends that another biomarker be used to confirm deficiency. Concentrations of retinol-binding protein (RBP) are sometimes used as a proxy for serum retinol concentrations, because tests measuring RBP are less expensive and easier to implement than serum retinol tests. But unlike serum retinol, there is not a commonly accepted deficiency cutoff for measures of RBP and it may differ depending on the assay used."
"Serum retinol and RBP both have limitations as biomarkers for indicating vitamin A status:- Both of these biomarkers are responsive to inflammation, such that a low level of the biomarker could indicate either VAD or an acute phase response to infection. It may be more accurate to think of serum retinol and RBP as biomarkers of inflammation rather than of VAD.
- In the beginning stages of VAD, levels of serum retinol and RBP may increase as the body attempts to "recycle" vitamin A.
The results of surveys of serum retinol or RBP are sometimes adjusted to account for inflammation. If no adjustments are used, serum retinol and RBP surveys would likely overestimate the prevalence of vitamin A deficiency, because some individuals' concentrations of serum retinol or RBP would be low due to inflammation, rather than chronic low vitamin A intake." GiveWell's non-verbatim summary of conversations with Dr. Sherry Tanumihardjo, October 17 and 27, 2017, p. 2.
- 190
"A better measure of VAD to use going forward would be the modified relative dose response (MRDR) test, because it is not as sensitive to inflammation." GiveWell's non-verbatim summary of conversations with Dr. Sherry Tanumihardjo, October 17 and 27, 2017, p. 2.
- 191
See the highlighted cells of this column in our supplementary analysis for these studies.
- 192
Dr. West told us that "no single indicator is ideal for all purposes. MRDR has become a gold standard for indirectly estimating liver vitamin A stores, but requires repeat visits, can be costly and less available, while a serum retinol distribution, when low as measured in labs throughout the world, reflects a vitamin A-stressed population likely to experience improved health, and perhaps survival, following vitamin A intervention." Keith West, email to GiveWell, February 19th 2024.
- 193
For details of these methods (accurate as of GBD 2017, see GiveWell's non-verbatim summary of a conversation with the Institute for Health Metrics and Evaluation, April 5, 2019, p. 2.
"WHO collects results from VAD surveys in its Vitamin and Mineral Nutrition Information System (VMNIS). IHME uses these results, along with additional survey results from Demographic and Health Surveys (DHS) and other sources, as inputs for its VAD prevalence estimations. For many countries, there is either no VAD survey data available or the available data is more than 10 years old. To estimate VAD prevalence for countries and years without available survey data, IHME uses the following covariates in a predictive model (all of which are inversely related to VAD prevalence):- VAS coverage – IHME uses UNICEF data on the proportion of targeted populations of preschool-aged children that receive vitamin A supplements.
- Socio-demographic Index (SDI) – IHME developed SDI as a composite of income levels, educational attainment, and fertility rates.
- Vitamin A availability in food – In collaboration with the Food and Agriculture Organization of the United Nations, IHME developed a global database (encompassing all 195 GBD countries) for the availability of 170 different nutrients. In its model of VAD prevalence, IHME treats vitamin A availability in national food supplies as a proxy for vitamin A consumption, but it does not account for consumption of vitamin A fortified foods—fortification data is often either unavailable or incomplete."
- 194
This page includes a description of the changes in modeling assumptions between GBD 2017 and GBD 2019 for VAD. We don't have a full understanding of why these modeling changes led to such big shifts in VAD prevalence estimates.
- 195
"In collaboration with the Food and Agriculture Organization of the United Nations, IHME developed a global database (encompassing all 195 GBD countries) for the availability of 170 different nutrients. In its model of VAD prevalence, IHME treats vitamin A availability in national food supplies as a proxy for vitamin A consumption, but it does not account for consumption of vitamin A fortified foods—fortification data is often either unavailable or incomplete." GiveWell's non-verbatim summary of a conversation with the Institute for Health Metrics and Evaluation, April 5, 2019, p. 2.
- 196
"For many countries, there is either no VAD survey data available or the available data is more than 10 years old. To estimate VAD prevalence for countries and years without available survey data, IHME uses the following covariates in a predictive model (all of which are inversely related to VAD prevalence):
- VAS coverage – IHME uses UNICEF data on the proportion of targeted populations of preschool-aged children that receive vitamin A supplements.
- Socio-demographic Index (SDI) – IHME developed SDI as a composite of income levels, educational attainment, and fertility rates.
- Vitamin A availability in food – In collaboration with the Food and Agriculture Organization of the United Nations, IHME developed a global database (encompassing all 195 GBD countries) for the availability of 170 different nutrients. In its model of VAD prevalence, IHME treats vitamin A availability in national food supplies as a proxy for vitamin A consumption, but it does not account for consumption of vitamin A fortified foods—fortification data is often either unavailable or incomplete." GiveWell's non-verbatim summary of a conversation with the Institute for Health Metrics and Evaluation, April 5, 2019, p. 2.
- 197
We currently do include an adjustment like this for our estimates of child mortality, but not for VAD. See the discussion above for further details.
- 198
Note: one reason to believe that this may not lead to significantly different estimates of VAD is that measures of serum retinol or retinol-binding protein, the main biomarkers used to evaluate VAD, do not appear to be very responsive to VAS. Instead, our understanding is that these biomarkers are more responsive to dietary intake of vitamin A.
"Serum retinol distribution curves are used to evaluate program impact (111). However, the lack of change in serum retinol distribution over time in several countries that have sustained >70% coverage with vitamin A supplementation has raised the concern about the appropriate indicator (219). For this reason, the impact of supplementation programs is not measured by a change in the prevalence of low serum retinol concentrations but may be better served by evaluating coverage rates. Retinol concentrations may respond to sustained, improved dietary intakes and therefore can guide programmatic decisions about whether to maintain or change interventions (219). Thus, the use of serum retinol distributions among preschool children from cross-sectional surveys to assess the need for vitamin A interventions is still recommended." Tanumihardjo et al. 2016, pp. 16S-17S.
"There is a growing interest in measuring the impact of VA programs in countries that have implemented national-scale programs for several years. Serum retinol concentrations do not respond to VAS, except in a transient manner (ie, for 1-2 months). While the kinetics of this transient effect have not been well characterized, it presumably reflects the rapid use of VA to support its biological functions when background dietary intake is low and/or VA losses resulting from infections. Serum retinol concentration is therefore not recommended as an impact indicator where VAS is the only strategy for addressing VAD. For this reason, the impact of VAS programs is not measured by a change in VAD prevalence in the population, and the mortality impact is instead modeled using coverage data. Serum retinol concentrations are, however, responsive to improved dietary intakes, sustained over time, and therefore can guide programmatic decisions about whether to maintain or change intervention mixes. Thus, using serum retinol distributions among preschool-aged children— in conjunction with other vitamin A status markers or demographic/ecologic risk factors—from cross-sectional surveys to assess the need for VA interventions is still recommended, even in countries that have sustained high semiannual VAS coverage over several years." Klemm et al. 2016, pp. 5-6. - 199
See this row of our cost-effectiveness analysis. The most recent survey dates for each country were: Burkina Faso (2010), Cameroon (2009), Côte d'Ivoire (2007), DRC (1999), Kenya (2011), Mali (1997), and Mozambique (2002).
- 200
See this cell in our cost-effectiveness analysis and the section above for a discussion of this adjustment.
- 201
Stevens et al. 2015, table 1, e531.
- 202
See this spreadsheet for this list of surveys included in Stevens et al. 2015.
- 203
The surveys produced estimates of 17% in Sierra Leone, 4% in Malawi, and 21% in Ghana. See this column in our 2019 analysis.
- 204
See Wirth et al. 2017, pp. 6-7, for a list of countries in which biofortified crop programs have been implemented.
- 205
See this column in our 2019 analysis for details.
- 206
- "We conducted representative surveys in Yaoundé and Douala, Cameroon, 2 years before and 1 year after the introduction of a mandatory national program to fortify cooking oil with VA. In each survey, 10 different households were selected within each of the same 30 clusters (n = ~300). Malaria infection and plasma indicators of inflammation and VA (retinol-binding protein, pRBP) status were assessed among women aged 15–49 years and children aged 12–59 months, and casual breast milk samples were collected for VA and fat measurements. Refined oil intake was measured by a food frequency questionnaire, and VA was measured in household oil samples post-fortification." Engle-Stone et al. 2017, p. 1.
- Adjusted prevalence of VAD among preschool-aged children (26.6%) and unadjusted prevalence of VAD among preschool-aged children (41.2%) in 2012 reported in Engle-Stone et al. 2017, p. 10, Table 4.
- Differences between 2009 and 2012 surveys of VAD prevalence and mean RBP among preschool-aged children were not statistically significant.
- 207
"There is likely a threshold of VAD prevalence below which VAS is unlikely to have much impact on mortality. If there is high-quality data showing low VAD in a region, Helen Keller thinks it is reasonable not to expect VAS to have a mortality impact there.
"Organizations in the Global Alliance for Vitamin A (GAVA) currently use 10% VAD as the threshold at or above which VAS programs ought to be maintained in a region. The World Health Organization (WHO) classifies VAD rates of 20% or greater among preschool-aged children as a serious public health problem. VAD rates of less than 5% are accepted as not much of a concern.
"Despite a lack of recent micronutrient analyses in many African countries, HKI is confident that VAD is prevalent enough in many places for VAS to remain an impactful intervention. For instance, while HKI is not aware of any recent micronutrient deficiency data in Mali, it would be surprising if VAD were not prevalent there, given Mali's child mortality and malnutrition rates." GiveWell's non-verbatim summary of a conversation with Helen Keller Intl, June 1, 2017, p. 2. - 208
"Despite the lack of data, Dr. Tanumihardjo thinks it is unlikely that oil fortification programs across sub-Saharan Africa are working well enough to render VAS programs unnecessary in most countries, given that many of the oil fortification programs are relatively new. Over the next few years, we may gain enough data on rates of VAD to make an informed decision about whether to continue or scale back VAS programs. If there were strong evidence that a country's vitamin A fortification program was effectively fortifying food and reaching target populations, it may be appropriate to scale back the programs. Dr. Tanumihardjo thinks it would be premature to start scaling back VAS programs before we have these data." GiveWell's non-verbatim summary of conversations with Sherry Tanumihardjo, October 17 and 27, 2017, p. 2.
- 209
This estimate factored in some expected reduction in deficiency rates due to fortification, although we were very unsure about the magnitude of this because of the limited evidence available. See this column in our 2018 analysis.
- 210
In 2019, following a conversation with the Institute for Health Metrics and Evaluation (IHME), we decided to instead use VAD prevalence estimates from its GBD project instead of our previous estimates. These were higher than our previous estimates (see this column for our 2019 estimates, and this column for our 2018 estimates). We guessed that IHME's estimates of the prevalence of VAD are more likely to be accurate than our subjective best-guesses, but a significant weakness was that IHME told us that its model does not take vitamin A food fortification into account.
- 211
To understand how the variation in the external validity adjustment affects each location’s cost-effectiveness, we put together a undefinedrough sensitivity analysis. We found that cost-effectiveness is sensitive to the external validity adjustment:
- All locations we analyzed were near or above our cost-effectiveness bar (10x or more as cost-effective as direct cash transfers at the time of writing) when each location’s external validity adjustment was set to the smallest adjustment we estimate across countries (-41% in Madagascar). See this row in our sensitivity analysis.
- All locations but two fell below our cost-effectiveness bar when each location’s external validity adjustment was set to the largest adjustment we estimate across countries (-88% in Anambra state, Nigeria). See undefinedthis row of our sensitivity analysis.
As a point of comparison, at the time of writing we estimate that roughly half the locations in our main cost-effectiveness analysis are above our 10x cost-effectiveness bar. While we’d expect the factors in our external validity adjustment (vitamin A deficiency rates and measles, diarrhea, and other infectious disease mortality) to vary substantially across locations, we’re unsure if we’re overestimating the true differences.
- 212
See this row in our cost-effectiveness analysis. This range is based on the following locations: Burkina Faso, Cameroon, Côte d'Ivoire, DRC, Guinea, Mali, Madagascar, Niger, and five states in Nigeria: Adamawa, Benue, Ebonyi, Nasarawa, and Taraba (for Helen Keller) and Chad (for Nutrition International). We focus on these locations for the reasons discussed above.
- 213
Our estimates are in this sheet of our cost-effectiveness analysis for all countries other than Cameroon and Madagascar, and this spreadsheet for Cameroon and Madagascar. Our adjustments are:
- Cameroon: We use a weighted average of mortality rates in four regions of Cameroon (Centre, Littoral, Ouest, Sud), which we think are 14% lower than the national average. We use these regions because these are the regions where Helen Keller supported VAS campaigns in the first half of 2021. Since then, Helen Keller has expanded to support all regions (see Helen Keller Intl, Room for More Funding Report, 2023, p. 18. We have not yet updated our analysis to account for this change).
- Madagascar: We estimate that mortality rates are 17% higher in the six regions Helen Keller's program will support in Madagascar than in Madagascar as a whole. For this list of regions, see the highlighted cells on the Madagascar tab of our subnational mortality rates for VAS spreadsheet.
- 214
We use microdata on deaths from 18 Demographic and Health Surveys (DHS) between 2013 and 2018 in sub-Saharan Africa and South Asia, shared by Romero-Prieto based on Romero-Prieto et al. 2021. The raw data and additional notes on our analysis are compiled in this spreadsheet.
- 215
See this row in our cost-effectiveness analysis.
- 216
See this row in our cost-effectiveness analysis. This range is based on the following locations: Burkina Faso, Cameroon, Côte d'Ivoire, DRC, Guinea, Mali, Madagascar, Niger, and five states in Nigeria: Adamawa, Benue, Ebonyi, Nasarawa, and Taraba (for Helen Keller) and Chad (for Nutrition International). We focus on these locations for the reasons discussed above.
- 217
See this section of our separate report on insecticide-treated nets for further details.
- 218
Our approach:
- We used VAS coverage estimates from recent Demographic and Health Survey in each country compiled in GiveWell, Analysis of baseline VAS coverage.
- We calculated a weighted average of 49% coverage across all the most recent surveys (weighted by how outdated they are), then regressed our estimates for each country towards that average (regressing more for countries with more outdated surveys).
- For example, in Côte d’Ivoire (where there was a recent 2021 DHS survey), we put 74% weight on that survey and 26% weight on the cross-country average. In DRC (where the most recent DHS is from 2024), we put 24% weight on the DHS and 76% weight on the cross-country average. See here in our analysis of baseline VAS coverage for this comparison.
- 219
See this section in our cost-effectiveness analysis. This calculation uses the following formula:
- Mortality overall = (Mortality among those not receiving VAS x % not receiving VAS) + (Mortality among those receiving VAS x % receiving VAS). This is equal to:
- (Mortality among those not receiving VAS x % not receiving VAS) + (Mortality among those not receiving VAS x relative risk of mortality from receiving VAS x % receiving VAS). This implies:
- Mortality among those not receiving VAS = Mortality overall / (relative risk of mortality from receiving VAS x % receiving VAS + % not receiving VAS).
- 220
See this row in our cost-effectiveness analysis. This range is based on the following locations: Burkina Faso, Cameroon, Chad, Côte d'Ivoire, DRC, Guinea, Mali, Madagascar, Niger, and five states in Nigeria: Adamawa, Benue, Ebonyi, Nasarawa, and Taraba (for Helen Keller) and Chad (for Nutrition International). We focus on these locations for the reasons discussed above.
- 221
This understanding is based on multiple conversations with IHME researchers. Detailed modeling assumptions for the GBD estimates are available in the GBD 2019 methods appendix.
- 222
To understand how the variation across countries’ baseline child mortality rates affect cost-effectiveness, we put together a rough sensitivity analysis. We found that cost-effectiveness is sensitive to baseline child mortality rates:
- All locations we analyzed exceeded our cost-effectiveness bar (10x as cost-effective as cash transfers as of the time of writing), when each location’s child mortality rate is set equal to the highest mortality rate across countries (1.76% in Niger). See this row in our sensitivity analysis.
- All locations but one fell below our cost-effectiveness bar when each location’s child mortality rate was set equal to the lowest mortality rate across countries (0.35% in Kenya). See this row in our sensitivity analysis.
As a point of comparison, at the time of writing we estimate that roughly half the locations in our main cost-effectiveness analysis are above our 10x cost-effectiveness bar. While we’d expect baseline child mortality to vary substantially across locations, we’re unsure if we’re overestimating the magnitude of this difference.
- 223
See this row in our cost-effectiveness analysis. Note that this estimate doesn’t account for the benefits we incorporate as rough supplemental adjustments, and so can’t be interpreted as an estimate of the total benefits of the program.
- 224
- Our estimate of the development effects of deworming programs is based on long-run follow-ups to the experiment described in Miguel and Kremer 2004. See our report on mass deworming programs for our full assessment of the study.
- For malaria programs, we rely on the findings of two natural experiments: Bleakley 2010 and Cutler 2010. See this section of our report on mass distribution of insecticide-treated nets (ITNs) for a detailed discussion of these studies.
- 225
- "This study uses the malaria-eradication campaigns in the United States (circa 1920), and in Brazil, Colombia and Mexico (circa 1955) to measure how much childhood exposure to malaria depresses labor productivity. The campaigns began because of advances in health technology, which mitigates concerns about reverse causality. Malarious areas saw large drops in the disease thereafter. Relative to non-malarious areas, cohorts born after eradication had higher income as adults than the preceding generation. These cross-cohort changes coincided with childhood exposure to the campaigns rather than to pre-existing trends. Estimates suggest a substantial, though not predominant, role for malaria in explaining cross-region differences in income." Bleakley 2010, abstract.
- "We examine the effects of exposure to malaria in early childhood on educational attainment and economic status in adulthood by exploiting geographic variation in malaria prevalence in India prior to a nationwide eradication program in the 1950s. We find that the program led to modest increases in household per capita consumption for prime age men, and the effects for men are larger than those for women in most specifications. We find no evidence of increased educational attainment for men and mixed evidence for women." Cutler 2010, abstract.
- 226
See this section of our report on insecticide-treated nets for more detail on these estimates.
- 227
See this row in our cost-effectiveness analysis.
- 228
See this row in our cost-effectiveness analysis.
- 229
"These findings suggest that SMC in children in areas with heavy malaria pressure tends to increase weight gain, but they do not offer evidence that SMC increases height gain. Except for Fernando et al. 2006, these trials were all conducted in sub-Saharan Africa in young children, so they should be roughly comparable to current VAS beneficiary contexts." GiveWell, Development effects of vitamin A supplementation, 2019, p. 23. This conclusion is based on five RCTs.
- 230
In our 2019 review, we focused on four studies from Ramakrishnan et al. 2009 that most closely resembled the locations where GiveWell funds VAS today. These studies suggested no impact of VAS on growth.
"Since the effect of VAS could be attenuated in higher-income countries with lower prevalence of vitamin A deficiency and lower infectious disease pressure, I further examined the results of individual RCTs included in Ramakrishnan et al. 2009, focusing on those conducted in low-income countries in sub-Saharan Africa similar to our current VAS beneficiary populations. This left four trials, which report the following:- Kirkwood et al. 1996 was conducted in Ghana and reported no "consistent or substantial" effect of VAS on weight, height-for-weight, or mid upper-arm circumference in two related RCTs.
- Fawzi et al. 1997 was conducted in North Sudan and reported no effect of VAS on height, weight, or the risk of stunting or wasting.
- Donnen et al. 1998 was conducted in Zaire [current-day DRC] and reported no effect of VAS on weight, height, or mid-upper arm circumference in the groups as a whole over the entire follow-up period.
- Villamor et al. 2002 was conducted in Tanzania and reported no effect of VAS on height (0.0 cm; 95% CI -0.6 to 0.6), weight (0.03 kg; 95% CI -0.16 to 0.23), or the risk of stunting or wasting in the groups as a whole.
Since possible growth effects of VAS could be mediated via reduced health impacts of infectious diseases, Kirkwood et al. 1996 is particularly informative because it is the largest VAS trial to report that VAS significantly reduces all-cause mortality. It did not report growth effects in the groups as a whole. Collectively, these findings provide little indication of an effect of VAS on growth, even in settings where VAS substantially reduces mortality risk." GiveWell, Development effects of vitamin A supplementation, 2019, pp. 21-22.
- 231
"Below, I pool the findings of the four trials that offered VAS postnatally, focusing on overall measures of cognitive ability. Since the trials measured general intelligence in different ways, I pooled using SMD to make them commensurable. The forest plot of the results is below:
When normalized by calculating SMD, the findings of these four trials are fairly similar, with overlapping 95 percent confidence intervals. The results suggest that VAS in infancy or childhood in populations with varying prevalence of vitamin A deficiency does not have a statistically significant effect on general intelligence when measured four months to eight years later. The nonsignificant SMD of 0.05 is roughly equivalent to a very small increase in IQ of 0.75 points, and the confidence interval implies that the finding is compatible with changes in IQ of -0.75 to 2.25. This yields a best-guess IQ effect of 0.75 points and allows us to tentatively exclude an increase in IQ of greater than 2.25 points, although this estimate comes with uncertainty." GiveWell, Development effects of vitamin A supplementation, 2019, p. 10. - 232
"Overall, the RCT literature presents a mixed picture of the impact of SMC on cognitive ability. Among the four trials that reported a substantial effect of SMC on a measure of malaria burden, two reported an improvement in at least one measure of cognitive ability, while the other two did not. This suggests that SMC can probably increase some measures of cognitive ability in some contexts, but the effect is inconsistent." GiveWell, Development effects of vitamin A supplementation, 2019, p. 10.
- 233
"Malaria infections can affect the brain, sometimes with severe consequences. The World Health Organization (WHO) defines "cerebral malaria" as a coma associated with malaria infection, with no other known cause of the coma. This is a strict definition that excludes many cases of brain involvement…
Based on a quick literature search, I very roughly estimate that 1.2 percent of under-5 clinical malaria episodes in sub-Saharan Africa result in cerebral malaria, using the strict WHO definition of cerebral malaria. Using a less strict definition that encompasses any clear sign of brain involvement, one might expect approximately twice this rate. These figures are very uncertain but suggest that cerebral malaria only affects a small minority of children per clinical malaria episode."
"My interpretation of the malaria evidence as a whole is that clinical malaria episodes in childhood probably impair mean cognitive ability somewhat, with the burden concentrated in a small minority of children, and preventing malaria with SMC may improve some measures of cognitive ability in some contexts. However, I am not very confident about the latter conclusion." GiveWell, Development effects of vitamin A supplementation, 2019, pp. 12, 19. - 234
"Vitamin A deficiency (VAD) impairs body functions and may cause death. Adverse health consequences may also include xerophthalmia (dry eyes), susceptibility to infection, stunting and anaemia (Sommer 1996; Rice 2004)." Imdad et al. 2010, p. 9.
Xerophthalmia (dry eyes), is "the leading cause of preventable childhood blindness." WHO, Global prevalence of vitamin A deficiency in populations at risk 1995–2005, 2009, p. 1. - 235
This is because we think they would be challenging to model effectively or their likely effect is small enough that we do not expect explicit modeling to be worth the time investment required.
- 236
See this section of our cost-effectiveness analysis.
- 237
- Step one: Estimate the likely size of each effect (a rough subjective best guess).
- Step two: Evaluate each effect using three criteria, each assigned a score of up to 3:
- Can it be objectively justified (i.e., is there direct evidence for the effect)? (Where 0 is little evidence and 3 is strong direct evidence).
- How easy would it be to model? (Where 0 is impossible and 3 is simple).
- Consistency - is this effect included in our cost-effectiveness analysis for other programs? (Where 1 is no, 2 is partially and 3 is yes).
- Step three: Convert the total three criteria score out of 9 into a percentage (e.g., a total score of 5 converts to a percentage of 50%).
- Step four: Weight our estimate of each effect by this percentage to produce our overall adjustment (e.g., an effect size guess of 15% multiplied by a three criteria score of 60% = an adjustment of 9% (15% x 60% = 9%)).
We use the method described for all supplemental intervention-level adjustments in our cost-effectiveness analysis for VAS, except our estimate of costs saved from averted illness. We account for these savings using an explicit model, discussed in more detail in GiveWell, Cost of Illness Averted Adjustment Write-up.
- 238
See this section of the report for a detailed breakdown by disease.
- 239
For more details on our reasoning, see this section of the report. See this row in our cost-effectiveness analysis for this adjustment.
- 240
"The search yielded 23 eligible studies, 21 clinical trials and 2 cohort studies, with children, teenagers, pregnant or lactating women. The meta-analysis of the clinical trials showed that VAS reduces the risk of anemia by 26% and raises hemoglobin levels, compared to non-treated group, independent of the life stage. VAS did not alter the prevalence of iron deficiency among the clinical trials conducted with children and teenagers (RR 0.82, 95% CI 0.60 to 1.12, p = 0.204), whereas a significant increase in serum ferritin levels was observed in trials conducted with pregnant and lactating women (WMD 6.61 μg/L; 95% CI 6.00 to 7.21 μg/L; p < 0.001). Therefore, vitamin A supplementation alone may reduce the risk of anemia, by improving hemoglobin and ferritin levels in individuals with low serum retinol levels." de Sá Barreto da Cunha et al. 2019, abstract.
- 241
We have two specific concerns:
- It includes nonrandomized trials, which have lower internal validity. However, nonrandomized trials only represent 3.3 percent of the pooled findings and they report findings that are close to the pooled mean, so they probably had little impact.
- Some of the trials did not isolate the impact of VAS and the meta-analysis may therefore overestimate the impact of VAS. We have spot-checked the three RCTs that received the largest weights, and two isolated VAS, while the third administered a deworming drug along with VAS.
- "All eligible anaemic pre-school children were randomly divided into three groups: group 1 received no intervention, which served as the control group, group 2 received 400 mg single-dose albendazole administration and group 3 received a 60000 μg vitamin A capsule combined with 400 mg single-dose albendazole at the beginning of the study." Chen et al. 2016, abstract. We have also read the abstract of Suharno et al. 1993 and Ahmed et al. 2001.
See de Sá Barreto da Cunha et al. 2019, figure 3.
- 242
See this row in our cost-effectiveness analysis.
- 243
See this discussion of anemia in our development effects model here.
- 244
We include an additional adjustment to account for these benefits because we would expect invested income to earn a return, meaning increased income leads to further consumption increases in the future. For example, we estimate that income invested as a result of GiveDirectly’s direct cash transfer program will earn a return of 10% (see here in our cost-effectiveness analysis). We have not investigated whether returns will be similar for income accrued through VAS development effects. See this row in our cost-effectiveness analysis.
- 245
We currently use the following values:
- Insecticide-treated nets: 2.5%
- Seasonal malaria chemoprevention: 5%
- Conditional cash transfers for vaccination (New Incentives): 5%
See our cost-effectiveness analysis for each program for our reasoning in each case. We have not updated these values recently, and they may be out of date.
- 246
Xerophthalmia (dry eyes), is "the leading cause of preventable childhood blindness." WHO, Global prevalence of vitamin A deficiency in populations at risk 1995–2005, 2009, p. 1.
- 247
Imdad et al. 2017 found that VAS:
- Reduces the incidence of Bitot’s spots (a potential precursor to blindness) by 58% (RR 0.42, 95% CI 0.33 to 0.53).
- Reduces the incidence of night blindness by 68% (RR 0.32, 95% CI 0.21 to 0.50).
Imdad et al. 2017 assesses both estimates as based on "moderate" quality evidence.
See Imdad et al. 2017, Summary of Findings, p. 5. - 248
See GiveWell, VAS vision benefits write-up for our rough analysis.
- 249
We use GiveDirectly's unconditional cash transfer program as a benchmark for comparing the cost-effectiveness of different programs, which we describe in multiples of "cash." Thus, if we estimate that a program is "10x cash," this means we estimate it to be ten times as cost-effective as unconditional cash transfers.
- 250
See this section of our report on Helen Keller Intl, the organization GiveWell has supported most for previous VAS campaigns, for further details.
- 251
See Helen Keller Intl, Distribution methods for VAS mass distribution campaigns, 2022 for details on which other interventions were co-delivered with VAS in Helen Keller-supported campaigns between 2018 and 2021.
- 252
"Since vaccination against a specific disease commonly enhances immunity to other diseases, we believe it is plausible that some vaccines have beneficial nonspecific effects. Animal research suggests that VAS can increase the immune response to certain vaccines, although the results of human trials are inconsistent. Together, we believe this suggests that it is fairly plausible that VAS can enhance the beneficial nonspecific effects of vaccines in charity-relevant settings, but we are fairly uncertain about this conclusion. Due to a weaker evidence base, we believe the plausibility of harmful nonspecific effects of vaccines is lower but not negligible." GiveWell, The biological plausibility of interactions between vitamin A supplementation and vaccine effectiveness, 2018, p. 1.
- 253
See this row in our cost-effectiveness analysis.
- 254
As of February 2024, these are AMF, Malaria Consortium, Helen Keller, and New Incentives. See our "Top charities" page here.
- 255
Our model estimates a 14% upwards adjustment for insecticide-treated nets (here), a 20% upwards adjustment for seasonal malaria chemoprevention (here) and a 21% upwards adjustment for vitamin A supplementation (here).
- 256
"We reanalyzed the data to explore the hypothesis that VAS reduces mortality in children who had bacille Calmette-Guerin or measles vaccine as their most recent vaccine but increased mortality when diphtheria-tetanus-pertussis vaccine (DTP) was the most recent vaccine. On the basis of previous studies, we expected the effects to be strongest in girls." Benn et al. 2009, p. 629.
- 257
"As hypothesized, the reanalysis suggests important interactions between VAS, sex, and vaccines. VAS was associated with a strong beneficial effect in children with no record of vaccination, whereas there was almost no effect for those who had been vaccinated. This differential effect was due to a difference in girls, in whom VAS was associated with a decrease in mortality in the unvaccinated but in whom VAS was associated with a nonsignificant increase in mortality in the vaccinated (Table 2). This was due to a differential effect of VAS according to vaccination type. Among girls who had already received MV at enrollment, VAS was associated with significantly higher mortality. This was only seen in girls who were missing doses of DTP at enrollment and were therefore likely to receive them during follow-up (Table 5)." Benn et al. 2009, p. 635.
- 258
"We have hypothesized that the effect of VAS is modified by vaccines, VAS amplifying the non-specific immune-modulating effects of vaccines, thus being beneficial when provided with live vaccines but potentially harmful with inactivated vaccines." Fisker et al. 2014, p. e740.
"As prespecified, all analyses considered interaction between VAS and gender and, in addition, previous VAS and season." Fisker et al. 2014, p. e741. - 259
"Between August 2007 and November 2010, 7587 children were enrolled. Within 6 months of follow-up 80 non-accident deaths occurred (VAS: 38; placebo: 42). The mortality rate ratio (MRR)comparing VAS versus placebo recipients was 0.91 (95% confidence interval 0.59–1.41) and differed significantly between boys (MRR1.92 [0.98–3.75]) and girls (MRR 0.45 [0.24–0.87]) (P= .003 for interaction between VAS and gender). At enrollment, 42% (3161/7587) received live measles vaccine, 29% (2154/7587) received inactivated diphtheria-tetanus-pertussis–containing vaccines, and 21% (1610/7587)received both live and inactivated vaccines. The effect of VAS did not differ by vaccine group." Fisker et al. 2014, p. e739.
- 260
"Since vaccination against a specific disease commonly enhances immunity to other diseases, we believe it is plausible that some vaccines have beneficial nonspecific effects. Animal research suggests that VAS can increase the immune response to certain vaccines, although the results of human trials are inconsistent. Together, we believe this suggests that it is fairly plausible that VAS can enhance the beneficial nonspecific effects of vaccines in charity-relevant settings, but we are fairly uncertain about this conclusion. Due to a weaker evidence base, we believe the plausibility of harmful nonspecific effects of vaccines is lower but not negligible." GiveWell, The biological plausibility of interactions between vitamin A supplementation and vaccine effectiveness, 2018, p. 1.
- 261
"In most children 6–59 months of age, a dose of 100 000–200 000 IU of vitamin A is well tolerated, although side-effects such as headache, nausea or vomiting, and diarrhoea have been reported in 3–7% of these children." WHO, Guideline: vitamin A supplementation in infants and children 6-59 months of age, 2011, p. 3.
- 262
"In most children 6–59 months of age, a dose of 100 000–200 000 IU of vitamin A is well tolerated, although side-effects such as headache, nausea or vomiting, and diarrhoea have been reported in 3–7% of these children." WHO, Guideline: vitamin A supplementation in infants and children 6-59 months of age, 2011, p. 3.
- 263
WHO, Adverse events following administration of vitamin A supplements:
- "The administration of excessive amounts of vitamin A can lead to toxicity, known as hypervitaminosis A. The amount required to cause toxicity will vary among individuals." p. 1.
- "Worldwide, the incidence of hypervitaminosis A is a very minor problem compared with the incidence and effects of vitamin A deficiency. An estimated 200 cases of hypervitaminosis A occurs annually…" p. 1.
- "Hypervitaminosis does not result from public health intervention programs. Rather toxicity has been associated with the abuse of vitamin A supplements and with diets extremely high in preformed vitamin A (i.e., foods of animal origin). Toxic reactions provoked by large doses of vitamin A are well-known to occur following either intake of liver rich in vitamin A (e.g., polar bear, halibut or whale) or by excessive administration of vitamin A preparations (Miller & Hayes, 1982)." p. 2.
- "Acute vitamin A toxicity (single ingestion of 25,000 IU per kg or more): Signs and symptoms may be delayed for 8 to 24 hours and include manifestations such as nausea, vomiting, diarrhea, changes in humour (irritability, drowsiness, dizziness, lethargy), increased intracranial pressure (headache, bulging of fontanelle, diplopia, papilloedema), skin changes (erythema, pruritus, desquamation). Peeling of skin around mouth may be observed from 1 to several days after ingestion and may spread to the rest of the body (Miller & Hayes, 1982; Bendich & Langseth, 1989; Hathcock et al., 1990; CPS, 1999; Parfit, 1999)." p. 2.
Note: the WHO guidance uses the terms "toxicity" and "hypervitaminosis A" interchangeably. In 2023, we received feedback from an expert, Dr. Sherry Tanumihardjo, that the two terms should refer to different thresholds. We haven’t investigated the differences between the two in depth.
"In the BOND report (Tanumihardjo et al., 2016), we tried to distinguish between hypervitaminosis A and vitamin A toxicity. Hypervitaminosis A occurs when there is too much vitamin A, but no clinical signs are present. Toxicity is when retinyl esters begin to circulate and the liver is compromised." Sherry Tanumihardjo, Review of GiveWell VAS report, December 2023 (unpublished). - 264
- "Hypervitaminosis does not result from public health intervention programs. Rather toxicity has been associated with the abuse of vitamin A supplements and with diets extremely high in preformed vitamin A (i.e., foods of animal origin). Toxic reactions provoked by large doses of vitamin A are well-known to occur following either intake of liver rich in vitamin A (e.g., polar bear, halibut, or whale) or by excessive administration of vitamin A preparations (Miller & Hayes, 1982)." WHO, Adverse events following administration of vitamin A supplements, p. 2.
- Helen Keller told us that receiving two doses of vitamin A supplements within a short time period would not meet toxicity thresholds:
- "[GiveWell:] In countries where six-month contact points have been initiated, is there a risk of a child receiving a 'double dose' of VAS in a short time period (one from a facility visit when the infant is six months old, and another at the next biannual Child Health Day or door-to-door campaign)? Would receiving a double-dose potentially be dangerous? (Even if they aren't dangerous, we're also concerned about double-doses because they wouldn't be an effective use of resources.)
- "[Helen Keller:] This is a legitimate question and one we have had to think about carefully as we started to promote and support the 6 month contact point (6MCP). First, receiving two doses in a short time frame poses some, but minimal, risks for children as the toxicity thresholds go far beyond receiving two doses (see attached document on Adverse events following administration of VAS)."
Helen Keller responses to GiveWell's questions May 2017, unpublished.
- 265
See this section of our discussion of the cost per supplement analysis for further details on this estimate.
- 266
For a summary of fertility rates by country, see Our World in Data, "Fertility rate: children per woman, 2021".
- 267
"The impact of life-saving interventions on fertility and population growth varies by context, and is rarely greater than 1:1. In places where lifetime births/woman has been converging to 2 or lower, saving one child’s life should lead parents to avert a birth they would otherwise have. The impact of mortality drops on fertility will be nearly 1:1, so
population growth will hardly change. In the increasingly exceptional locales where couples appear not to limit fertility much, such as Niger and Mali, the impact of saving a life on total births will be smaller, and may come about mainly through the biological channel of lactational amenorrhea. Here, mortality-drop fertility-drop ratios of 1:0.5 and 1:0.33 appear more plausible." Roodman, The Impact of Life-Saving Interventions on Fertility, 2014, summary. - 268
We received this feedback as an entry to GiveWell’s 2022 Change our Mind contest. In 2024, the author shared an updated version with some minor edits (the version published here). Mariet Benade, Drug degradation as a potential reason for differences in the effect of Vitamin A Supplementation on all-cause mortality among children, 2024.
- 269
"The 50 000-IU capsules that were tested were also fully potent up to and through February 2003. However, between February and July 2003, the vitamin A content of the 50 000-IU capsules declined markedly, so that the 33 capsules that were analyzed between August 2003 and January 2004 contained only 1800–23 993 IU (mean: 15 861 IU), or 32% of the expected amount." Idindili et al. 2007, p. 1315.
- 270
"These analyses confirmed that the 200 000- and 100 000-IU capsules contained a satisfactory amount of retinyl palmitate throughout the trial period. The 25 000-IU capsules also had ≥80% potency up to July 2003, when the last dose of this type of capsule had already been given…However, between February and July 2003, the vitamin A content of the 50 000-IU capsules declined markedly." Idindili et al. 2007, p. 1314.
- 271
If making an adjustment, we would primarily ask whether capsule degradation in contemporary VAS programs was better or worse than the RCTs in the Cochrane meta-analysis we rely on, not whether capsules degraded in contemporary VAS programs at all.
We do not think the Tanzania RCT (Idindili et al. 2007), by itself, is very informative about degradation in contemporary programs, because:- It is a single, 20 year old study.
- Three of the four types of capsule retained good vitamin A levels during the study, and only one type (50,000 IU, ½ to ¼ the dose used in Helen Keller and Nutrition International’s program) did not.
- The sample used to assess Vitamin A degradation in the Tanzania study contained only 33 capsules. While the authors do not report confidence intervals, our best guess is that the confidence intervals for this estimate would be wide.
However, we haven’t checked to see if more comprehensive data is available on this question.
Our initial light-touch review of the five most highly weighted studies in the Cochrane meta-analysis (Imdad et al. 2017) found that three studies reported capsule degradation data. In all three, the capsules retained 80+% their intended levels of vitamin A when tested.- "Supplements were stored in sealed bottles at room temperature. Random samples of the vitamin A bottles and of the capsules were returned for testing of retinol content by Hoffman-La-Roche's laboratories in Basel; there was less than 20% loss of potency, even in vitamin A stored for up to 2 years." Ross et al. 1993, p. 8.
- "Every 4 months two capsules of each code, sampled from the study area, were analysed for vitamin A potency by a local laboratory unaware of their code. The mean retinol contents were 53 300 (SD 3513) and 246 (27) retinol equivalents, which is equivalent to 89% and 82% potency for the vitamin A (n = 19) and control (n = 20) capsules, respectively." West et al. 1991, p. 68.
- "After 22 months of storage, a sample of capsules of both colours was sent to the manufacturer for analysis; 15% of the vitamin A activity had been lost." Herrera et al. 1992, p. 267.
- 272
The examples we have seen have varied by country and over time. For example:
- DRC: Since 2021, Helen Keller has used GiveWell funding in DRC to fund campaigns at the province level, starting with three provinces in 2021 and expanding to seven provinces in 2022. We therefore interpret the impact of Helen Keller’s funding in DRC as allowing more provinces to be covered. See Helen Keller Intl, Room for More Funding Report, 2021, pp. 18-19.
- Cote d’Ivoire: In 2021, Helen Keller reported that it expected VAS distributions to be canceled in some districts in the absence of additional funding. Our best guess is therefore that Helen Keller’s funding in Cote d’Ivoire as allowing more provinces to be covered. See Helen Keller Intl, Room for More Funding Report, 2021, p. 17.
- Guinea: In 2016 and 2017, two planned campaign rounds in Guinea were skipped altogether because of lack of funding (see GiveWell, Helen Keller country case studies, 2017). Since 2018, campaigns have taken place every round in Guinea (Helen Keller Intl, Room for More Funding Report, 2021, p. 19, and Helen Keller Intl, Room for More Funding Report, 2022, p. 13). We therefore interpret the most likely impact of Helen Keller’s funding in Guinea as allowing campaigns to take place.
- 273
Differences:
- Within-organization fungibility: We used a -2% adjustment for within-organization fungibility. This is a smaller adjustment than for Helen Keller, because Chad was not a "core" location for Nutrition International and they had a relatively limited track record there. It seemed very unlikely to us that Nutrition International would allocate its limited amount of flexible funding to these funding gaps in the absence of GiveWell funding.
- Change of priorities: We use a higher adjustment (-5% compared to 0% for Helen Keller) for changes in Nutrition International’s priorities (i.e., Nutrition International might use some GiveWell funding for things we do not believe to be useful, and that we did not envisage). This adjustment is higher because we do not have as much experience funding Nutrition International as Helen Keller.
See this section of our cost-effectiveness analysis for further details on our reasoning.
- 274
As of February 2024, we apply the following adjustments to our other top charities:
- 275
See these rows in our cost-effectiveness analysis.
- 276
This is driven by two factors:
- In some of Helen Keller’s campaigns, only certain regions are surveyed. We think the regions selected for campaigns may not be selected randomly, meaning that the data may not be representative of Helen Keller’s program as a whole. See this section of our review of Helen Keller for more information.
- In most countries Helen Keller only conducts a survey after one of two campaign rounds, and our understanding is that VAS implementers may know in advance which campaign will be surveyed. If that is the case, we would guess that workers would be more incentivized to ensure high coverage in surveyed campaigns than non-surveyed campaigns (which have less oversight).
- 277
See this row in our cost-effectiveness analysis.
- 278
This understanding is based on many conversations with Helen Keller over time.
- 279
See this row in our cost-effectiveness analysis. Our leverage adjustment ranges from -1% to -5%, varying by location. This range is based on the following locations: Burkina Faso, Cameroon, Côte d'Ivoire, DRC, Guinea, Mali, Madagascar, Niger, and five states in Nigeria: Adamawa, Benue, Ebonyi, Nasarawa, and Taraba (for Helen Keller) and Chad (for Nutrition International). We focus on these locations for the reasons discussed above.
- 280
See the section above for more details on how we reach these estimates. Note that these figures don’t correspond with the proportion of costs paid by different actors in this section of our cost-effectiveness analysis. We estimate that for each $1m spent by Helen Keller, Nutrition International incurs ~$88,000 in costs and the Guinea government incurs ~$543,000.
The reason the figures above are smaller than this is that some program costs are also borne by other philanthropic actors (in Guinea, WHO). Our best guess is that if Helen Keller didn’t fund the program, these costs would be unaffected and the Guinea government / Nutrition International costs would shrink proportionally to WHO’s costs. These are around 15% as large as Helen Keller and WHO’s costs combined. ~543,000 x 15% = ~$460,000 and ~$88,000 x 15% = ~$75,000. See this cell and this cell of our cost-effectiveness analysis for our calculations. - 281
We estimate that each dollar spent by a domestic government in a country receiving VAS generates 0.005 units of value, compared to 0.060 for Helen Keller’s spending on VAS in Guinea. 0.005 / 0.060 = 8.3%. For Nutrition International’s VAS capsule donations, we estimate 0.006 units of value. 0.006 / 0.060 = 10%.
For details of how we estimate these values, see this section of the report. - 282
- We estimate that each dollar spent by the Guinea government generates 0.005 units of value if used for other activities and each dollar spent by Nutrition International on VAS capsule donations generates 0.006 units of value.
- In total, we think that each $1m spent by Helen Keller causes the Guinea government to incur ~$460,000 in in-kind costs and Nutrition International to incur ~$75,000 in costs for donated capsules.
- This implies that shifting these resources away from other activities results in 2,751 units of value being lost. (~460,000 x 0.005) + (~75,000 x 0.006) = 2,751.
See this row in our cost-effectiveness analysis.
- 283
See this row in our cost-effectiveness analysis.
- 284
2,751 x 55% = 1,513. 1,513 / 60,187 = ~3%. See this row in our cost-effectiveness analysis.
- 285
See this row in our cost-effectiveness analysis. Our funging adjustment ranges from -18% to -46% depending on the location. This range is based on the following locations: Burkina Faso, Cameroon, Côte d'Ivoire, DRC, Guinea, Mali, Madagascar, Niger, and five states in Nigeria: Adamawa, Benue, Ebonyi, Nasarawa, and Taraba (for Helen Keller) and Chad (for Nutrition International). We focus on these locations for the reasons discussed above.
- 286
Our understanding is that UNICEF and Nutrition International are the largest philanthropic organizations supporting VAS in areas where Helen Keller works and therefore the most likely to replace its funding. See this section of our review of Helen Keller for further information.
We revisit these probabilities for each grant we make. For Guinea, we most recently estimated these probabilities as part of a 2023 grant. See our grant page here. - 287
In this scenario, we do not think that Helen Keller’s funding is causing more VAS to be delivered, because other funders would have replaced its spending in any case.
- 288
We roughly estimate that the Guinea government’s spending on other activities generates 0.005 units of value per dollar, and UNICEF / Nutrition International’s spending generates 0.012 units of value per dollar, compared to 0.060 for Helen Keller’s spending in Guinea. 0.005 / 0.060 = ~8% and 0.012 / 0.060 = 20%. See this section of the report for how we generate these estimates.
- 289
- We estimate that each dollar spent by the Guinea government generates 0.005 units of value if used for other activities and Helen Keller generates 0.060 units of value per dollar spent on VAS in Guinea. Per $1m, the Guinea government replacing Helen Keller’s spending in Guinea would generate 60,187 units of value on VAS ($1m x 0.060) and lose 5,057 units of value ($1m x 0.005) that would have been spent on other programs. 60,187 - 5,057 = 55,130. See these cells in our cost-effectiveness analysis.
- We estimate that each dollar spent by other philanthropic actors (UNICEF and Nutrition International) generates 0.012 units of value if used for other activities. Per $1m, replacing Helen Keller’s spending in Guinea would generate 60,187 units of value on VAS ($1m x 0.060) and lose 12,310 units of value ($1m x 0.012) that would have been spent on other programs. 60,187 - 12,310 = 47,877. See these cells in our cost-effectiveness analysis.
- 290
See this cell in our cost-effectiveness analysis for our estimated probability of the Guinea government replacing Helen Keller's spending, and this cell for the probability for other philanthropic actors.
- 291
Note that this breaks down into:
5,513 + 16,757 = 22,270. See this cell in our cost-effectiveness analysis.
- 292
22,270 / 60,187 = ~37%. See this cell in our cost-effectiveness analysis.
- 293
We estimate the probability that other funders would replace GiveWell's funding in our absence by adding the probability that domestic governments would replace the funding (see this row in our cost-effectiveness analysis) with the probability that other philanthropic actors would replace the funding (see this row in our cost-effectiveness analysis). This estimate (varying by location) ranges from 20% to 50% in our analysis.
- 294
Note that these figures don’t correspond with the proportion of costs paid by different actors in this section of our cost-effectiveness analysis. We estimate that for each $1m spent by Helen Keller, Nutrition International incurs ~$88,000 in costs and the Guinea government incurs ~$543,000.
The reason the figures above are smaller than this is that some program costs are also borne by other philanthropic actors (in Guinea, WHO). Our best guess is that if Helen Keller didn’t fund the program, these costs would be unaffected and the Guinea government / Nutrition International costs would shrink proportionally to WHO’s costs. These are around 15% as large as Helen Keller and WHO’s costs combined. ~543,000 x 15% = ~$460,000 and ~$88,000 x 15% = ~$75,000. See this cell and this cell in our cost-effectiveness analysis for our calculations. - 295
Our understanding is that WHO provided costs for polio campaigns in Guinea in 2018 and 2019 and VAS was co-delivered alongside these campaigns (more discussion here).
We exclude these costs from our leverage and funging adjustments, because we think that these polio campaigns would have gone ahead regardless of Helen Keller’s funding, and so Helen Keller does not lead to WHO contributing more or less to the campaign. - 296
See this section of our cost-effectiveness analysis, and these cells for the Guinea estimates.
- 297
By way of comparison, we think that the VAS funding landscape is less crowded than the funding landscape for the main malaria interventions GiveWell funds, seasonal malaria chemoprevention and insecticide-treated nets. There are two major funders of malaria control (the Global Fund to fight AIDS, Tuberculosis and Malaria, and the US government's President's Malaria Initiative) that to a significant extent fund the most high priority needs for malaria control in low-income countries. In contrast, our understanding is that GiveWell is the largest funder of VAS campaigns in low-income countries in Africa, despite the fact that GiveWell's total funding for VAS is considerably lower than its total funding for malaria control.
- 298
This understanding is based on many discussions over time with Helen Keller and other VAS stakeholders.
- 299
"With GiveWell support, Helen Keller Intl covered VAS funding gaps in Guinea since 2018. Helen Keller and UNICEF are the two main actors providing VAS technical and financial support to the Ministry of Health." Helen Keller Intl, Room for More Funding Report, 2021, p. 19.
- 300
"Following discussions with the Ministry of Health and partners, it appears that UNICEF’s funding will be inadequate to support VAS in more regions, although it intends to continue to support at least 3 out of the 8 regions in the country. Nutrition International’s current funding will end in 2022. Thus, it is expected that between 2023 and 2025, Helen Keller will be requested to support the remaining 5 regions for the implementation of campaigns or weeks of intensification." Helen Keller Intl, Room for More Funding Report, 2022, p. 13.
- 301
See this row in our cost-effectiveness analysis.
- 302
See this row in our cost-effectiveness analysis.
- 303
0.005 / 0.060 = 8.3%, or 1/12.
- 304
See this row in our cost-effectiveness analysis.
- 305
Health
- We use data from the Uganda National Health Expenditure Accounts in 2013-14 (available here) as a proxy for how domestic governments in low-income countries allocate their health spending. In that year, approximately 30% of the health spending was allocated to HIV/AIDS, 20% to malaria, and the rest to other programs (see this column in our counterfactual value of government funds spreadsheet).
- We roughly guess the dollar value required to save a life for eight of the largest categories of spending (e.g., we guess $30,000 of spending on HIV/AIDS programs is required to save one life (here), compared to $10,000 for malaria, here). As a simplifying assumption, we divide each category of spending into spending intended to save adult lives (e.g., HIV/AIDS), or spending intended to save under-five lives (e.g., malaria) (see this column in our counterfactual value of government funds spreadsheet). This allows us to calculate the weighted average cost required to save one child’s life ($12,254) and one adult life ($30,000).
- Finally, we translate these figures into standardized units of value using GiveWell’s moral weights for the value of averting a child death (116 units) and adult death (73 units). We also use our estimates of the proportion of spending allocated to programs intended to save adult lives (55%) and under-five lives (45%). This results in an overall weighted average of 0.0056 units of value per $ spent on health programs by domestic governments. See this section of our analysis of the counterfactual value of other actors' spending for our calculations.
Education
- As with health, we use data from Uganda as a proxy for how domestic governments in low-income countries allocate their education spending. Specifically, we rely on World Bank 2014 data that 7% of Uganda’s GDP in 2014 went towards primary education, 3% went towards secondary education and 2% went towards tertiary education (here). We then rescale these figures, resulting in estimates that 59% of education spending in Uganda goes towards primary education, 25% towards secondary education and 16% towards tertiary education (here).
- As a simplifying assumption, we assume that the primary benefit of education spending is that it increases long-run income and consumption. We benchmark our estimates to our estimates of the impact of GiveDirectly’s unconditional cash transfer program (which we think also increases income and consumption). Specifically, we roughly guess that primary education spending is 100% as valuable as GiveDirectly’s program, secondary education is 70% as valuable and tertiary education is 50% as valuable (here).
- We take a weighted average of these values, using the % of government spending on each category of education as weights. This results in an overall estimate of 0.0028 units of value per $ spent on education programs by domestic governments. See this section of our analysis for our calculations.
Social security
We use a similar approach to estimating the value of social security spending as education spending. Specifically:- We use data from Uganda as a proxy for how domestic governments in low-income countries allocate their social security spending. We use World Bank 2014 estimates that social security spending accounted for 0.62% of Uganda’s GDP (here). Within this, 0.29% of GDP is in-kind spending, 0.1% is social pension spending, 0.1% is conditional cash transfers, and 0.05% is other cash transfers (here).
- We roughly guess the value generated by each of these four largest categories of social security spending, excluding the smaller categories. As with education spending, we use the simplifying assumption that the primary benefit of social security spending is that it increases income and consumption. Benchmarking to GiveDirectly’s cash transfer program, we guess that cash transfers generate 100% of the value of GiveDirectly’s program and in-kind and social pension spending each generate 70% of the value (here).
- We take a weighted average of these values, using the % of government spending on each category of social security spending as the weights (re-scaled to ignore smaller categories). This results in an overall estimate of 0.0026 units of value per $ spent on social security programs by domestic governments. See this section of our analysis for our calculations.
- 306
See this row in our analysis of the counterfactual value of other actors' spending.
- 307
See this row in our cost-effectiveness analysis and this row in our analysis of the counterfactual value of other actors' spending.
- 308
See this row in our cost-effectiveness analysis.
- 309
See this row in our analysis of the counterfactual value of other actors' spending.
- 310
Burkina Faso, Cameroon, Côte d'Ivoire, and DRC. See this row in our cost-effectiveness analysis.
- 311
"UNICEF received a USD $25 million grant from Global Affairs Canada to support VAS in 15 countries (Angola, Benin, Burkina Faso, Cameroon, CAR, Chad, Cote d‘Ivoire, DRC, Guinea, Madagascar, Malawi, Mozambique, Sierra Leone, Sudan, Togo) from mid-2023 to end-2025 (5 Semesters). However, considering that some funds will be used for global studies and not all funds can be directly allocated to VAS support in the field, the actual direct VAS delivery support per semester and per country is less than USD $200,000." Helen Keller Intl, Room for More Funding Report, 2023, p. 2.
- 312
Mali, Niger, Nigeria, Kenya, and Uganda. In these locations, we expect much of the funding comes from UNICEF’s uncommitted funding. We would expect the counterfactual value of these funds to be lower. See this row in our cost-effectiveness analysis.
- 313
"The above-mentioned VAS campaign studies are not the only studies that have indicated that high-dose VAS in certain situations can be associated with harm. Our group has pointed out that a number of studies providing VAS at the time window of diphtheria-tetanus-pertussis (DTP)-containing vaccine have tended to find negative effects, particularly in females (reviewed in [4], examples in[14-17]). This observation goes hand in hand with the controversial but consistent observation that DTP vaccine is associated with negative non-specific effects and increased female mortality[18-20]. Likewise, there are indications that VAS can have
negative effects in boys, who receive a combination of live and non-live vaccines at the same time (reviewed in [4], examples in [7, 21]), also in this case, vaccine studies have indicated that this combination of live and non-live vaccines can have negative non-specific effects in males. Hence, VAS seems to amplify the negative effect of vaccine(s) that have been shown to have negative effects on overall survival." Christine Benn, Feedback on GiveWell vitamin A supplementation (VAS) research, December 2023 (unpublished). - 314
"The relationship of health with vitamin A status is a U shape. Too little and there are bad effects leading to death. Too much, and there are effects on bone."
"In the BOND report (Tanumihardjo et al., 2016), we tried to distinguish between hypervitaminosis A and vitamin A toxicity. Hypervitaminosis A occurs when there is too much vitamin A, but no clinical signs are present. Toxicity is when retinyl esters begin to circulate and the liver is compromised." Sherry Tanumihardjo, Review of GiveWell VAS report, December 2023 (unpublished). - 315
"In some cases, VAS might interrupt growth if children are hypervitaminotic. In this case, we think it is because of acute toxicity causing the child to feel nausea and then not eating for several days.
We have evidence of this in South African (van Stuijvenberg et al. 2019; Sheftel et al., 2022) and Malawian children (Williams et al., 2021). Below are two graphs that we published in South African children who regularly consume liver (attached). On the background of good dietary intake of vitamin A, the supplements are mostly stored and do accumulate causing the children to have hypervitaminosis A…
In the Malawian school-age children we saw elevated retinyl ester concentrations. Serum retinyl esters will only be elevated if there are very high stores of vitamin A to the point of toxicity." Sherry Tanumihardjo, Review of GiveWell VAS report, December 2023 (unpublished). - 316
"A final issue not fully addressed in the GiveWell analysis is the potential for excessive VA status, at least in sub-sets of the population, in locations where VAS is super-imposed on VA fortification programs and other platforms that deliver additional VA (e.g, micronutrient powders and small quantity lipid-based nutrient supplements). Although I doubt that this is an important issue for public health in most of sub- Saharan Africa, it is something that needs to be monitored going forward." Kenneth Brown, Comments on GiveWell Vitamin A Supplementation cost-effectiveness analyses, November 2023 (unpublished).
- 317
"To the contrary, some showed a statistically significant increase in respiratory infection incidence in the vitamin A compared with the control group. One of these, conducted in Indonesia, included 1407 preschool children. It was a randomised, placebo-controlled, double masked trial, published in 1996. The authors concluded: ‘High dose vitamin A supplements increased the incidence of acute respiratory illnesses (ARI) by 8%, and acute lower respiratory illnesses (ALRI) by 39%’. They also concluded: ‘These ‘detrimental effects on acute lower respiratory illnesses were most marked in children with adequate nutritional status’." Latham 2010, p. 24.
- 318
"There was no significant effect for VAS on mortality due to measles, respiratory disease, and meningitis. VAS reduced incidence of diarrhoea (RR 0.85, 95% CI 0.82 to 0.87; 15 studies; 77,946 participants; low-quality evidence) and measles (RR 0.50, 95% CI 0.37 to 0.67; 6 studies; 19,566 participants; moderate-quality evidence). However, there was no significant effect on incidence of respiratory disease or hospitalisations due to diarrhoea or pneumonia." Imdad et al. 2017, abstract.
- 319
Note that we have received feedback from a VAS Expert, Dr. Kenneth Brown, that we should be cautious about conclusions that VAS might increase respiratory disease risk, due to uncertainties about the methods used in field studies to detect respiratory disease. We have not deeply investigated or tried to corroborate this.
"With regard to the statements on possible adverse effects of VAS on the incidence of respiratory infections, I believe it is important to recognize that it is notoriously difficult in community-based studies to assess the presence of lower respiratory tract infections (ALRI -- bronchitis and pneumonia), which are much more important causes of mortality than upper respiratory tract infections. In most community-based studies, the diagnosis of ALRI depends on the (reported or observed) presence of cough and age-specific elevated respiratory rate. If VAS results in a more vigorous (protective) cough response, ALRI may be diagnosed more frequently, while this (i.e., the presence of cough) actually might be a beneficial effect of VAS. Thus, caution is needed in the interpretation of these findings, and any studies that included radiographic confirmation of pneumonia should be considered more reliable." Kenneth Brown, email to GiveWell, February 8th 2024 (unpublished). - 320
"In settings where vitamin A deficiency is a public health problem, vitamin A supplementation is recommended in infants and children 6–59 months of age as a public health intervention to reduce child morbidity and mortality (strong recommendation)." WHO, Guideline: vitamin A supplementation in infants and children 6-59 months of age, 2011, p. 1.
- 321
"Authors' conclusions
Vitamin A supplementation is associated with a clinically meaningful reduction in morbidity and mortality in children. Therefore, we suggest maintaining the policy of universal supplementation for children under five years of age in populations at risk of VAD. Further placebo-controlled trials of VAS in children between six months and five years of age would not change the conclusions of this review, although studies that compare different doses and delivery mechanisms are needed. In populations with documented vitamin A deficiency, it would be unethical to conduct placebo-controlled trials." Imdad et al. 2017, abstract. - 322
We have seen the following commentators call for an end to mass VAS distribution campaigns:
Latham 2010: "Of course the administration of medicinal doses of capsules is effective in cases of clinically evident xerophthalmia, which remains a public health problem and even emergency in some locations in some lower-income countries. What is mistaken, and reprehensible, are the claims made for vitamin A capsule programmes, and the indiscriminate scale of these programmes. Evidence for the numbers claimed was never conclusive, and is increasingly embarrassingly lacking as implementation has expanded." pp. 31-32.
Mason et al. 2018: "These programmes, intended to reduce child mortality, are no longer effective, are wasteful, and are of doubtful safety." p. 1. - 323
"The policy to provide vitamin A supplementation twice per year to children aged 6–59 months was based on eight trials from the late 1980s and early 1990s. However, results of two recent trials published in 2013 and 2014 showed no effect of vitamin A supplementation on overall survival, and there are other reasons to question the continuation of vitamin A supplementation." Benn et al. 2018, p. 631.
- 324
"The first key question is: what impact do these programmes have on child mortality today? Deaths prevented by intermittent high dose vitamin A supplements in the 1980s and 90s were primarily from measles and diarrhoea; measles now has low incidence, with high vaccination coverage, and diarrhoea is better managed. Re-analysis of a Ghanaian study showed that only unvaccinated children benefited." Mason et al. 2018, p. 1.
- 325
"As hypothesized, the reanalysis suggests important interactions between VAS, sex, and vaccines. VAS was associated with a strong beneficial effect in children with no record of vaccination, whereas there was almost no effect for those who had been vaccinated. This differential effect was due to a difference in girls, in whom VAS was associated with a decrease in mortality in the unvaccinated but in whom VAS was associated with a nonsignificant increase in mortality in the vaccinated (Table 2). This was due to a differential effect of VAS according to vaccination type. Among girls who had already received MV at enrollment, VAS was associated with significantly higher mortality. This was only seen in girls who were missing doses of DTP at enrollment and were therefore likely to receive them during follow-up (Table 5)." Benn et al. 2009, p. 635.
- 326
"To the contrary: the evidence, supported by many years of my own experience both in the field and in international policy-making committees, which is shared by many colleagues, is that the vitamin A programmes are ineffective. They use up precious human and material resources. Most of all, they impede other approaches to the prevention of vitamin A deficiency, best initiated at national and local level, which need much more support. These include breastfeeding, and the protection and development of healthy, affordable and appropriate food systems and supplies. Such approaches also protect against other diseases, are sustainable, enhance well-being, and have social, cultural, economic and environmental benefits." Latham 2010, p. 15.
- 327
- Weaknesses in the evidence that VAS reduces child mortality: We discuss our view of the evidence in detail in the section above. We apply a -25% internal validity adjustment to account for the risk that the main finding from the Cochrane meta-analysis is inflated because of weaknesses in the underlying trials.
- Uncertainty about whether VAS is likely to reduce mortality in contemporary health environments: We account for this with our external validity adjustment (-41% to -79% across locations).
- Health risks: We discuss these in the section above.
- Diverting attention and resources away from other public health programs: We account for this through a best guess that 30% of the costs of VAS programs are in-kind government resources like staff time in our cost analysis (more). This should be seen as a rough best guess because it is based on a single ~10 year old study of a deworming program, and our analysis also assumes, based on a rough analysis, that these government resources would have been spent on considerably less cost-effective programs if they were not used for VAS (more).
However, note that we haven’t reviewed Latham 2010 or Mason et al. 2018 in detail, and so it’s possible that there are criticisms in these commentaries we haven’t yet considered.
- 328
- Guinea-Bissau:
- Bangladesh: Nielsen et al. 2021.
- Ghana: Welaga et al. 2023.
- 329
"The starting point is four epidemiological studies from Guinea-Bissau[11, 12], Bangladesh[13] and Ghana (Welaga P et al, in press with EClinicalMedicine), aiming to study the effect of national immunization campaigns with oral polio vaccine (OPV), but also investigating the effect of other campaigns at the same time, as control exposures. They cover a period from 2002-2014 (Guinea-Bissau), 2004-2019 (Bangladesh) and 1996-2015 (Ghana), respectively.
National immunization campaigns are essentially a natural experiment. We assumed that all eligible children would participate in the campaign and thus children could contribute risk time both as unexposed (prior to a given campaign) and exposed (after the campaign) This eliminates a good deal of confounding from e.g., socioeconomic status (SES) or education. However, it is possible for time-varying covariates to alter the observed effects, and analyses were therefore adjusted for potentially relevant covariates. The studies compared the mortality rate after campaigns with the mortality rate before campaigns in Cox regression models with age as the underlying time scale. Hence, age was inherently controlled for. Children were followed until 36 months of age, movement, death or end of study period, whichever came first.Study population: For the present preliminary analysis, I extracted the estimates from the published papers. The two Guinea-Bissau studies are almost overlapping: one is based on the data from within seven randomised trials, the other is based on the data from the overall HDSS from the same period. Part of the children in the randomised trials were from outside the HDSS. For the final analysis, we will include those children as well. For the purpose of this analysis, we just did it with the basis of the HDSS. The inclusion of the children outside the HDSS is unlikely to change the conclusions.
Age groups: The estimates are based on models that estimated OPV campaign effects from age 0 months to 5 years. For the final meta-analysis, we will conduct the analysis from 6 months onwards. However, very few children received VAS prior to 6 months, and therefore this change in age group will be unlikely to change conclusions substantially.
On the next page follows the meta-analysis (random effects analysis) of the effect of VAS given with or without deworming, in all children and in males and females where data was available." Benn, Feedback on GiveWell vitamin A supplementation research, December 2023 (unpublished)
- 330
An alternative version of the meta-analysis, using a fixed-effects analysis, finds a statistically significant increase in mortality of 18% (relative risk 1.18, 95% CI 1.06 - 1.31). We primarily report the random-effects analysis because our understanding is that this method is more appropriate when there is significant heterogeneity between study contexts.
However, we note that the Cochrane Handbook reports that fixed-effect methods are more appropriate for situations where outcomes are "rare". There does not appear to be an agreed-upon threshold for what makes an outcome "rare", and so in this case we’re unsure which method is more appropriate to use.
"Methods that should be avoided with rare events are the inverse-variance methods (including the DerSimonian and Laird random-effects method) (Efthimiou 2018). These directly incorporate the study’s variance in the estimation of its contribution to the meta-analysis, but these are usually based on a large-sample variance approximation, which was not intended for use with rare events. We would suggest that incorporation of heterogeneity into an estimate of a treatment effect should be a secondary consideration when attempting to produce estimates of effects from sparse data – the primary concern is to discern whether there is any signal of an effect in the data."
"There is no single risk at which events are classified as ‘rare’. Certainly risks of 1 in 1000 constitute rare events, and many would classify risks of 1 in 100 the same way. However, the performance of methods when risks are as high as 1 in 10 may also be affected by the issues discussed in this section. What is typical is that a high proportion of the studies in the meta-analysis observe no events in one or more study arms."
Deeks et al., Cochrane Handbook for Systematic Reviews of Interventions, section 10.4.4 "Meta-analysis of rare events." Accessed February 16th, 2024. - 331
Benn, Feedback on GiveWell vitamin A supplementation research, December 2023 (unpublished).
- 332
Dr. Benn noted that the same analysis indicated that oral polio vaccine (OPV) campaigns were associated with a significant reduction in mortality, and she did not know of biases that could explain the different results for OPV and VAS. Christine Benn, email to Givewell, February 9th, 2024 (unpublished).
- 333
Hombali et al. 2019 is a systematic review and meta-analysis of the impact of staple food fortification on vitamin A deficiency. It found some limited evidence that fortification programs reduce deficiency, although this was based on very low-certainty evidence and the confidence intervals were extremely wide:
- Impact of fortification on subclinical deficiency: risk ratio 0.45 (95% CI 0.19 to 1.05), two studies.
- Impact of fortification on night blindness: risk ratio 0.11 (95% CI 0.01 to 1.98), one study.
"Staple food fortified with vitamin A versus unfortified staple food
We are uncertain whether fortifying staple foods with vitamin A alone makes little or no difference for serum retinol concentration (mean difference (MD) 0.03 μmol/L, 95% CI −0.06 to 0.12; 3 studies, 1829 participants; I² = 90%, very low‐certainty evidence). It is uncertain whether vitamin A alone reduces the risk of subclinical vitamin A deficiency (risk ratio (RR) 0.45, 95% CI 0.19 to 1.05; 2 studies; 993 participants; I² = 33%, very low‐certainty evidence). The certainty of the evidence was mainly affected by risk of bias, imprecision and inconsistency.
It is uncertain whether vitamin A fortification reduces clinical vitamin A deficiency, defined as night blindness (RR 0.11, 95% CI 0.01 to 1.98; 1 study, 581 participants, very low‐certainty evidence). The certainty of the evidence was mainly affected by imprecision, inconsistency, and risk of bias." Abstract. - 334
Rahmathullah et al. 1990 (one of the VAS trials in the Cochrane meta-analysis) found that regular, low-dose supplementation (8,333 IU) once a week reduced mortality by 54%.
"We conducted a randomized, controlled, masked clinical trial for one year in southern India involving 15,419 preschool-age children who received either 8.7 μmol (8333 IU) of vitamin A and 46 μmol (20 mg) of vitamin E (the treated group) or vitamin E alone (the control group). Vitamin supplements were delivered weekly by community health volunteers who also recorded mortality and morbidity. Weekly contact was made with at least 88 percent of the children in both study groups. The base-line characteristics of the children were similar and documented a high prevalence of vitamin A deficiency and undernutrition.
RESULTS.
One hundred twenty-five deaths occurred, of which 117 were not accidental. The risk of death in the group treated with vitamin A was less than half that in the control group (relative risk, 0.46; 95 percent confidence interval, 0.30 to 0.71). The risk was most reduced among children under 3 years of age (6 to 11 months — relative risk, 0.28; 95 percent confidence interval, 0.09 to 0.85; 12 to 35 months — relative risk, 0.46; 95 percent confidence interval, 0.26 to 0.81) and among those who were chronically undernourished, as manifested by stunting (relative risk, 0.11; 95 percent confidence interval, 0.03 to 0.36). The symptom-specific risk of mortality was significantly associated with diarrhea, convulsions, and other infection-related symptoms." Abstract. - 335
"Preschool children in control villages died at 1.8 times the rate of children in program villages." Muhilal et al. 1988, abstract.
Note: the reported odds ratio for under-5 mortality in children 12-60 months is 1.87 [1.41, 2.48] (table 6). The denominator and numerator are reversed relative to how they are typically reported (taking the inverse yields an odds ratio of 0.53). - 336
Our best guess is that Global Affairs Canada’s grant to UNICEF for programs including VAS has been roughly $10m per year since 2016 (GiveWell first began supporting Helen Keller for VAS in 2017). This is based on:
- Its 2016-2022 grant for Child Health Days (covering a variety of child health programs including VAS) in 15 sub-Saharan African countries being $75m over roughly 5 ½ years (approximately $10m USD, assuming the $75m is Canadian dollars).
- Helen Keller informed us in 2023 that UNICEF had received a renewal grant of $25m USD for VAS from mid 2023 to the end of 2025 (equating to approximately $10m a year).
"UNICEF received a USD $25 million grant from Global Affairs Canada to support VAS in 15 countries (Angola, Benin, Burkina Faso, Cameroon, CAR, Chad, Cote d‘Ivoire, DRC, Guinea, Madagascar, Malawi, Mozambique, Sierra Leone, Sudan, Togo) from mid-2023 to end-2025 (5 Semesters). However, considering that some funds will be used for global studies and not all funds can be directly allocated to VAS support in the field, the actual direct VAS delivery support per semester and per country is less than USD $200,000. As a result, UNICEF has informed Helen Keller that it can no longer provide significant support for VAS in most countries. For instance, in Cameroon, Helen Keller had to cover the entire country in 2023, which doubled the number of targeted children and the required funding for the campaigns." Helen Keller Intl, Room for More Funding Report, 2023, p. 2.
- 337
This understanding is based on information from Helen Keller that UNICEF’s funding for VAS has declined in specific countries. "In 2021, Helen Keller International significantly increased its support for Vitamin A Supplementation (VAS) in multiple countries following the large reduction in funds available from one of the main VAS supporters--UNICEF. With support from GiveWell, Helen Keller was able to close part of the funding gap and distributed ~50 million capsules through semi-annual VAS campaigns in 2021. More recently, reductions in UNICEF VAS funding in 2022 were less severe overall, but remain significant in countries such as Kenya, Nigeria or Niger. Although UNICEF thought it could provide greater support to Guinea, Mali and Côte d’Ivoire in 2022, their actual level of support remains lower than in the previous years. The likelihood of increased UNICEF support in these countries in the near future is low. Filling UNICEF’s funding gaps has led Helen Keller to spend higher amounts of GiveWell funds than initially budgeted, causing estimated funding gaps in each country beginning in 2024 and creating 'room for more funding' for these countries." Helen Keller Intl, Room for More Funding Report, 2022, p. 2.
- 338
"WHO recommends that consideration be given to mass drug administration of azithromycin to children 1 to 11 months of age for prevention of childhood mortality in sub-Saharan African settings in which:
- infant mortality is > 60 per 1000 live births or under-five mortality is > 80 per 1000 live births respectively, and
- infant and under-five mortality rates, adverse effects and antibiotic resistance (AMR)
are continuously monitored, and
implementation of existing child survival interventions, including seasonal malaria chemoprophylaxis where recommended, is concurrently strengthened.
(Conditional recommendation, low quality evidence)." WHO, Guideline on mass drug administration of azithromycin to children under five years of age to promote child survival, 2020, p. ix. - 339
Azithromycin is hypothesized to avert mortality through its effect on respiratory infection, diarrhea and malaria in particular, and we think that the main impact of VAS is averted diarrhea mortality, although there’s significant uncertainty around both of these. See this section of our separate report on azithromycin for more details.
- 340
Oral rehydration solution.
- 341
We estimate that each dollar donated to GiveDirectly’s direct cash transfer program generates 0.00335 units of value. 0.005 / 0.00335 = ~1.5.
- 342
We estimate that each dollar donated to GiveDirectly’s direct cash transfer program generates 0.00335 units of value. 0.006 / 0.00335 = ~1.8.
- 343
We estimate that each dollar donated to GiveDirectly’s direct cash transfer program generates 0.00335 units of value. 0.012 / 0.00335 = ~3.5.
- 344
Note that these figures don’t correspond with the proportion of costs paid by different actors in this section of our cost-effectiveness analysis. We estimate that for each $1m spent by Helen Keller in Guinea, Nutrition International incurs ~$88,000 in costs and the Guinea government incurs ~$543,000.
The reason the figures above are smaller than this is that some program costs are also borne by other philanthropic actors (in Guinea, WHO). Our best guess is that if Helen Keller didn’t fund the program, these costs would be unaffected and the Guinea government / Nutrition International costs would shrink proportionally to WHO’s costs. These are around 15% as large as Helen Keller and WHO’s costs combined. ~543,000 x 15% = ~$460,000 and ~$88,000 x 15% = ~$75,000. See this cell and this cell in our cost-effectiveness analysis for our calculations.
- How much do Helen Keller’s activities lead to increases in VAS coverage? We do not have direct evidence that GiveWell funding for VAS leads to increases in VAS coverage (e.g., from coverage surveys immediately before we started to fund VAS in a given location, and immediately afterwards). Instead, we rely on inferring coverage increases from the proportion of children reached in Helen Keller-supported campaigns, and rough estimates of how many children would have been reached in the absence of these campaigns. We would expect this to be less reliable (discussion in footnote).46