In a nutshell
New Incentives offers small cash incentives to increase coverage of routine childhood vaccination in northern Nigeria. GiveWell believes that its program is one of the most cost-effective opportunities that donors can support. We estimate that it costs approximately $1,500 to $6,000 to avert a death in areas where New Incentives works. That’s because:
- Based on a randomized controlled trial of the program, we estimate New Incentives' program leads to a substantial increase (9 - 18 percentage points) in the proportion of vaccinated children.
- Vaccination substantially reduces child mortality from vaccine-preventable diseases (we estimate by approximately 50% overall).
- Vaccination probably leads to other benefits like reduced mortality at older ages and increases in income later in life.
Our main reservations are:
- Vaccination rates have been increasing over time in northern Nigeria regardless of the program, and we’re unsure whether our analysis is adequately accounting for this.
- The program involves large-scale handling of cash and, by its nature, is a target for fraud. New Incentives has many systems in place to prevent and detect fraud, but it remains a meaningful risk.
- We expect the program will cause a small reduction (1-3 percent) in vaccination rates in the first few years after it is discontinued and incentives are withdrawn. We account for this possibility in our analysis and still think the program will be highly positive in aggregate in the locations where GiveWell supports it. The evidence on this question is very limited, and we may be under (or over) estimating the effect of the program after it ends.
Our separate page on how New Incentives’ program works is available here, and our cost-effectiveness analysis is here.
Published: December 2024
Previous versions of this page:
- September 2024 version
- April 2024 version
- December 2021 version
- May 2021 version
- November 2020 version
Summary
Basics
New Incentives runs a conditional cash transfer (CCT) program in northern Nigeria. The program primarily aims to increase vaccination rates through distributing cash incentives. Caregivers who bring their children for routine vaccinations, which are provided through government clinics free of charge, can receive a total of 6,000 naira (about $5) over six visits. As of September 2024, New Incentives is planning to offer an additional 5,000 naira incentive at the measles 2 vaccination visit for caregivers whose infants completed the entire routine immunization schedule. This would bring the total incentive amount to 11,000 naira (or about $9.50).
Clinic staff employed by the government conduct the vaccinations themselves, while New Incentives' field officers check children’s eligibility, enroll children into the program, and distribute cash incentives. (More)
New Incentives also conducts awareness-raising activities and aims to ensure sufficient vaccine supply by working with partners to address bottlenecks in the vaccine supply chain (see our separate report on New Incentives as an organization for more detail). Around a third of GiveWell’s funding for New Incentives is used for cash incentives, with the rest going to staff costs, distribution and transport costs, awareness-raising activities, and other costs (see here in our separate report on New Incentives).
How cost-effective is it?
We estimate that it costs approximately $1,500 to $6,000 (depending on the specific state)1 to avert a death through the program in the areas where New Incentives works. We also estimate that the program equates to being 9x - 38x as effective as spending on unconditional cash transfers (GiveWell’s benchmark for comparing different programs).
In simple terms, we think New Incentives’ program is cost-effective because:
- New Incentives' program increases the number of children who receive routine vaccines. Vaccination rates in northern Nigeria are low (~40% to ~70% in locations where New Incentives works), and we think New Incentives’ program addresses some of the barriers to vaccination (e.g., opportunity costs of taking children to clinics and perceived low value of vaccinations). (More) Extrapolating from the results of a randomized controlled trial (RCT) of New Incentives' program and triangulating against other studies of vaccine incentive programs, we estimate the program increases vaccination rates by approximately 9 - 18 percentage points in areas where it now works. (More)
- Child mortality is very high in northern Nigeria, and we’d expect many children to die from vaccine-preventable diseases without vaccination. We estimate that unvaccinated children under the age of five have an approximately 3% to 8% chance of dying from vaccine-preventable diseases before their fifth birthday in the locations where New Incentives works. Our analysis is mainly based on estimates of mortality from vaccine-preventable disease from the Global Burden of Disease (GBD) model. (More) We also estimate that vaccines indirectly avert about 0.75 deaths for every death they directly avert from the disease they target. This is based on evidence that vaccination programs sometimes have larger impacts on mortality than would be expected from their impact on the diseases they target alone (more).
- The vaccines that New Incentives incentivizes are effective at reducing mortality. Based largely on evidence from vaccine RCTs, we estimate that being vaccinated reduces a child’s mortality risk from vaccine-preventable diseases by approximately 50% - 55% from the point of vaccination up to age five (more). Our impression is also that routine childhood vaccination is widely viewed in the global health community as an effective way to reduce child mortality, strengthening our confidence in these estimates. (More)
- While the per-child cost of this program is higher than many other programs we fund, the benefit per child enrolled is also very high. This program provides cash transfers to caregivers, a cost not incurred by many other programs we fund. It also relies on a large network of in-country staff to disburse the cash transfers. We currently think that each child enrolled in the program costs New Incentives approximately $18 (more), compared to a cost per child of approximately $5 to $6 per year for Malaria Consortium's seasonal malaria chemoprevention (SMC) program. Although the per-child cost is high, we estimate that New Incentives' program is above our cost-effectiveness bar in many areas because vaccines are highly effective at averting mortality.
- We think New Incentives’ program leverages a large amount of external funding and is unlikely to be funded by other actors if we did not fund it. We attempt to adjust our cost-effectiveness analysis to account for the impact of the program on other actors’ spending. In this case, we think New Incentives’ program leverages a large amount of funding from Gavi and the Nigerian government (who pay for purchasing the vaccines and the staff to administer them). This increases our cost-effectiveness estimate because we think that the leveraged funding would have otherwise gone to less cost-effective programs (more). We also think that the program, or a similar vaccine incentive program, would be unlikely to be funded by other actors if we did not fund it (because we have seen relatively little interest from other actors in funding comparable programs). We account for the chance that another actor would fund the program or a similar one in GiveWell’s absence with a downward adjustment of approximately 10%, which is small compared to some other programs we fund (more).
- In addition to averting child mortality, we think that the program probably results in various additional benefits. These include:
- Reduced mortality for children in later life, because we think vaccines provide some long-term protection against disease. This accounts for 10% to 13% of the benefits we model, varying by state (more).
- Increased income for children in later life, by averting disease in a sensitive developmental period of childhood. This accounts for approximately 20% of the benefits we model (more).
- Increased consumption for children and their families in the short term because of the cash incentives themselves. This accounts for around 2% to 9% of the benefits we model, varying by state (more).
- Various other benefits that we don’t model and apply as percentage best guesses. These include reduced morbidity from disease and averted costs that would have been spent on treatment of disease. These increase our cost-effectiveness estimate by 50% (more).
We use a cost-effectiveness analysis to quantify our reasoning. Here is a summary of our analysis, using one state, Bauchi, as an example.
| What we are estimating | Best guess | Confidence intervals (25th - 75th percentile) |
Implied cost-effectiveness |
|---|---|---|---|
| Donation to New Incentives (arbitrary value) | $1,000,000 | ||
| Cost per child enrolled in the program (more) | $18.21 | $14.57 - $21.86 | 25x - 17x |
| Number of children enrolled in the program per $1m | ~54,900 | ||
| Proportion of children enrolled who would be vaccinated in the absence of New Incentives’ program (more) | 81% | 69% - 94% | 33x - 7x |
| Additional children vaccinated because of the program per $1m spent by New Incentives | ~10,200 | ||
| Probability that unvaccinated children die before their fifth birthday from vaccine-preventable disease (more) | 5.7% | 3.7% - 7.6% | 13x - 27x |
| Effect of vaccines on vaccine-preventable disease mortality through fifth birthday (more) | 52% | 42% - 63% | 16x - 24x |
| Initial cost-effectiveness estimate | |||
| Cost per death averted (child mortality only) | ~$3,300 | ||
| Moral weight for each death averted | 116 | ||
| Subtotal: Cost-effectiveness estimate from child mortality benefits | 10x | ||
| Summary of primary benefit streams (% of modeled benefits) | |||
| Reduced under-five mortality | 63% | ||
| Reduced mortality for older children and adults (more) | 12% | 5% - 17% | 18x - 22x |
| Income increases in later life (more) | 21% | 0% - 34% | 16x - 24x |
| Short-term consumption increases (more) | 5% | 2% - 7% | 19x - 20x |
| Additional adjustments | |||
| Adjustment for additional program benefits and downsides (more) | 50% | 23% - 78% | 16x - 24x |
| Adjustment for grantee-level factors (more) | -7% | -12% - -2% | 19x - 21x |
| Adjustment to account for crowding funding into the program (more) | -4% | ||
| Adjustment to account for crowding funding out of the program (more) | -9% | -16% - -3% | 18x - 21x |
| Overall cost-effectiveness (multiples of cash transfers) | 20x | 6x - 34x | |
We’ve also considered other perspectives that might not be captured explicitly in these cost-effectiveness estimates (e.g., whether experts see New Incentives as a good program). Overall, none of the work we’ve done on these questions has substantially undermined our view that the case for New Incentives is strong.
However, we have spent considerably less time on these questions than we have on our main cost-effectiveness model. We hope to engage more with them in the future. (More)
How could we be wrong?
Overall, we are reasonably confident in the case for New Incentives’ program, and our level of uncertainty is in a similar range to GiveWell’s other top charities. New Incentives’ program is more complex than these other programs (implying additional uncertainty) and may have a higher risk of unintended negative consequences (e.g., risk of fraud, potential for backlash if the program ends). However, we think it is less likely that New Incentives’ program or similar programs would be funded in GiveWell’s absence than for other top charities, giving us confidence that our funding is leading to additional positive impact.
Our key open questions:
- Are we adequately accounting for increases in vaccination rates that would have taken place anyway? The RCT found a substantial increase in control group vaccination rates over the course of the study. Other sources of data also show vaccination rates were increasing in northern Nigeria before New Incentives began scaling up. Because we’d expect the program to be less effective in areas with higher baseline coverage, this raises a concern that the impact in the future will be smaller than the impact observed in the RCT. We currently account for this by assuming vaccination coverage will continue to improve by the same rate seen in the years before New Incentives' scale up (2013-2021). However, our estimates could be meaningfully off in either direction. We also haven’t deeply investigated what other programs are being delivered to increase vaccination rates in northern Nigeria, which increases our uncertainty on this issue. (More)
- How reliable are the mortality estimates we rely on? Our cost-effectiveness analysis uses estimates of mortality from IHME's Global Burden of Disease (GBD) Project. These estimates are based on a number of modeling assumptions that we have not reviewed in detail, and we have substantial uncertainty about them. While we use GBD estimates across a number of our programs, we are particularly uncertain in this case because our analysis requires us to take a stance on the proportion of each cause of death attributable to different pathogens (e.g., the share of diarrhea deaths attributable to rotavirus), which adds additional uncertainty. We also assume that 0.75 deaths are indirectly attributable to vaccine-preventable disease for every death directly attributed to these diseases. This is a rough best guess and could be improved with further research. (More) Our 25th - 75th percentile confidence interval for a child’s probability of death before age five in Bauchi is 3.7% to 7.6%. This implies a program cost-effectiveness of 13 to 27 times as cost-effective as direct cash transfers (“13x-27x”).
- How effective are vaccines at reducing mortality in Nigeria? We’ve reviewed evidence which suggests that the measles and BCG vaccines might be less effective in Nigeria, and we think it is plausible that vaccine effectiveness may generally be lower in settings where proper storage and handling of vaccines is more difficult. We adjust for this risk in our analysis (reducing our estimate of vaccine efficacy for all vaccines by around 14%). But our adjustment is very speculative and further research could lead us to update this upward or downward.. (More) Our 25th - 75th percentile confidence interval for vaccine efficacy against vaccine-preventable disease (which incorporates this adjustment) is 42% to 63%, implying a cost-effectiveness of 16x to 24x in Bauchi.
- How will the effect of New Incentives' program in states with higher vaccine coverage compare to the effect in the RCT of the program? Our understanding of the effect of New Incentives' program on vaccination rates is largely based on the results of an RCT of the program conducted in Jigawa, Katsina, and Zamfara in 2017-2020. We extrapolate the RCT results to other states based on their vaccine coverage rates, but we are unsure how well these results will translate to new states. (More) New Incentives has begun to conduct vaccine coverage surveys in areas where it works, and we plan to use these as another source to check that the program is having the expected effect at scale. But we’ve only just started to analyze these surveys (as of February 2024), and don’t incorporate them into our analysis yet. (More)
- How high is the risk of fraud? We’d expect fraud to be a significant risk for a program like New Incentives, which handles large volumes of cash. We currently account for this with an approximately -10% adjustment to the number of children enrolled (reflecting that some children may be enrolled multiple times) (more), and -2% adjustment to account for other ways New Incentives’ monitoring data could be wrong (including fraud) (more). New Incentives has a number of systems to monitor and prevent fraud, but it’s possible that there are types of fraud these are unable to detect. We discuss this issue in detail on a separate page.
- Are we properly accounting for the community-level benefits of vaccines? Our analysis is based on the impact of vaccination for individual recipients reported in RCTs. We use rough supplementary adjustments of approximately 25% to account for the impact of increased vaccination on disease transmission, including during outbreaks, and the potential for development of herd immunity. (More) Incorporating these as percentage guesses allows us to use a relatively simple main cost-effectiveness model. However, our understanding is that community-level benefits are considered one of the major benefits of vaccination, and it's possible that explicitly modeling them could change our estimates up or down. We plan to get more input from epidemiologists and disease modelers on our analysis in the future. (More)
- What happens to vaccination rates if the program ends? By introducing a financial incentive for vaccination, New Incentives' program may lead to lower vaccination rates after the program is discontinued than there would have been if the program had never been implemented. We also think it’s possible that the program could lead to longer term increases in vaccination by changing social norms and increasing knowledge about vaccination, or strengthening supply chains.
As of September 2024, we have investigated this issue at a moderate level of depth. Our best guess is that discontinuing New Incentives' program may lead to a roughly 1-3% drop in vaccination rates for subsequent children born to caregivers who previously had a child enrolled during the program. In our current cost-effectiveness analysis, we apply a -11% to -30% adjustment to states in Nigeria where New Incentives’ program does not currently operate. This adjustment aims to capture the potential impact from a decrease in vaccination rates if the program was introduced in these locations and then withdrawn. We view this adjustment as highly speculative because there is limited high-quality evidence on the effect of discontinuing an incentives program targeted at childhood immunizations in low- and middle-income countries. We see the long-term impact of program discontinuation as an important priority area for future research and plan to seek opportunities to generate additional evidence. (More)
- Will New Incentives maintain program quality at scale? Since the RCT, New Incentives has expanded quickly and is operating in nine states (as of September 2024). We think it’s plausible that this could lead the program to be delivered less effectively (e.g., if managers have less effective oversight, or vaccine supply is not able to keep up with demand). The monitoring data we’ve reviewed has remained broadly stable since the RCT, although we have seen an increase in supply problems for some vaccines. We interpret this to mean that New Incentives has been able to deliver the program to a similar high quality as it has grown, although we plan to keep monitoring this. (More)
- Are there errors in our analysis we’ve missed? Our analysis of New Incentives’ program is more complicated than most of the other programs we support, and the program is comparatively newer (meaning our analysis has been reviewed less rigorously). It’s possible that this increases the likelihood of errors that could affect our bottom line.
- How accurate was our analysis of New Incentives in hindsight? GiveWell’s cost-effectiveness analyses are “forward-looking” and aim to predict the impact a program will have at the time we make a grant decision. We have paid less attention to backward checks to understand how accurate the predictions in our New Incentives grants were. This is a weakness in our approach and something we aim to improve in the future. (More)
Note: The figures in this report are from our November 2024 cost-effectiveness analysis. Our estimates change over time as we gather new information and update our analysis, so the numbers in this report may not reflect the latest changes we have made. We aim to update this report on a roughly annual basis.
1. The basics of the program
1.1 What is New Incentives?
New Incentives runs a conditional cash transfer (CCT) program in northern Nigeria. The program aims to increase uptake of routine childhood vaccinations through cash transfers.
1.2 What are vaccines and how do they work?
Vaccines train the immune system to generate antibodies by introducing a killed or weakened form of a pathogen into the body.2 In recent decades, vaccination rates across the world have increased substantially for routine childhood vaccinations.3 However, Nigeria still has relatively low childhood vaccination rates4 and northern Nigeria in particular has lower rates of vaccination than the rest of the country.5
New Incentives' program targets uptake of routine childhood vaccinations given in the first two years of life. Nigeria’s routine childhood vaccination schedule is available here and is in line with other countries’ childhood vaccination schedules.6
1.3 How does the program work?
Caregivers who bring their children for routine vaccinations, which are provided through government clinics free of charge, can receive 1,000 naira at each of the six vaccination visits in the routine immunization schedule.7 As of September 2024, New Incentives is planning to offer an additional 5,000 naira incentive at the measles 2 vaccination visit for caregivers whose infants completed the entire routine immunization schedule. This would bring the total incentive amount to 11,000 naira (or about $9.50).8 Conditional cash transfer (CCT) programs like New Incentives’ have been used in many countries, often to incentivize uptake of other health services, or encourage school attendance.9
New Incentives directly incentivizes (i.e., makes cash transfers conditional on children receiving) the following vaccines, some of which are delivered in multiple doses:
- Bacille Calmette-Guérin (BCG) vaccine against tuberculosis
- Pentavalent vaccine (Penta) against diphtheria, tetanus, pertussis (whooping cough), hepatitis B, and Haemophilus influenzae type b
- Pneumococcal conjugate vaccine (PCV) against pneumococcal disease
- Measles vaccine (MCV)
The program also “indirectly incentivizes” a number of vaccines (the birth dose of hepatitis B, polio, meningitis A, yellow fever, and rotavirus vaccines) that are delivered at the same visits as the directly incentivized vaccines. Caregivers do not receive cash transfers for their child receiving these vaccines, but since they are delivered at the same visit as a directly incentivized vaccine, we expect there should be higher uptake of these vaccines as well. See the vaccination schedule below.10
| Age of visit | Directly incentivized | Indirectly incentivized |
|---|---|---|
| Birth | BCG | Hep B, OPV11 0 |
| 6 weeks | Penta1, PCV1 | OPV1, IPV1,12 Rotavirus |
| 10 weeks | Penta2, PCV2 | OPV2, Rotavirus |
| 14 weeks | Penta3, PCV3 | OPV3, IPV2, Rotavirus |
| 9 months | Measles1 | Yellow Fever, Meningitis A |
| 15 months | Measles2 | n/a |
The program operates mainly in government health clinics that partner with New Incentives. Clinic staff employed by the government conduct the vaccinations themselves, while New Incentives field officers check children’s eligibility, enroll children into the program, and distribute cash incentives.
New Incentives also conducts awareness-raising activities to increase demand for vaccination and various activities to identify and address bottlenecks in the vaccine supply chain. See our separate review of New Incentives for more details on how the program works.
2. How GiveWell estimates cost-effectiveness
GiveWell recommends programs that we believe save or improve lives as much as possible for as little money as possible. To estimate this, we produce a cost-effectiveness analysis (“CEA”) which aims to produce a best guess of the overall impact of a program per dollar donated.
We use "moral weights" to quantify the benefits of different impacts (e.g., increased income vs reduced deaths). We benchmark to a value of 1, which we define as the value of doubling someone’s consumption for one year. The main moral weights we use for our analysis of New Incentives are in the table below.
| Benefit | Moral weight (units of value per outcome) |
|---|---|
| Doubling consumption for one person for one year | 1 |
| Averting the death of a child under five from vaccine-preventable diseases | 116 |
| Averting the death of a child aged 5 - 14 from vaccine-preventable diseases | 134 |
| Averting the death of an adult aged 15 - 49 from vaccine-preventable diseases | 104 |
| Averting the death of an adult aged 50 - 74 from vaccine-preventable diseases | 42 |
| Increasing someone’s annual consumption from a baseline of $286 by $1.22 per year | 0.01 |
As of September 2024, New Incentives’ program is operating in nine states in Nigeria.13 Unless mentioned otherwise, all ranges throughout the report refer just to these states.
This report and accompanying cost-effectiveness analysis include 25th - 75th percentile confidence intervals for specific parameters and our bottom-line cost-effectiveness estimate. See the summary table above and this sheet of our cost-effectiveness analysis. These intervals are based on GiveWell staff members’ subjective levels of uncertainty for each parameter (see footnote for more details on our method).14 Given our subjective inputs and simplified approach, we don’t think these intervals should be taken literally, but think they help to convey: i) how uncertain our cost-effectiveness estimates are; ii) how this varies between programs.
3. How many people does New Incentives reach?
3.1 Summary
The starting point for our analysis is the number of additional children vaccinated as a result of New Incentives’ program.15 We estimate that each $1 million spent16 by New Incentives leads to approximately 6,600 to 17,300 additional children being vaccinated (varying by state).17 This equates to ~$50 to $150 per additional child vaccinated.18 A summary of our calculations is below, using one state (Bauchi) as an example:
| What we are estimating | Value (rounded) |
|---|---|
| Donation to New Incentives (arbitrary value) | $1,000,000 |
| Cost per child enrolled in the program (more) | $18.21 |
| Number of children enrolled | ~54,900 |
| Proportion of vaccinated children who would have been vaccinated without New Incentives’ program (more) | 81% |
| Total (additional children vaccinated as a result of New Incentives’ program) | ~10,200 |
Some of the main uncertainties in our estimates are:
- We extrapolate the RCT results (from three states in Nigeria) to the larger group of states where New Incentives now works. To do this, we assume a linear relationship between program effect and baseline vaccination coverage. This fits with our intuitive impression that the program effect would decrease as vaccine coverage increases. But it could be wrong if, for example, the impact of the program began to drop rapidly in states with higher levels of vaccination coverage. (More)
- The RCT results that we rely on to estimate the program’s impact show the largest impact of a vaccine incentive program in any published study we have reviewed. This raises a concern that the results are overestimated because of chance or weaknesses in the study design we have not identified. We account for this with a -12% adjustment, but we’re unsure how much weight to put on the RCT results versus other evidence. (More)
3.2 How much does the program cost?
Summary
As of September 2024, we estimate that it costs New Incentives $18.21 to enroll one child in its program.19 We also estimate it costs the Nigerian government and Gavi $34.29 and $28.64, respectively, in vaccination costs per child vaccinated, although we account for these costs separately through our adjustment for the impact on other actors’ spending (more below).
Our estimates change over time as we update our analysis and gather more data on the program. See this spreadsheet for our full calculations. A summary is below:
| What we are estimating | Value (rounded) |
|---|---|
| Total costs to New Incentives (2023) | ~$23.4 million |
| Total number of children enrolled (2023) | ~1.5 million |
| Subtotal: Cost per child enrolled, without adjustments | $15.41 |
| Adjustments (to account for repeat enrollments and New Incentives' 2024 cost assumptions) | $2.80 |
| Total: Cost to New Incentives per child enrolled | $18.21 |
| Costs to other actors (more) | |
| Cost to the Nigerian government per additional child vaccinated | $34.29 |
| Cost to Gavi per additional child vaccinated | $28.64 |
Cost per child enrolled
Our estimate of $18.21 per child includes all children enrolled, regardless of whether or not they receive their full course of vaccines, and regardless of whether or not we believe that they did so as a result of New Incentives' program.
To calculate this, we use data shared by New Incentives on its total program costs (including staff costs, incentives, etc.)20 and divide this by the total number of children enrolled, based on New Incentives' enrollment data. We use data from 2023 only (rather than taking a multi-year average) because program costs have been falling over time, so we would expect more recent costs to be a better indicator of future costs.21 In total, New Incentives reports spending $23.4 million and enrolling ~1.5 million children in 2023, implying a total cost of $15.41 per child enrolled.22
Our estimate of New Incentives' cost per child enrolled in 2024, $18.21, differs for the following reasons:
- Assumptions about 2024 costs: New Incentives is making some changes to its program in 2024 that we think should be factored into our cost per child estimate. Namely, New Incentives is planning to offer an additional 5,000 naira incentive for caregivers whose infants complete the full routine immunization schedule, and a monthly 5,000 naira stipend for government-employed clinic staff.23 To estimate cost per child with these program changes, we rely on New Incentives' estimates of how these changes will affect its costs. New Incentives estimates its cost per child enrolled in 2024 (before adjusting for repeat enrollments) would be $16.26. 24 Note that this estimate is only slightly higher than our 2023 cost per child estimate of $15.41. We believe this is a result of changes in the naira to USD foreign exchange rate that New Incentives expects to increase its purchasing power. New Incentives' 2024 cost per child estimate assumes a foreign exchange rate of 1,250 naira:USD, whereas the average foreign exchange rate it received in 2023 was approximately 790 naira:USD.25 While relying on New Incentives' projections may cause us to significantly over or underestimate New Incentives' cost per child for 2024, we were uncertain whether attempting to model the impact of the program changes ourselves would produce a more accurate estimate, and ultimately did not think the capacity tradeoff was worthwhile. We plan to review the actual cost data from 2024 during our next grant investigation and will update our cost per child estimate accordingly.
- Adjustment for repeat enrollments: Caregivers may be incentivized to enroll their children in the program multiple times in order to receive additional incentives, so we think that some children counted in New Incentives' estimates may be repeat enrollments. Our best guess is that ~10% of all enrollments are repeats, based on BCG scar rates (discussed below, calculation in footnote).26 We discount the total number of children enrolled by ~10%, because we think that these children are unlikely to benefit from receiving the same vaccine multiple times. With this adjustment, we estimate New Incentives' actual cost per child enrolled in 2023 was $17.26.27 Applying this adjustment to New Incentives' 2024 cost per child projection ($16.26) results in a cost per child estimate of $18.21. 28
Costs to other actors
By increasing the number of children vaccinated, we think New Incentives’ program leads to other actors incurring extra costs procuring, delivering, and administering the vaccines. We would guess that these costs are largely shouldered by the Nigerian government and Gavi.
We estimate that each additional child vaccinated costs the Nigerian government $34.29, and Gavi $28.64. These estimates are based on WHO data on routine vaccination costs and coverage in Nigeria between 2014 and 2018, estimates from the Global Burden of Disease project on the number of children in Nigeria under age 1 between 2014 and 2018, and rough guesses about how costs will be split between the government and Gavi over time (details in footnote).29 Our full calculations are on this sheet.
We think the Nigerian government's and Gavi’s costs are “leveraged”—i.e., New Incentives’ spending on the program results in more of these resources being used for vaccines and less for other activities that we think are less cost-effective. We account for this in our adjustment for other actors’ spending:
- We exclude these costs from the cost side of the cost-effectiveness equation in the main part of our analysis, and only consider costs to New Incentives itself.
- However, the benefit of these costs is already incorporated in our initial impact calculations (because New Incentives would not be able to deliver the program without them). To account for them on the benefits side, we adjust the impact of the program downward to account for those funds not being spent on something else. This decreases our initial estimate of the cost-effectiveness of the program by -3% to -7% overall (-4% in Bauchi).30
- We think this approach is the best way to account for situations where GiveWell funding diverts other actors’ spending from a less cost-effective to a more cost-effective use. See this blog post for more.
Shortcomings and uncertainties
Overall, we have a moderate level of confidence in our cost estimates. Our biggest points of uncertainty are:
- Could we be underestimating the risk of error or fraud in these estimates? Caregivers may be incentivized to enroll their children in the program multiple times, and if children counted as unique are actually duplicate enrollments, this implies we would be underestimating the cost per child enrolled. We adjust our estimates of the number of children enrolled by approximately -10% to account for this, and apply a separate -2% adjustment to account for other ways New Incentives’ monitoring data could be wrong (including fraud). But we’re not sure if we’ve properly accounted for all possible fraud risks, and we plan to investigate this in more detail in the future. We discuss our analysis of the data we’ve seen from New Incentives so far on this question on a separate page.
- New Incentives’ costs have been falling over time,31 and New Incentives is projecting its cost per child will remain fairly low in 2024, despite making program changes that, all else equal, would increase its cost per child. We think this projection could be off in either direction, but chose not to try to model this projection ourselves. We plan to update our cost per child estimate once we have cost data from 2024.
- Our estimates of the Nigerian government's and Gavi’s costs are based on some rough guesses (e.g., we roughly guess that 30% of routine vaccination costs are fixed costs). The estimates also use data between 2014 and 2018, and do not take into account any recent changes in vaccination costs (e.g., the addition of the rotavirus vaccine to Nigeria’s routine vaccination schedule). We have not prioritized more extensive work because our analysis is not very sensitive to these estimates, and so we think it is unlikely to change our bottom line.
- We tend to have greater confidence in estimates that we have cross-checked against independent data sources. This is challenging for New Incentives because its program is fairly unique. In 2023, we conducted an internal (unpublished) analysis of the proportion of costs that were incentives versus program overheads in New Incentives’ program compared to other cash transfer programs we know about. However, we didn’t find this very informative because there are substantial differences in how the programs work.
3.3 What is the impact of New Incentives’ program on vaccine coverage?
Summary
We estimate that baseline vaccine coverage in locations where New Incentives works is 39% - 68%, varying by state, and that its program increases vaccine coverage by 9 - 18 percentage points.32 Based on these, we calculate that 68% - 88% of the vaccinated children in each location receiving New Incentives’ program would have been vaccinated regardless of the program.33 We use this to estimate the number of additional children vaccinated as a result of the program (shown above).
A summary of our calculations for Bauchi state is in the table below.
| What we are estimating | Value (rounded) |
|---|---|
| Baseline vaccine coverage (more) | 56% |
| Increase in vaccination rates as a result of the program (more) | 13pp |
| Subtotal: Proportion of children vaccinated with New Incentives’ program | 69% |
| Total (proportion of vaccinated children who would have been vaccinated without New Incentives’ program) | 81% |
How many children would be vaccinated without New Incentives’ program?
We estimate that baseline vaccination coverage34 is 39%-68%, varying by location (56% in Bauchi).35
Our approach:
- The primary data we use comes from household surveys ("coverage surveys") conducted by New Incentives in each area that it considers for program expansion.36 These surveys typically cover only a subset of local government areas (LGAs) in a state.37 This means they provide a more granular picture of vaccine coverage than typical state-level estimates.
- The secondary data we use is from the 2021 MICS (Multiple Indicator Cluster Survey), a nationally representative survey of Nigeria run by UNICEF that has a module on childhood vaccinations.38 This data provides baseline coverage estimates for each state and for each vaccine type.39
- We assign different amounts of weight to each source depending on the state:40
- For states in which only some LGAs were covered by the coverage surveys, we place weight on the coverage surveys equal to the proportion of LGAs covered plus an additional 50% upward adjustment.
- We place more weight on the coverage surveys than MICS because they are more recent on average.
- If we have no coverage survey data for a state, we use MICS data only.41
- We make adjustments for the measles vaccine (where we use MICS data only), PCV vaccine (where we do not have data from the coverage surveys), and rotavirus vaccine (where we do not have data from either source) (details in footnote).42
We make three further adjustments to reach our final aggregate vaccine coverage estimates.
- Weighting vaccine coverage by contribution to reducing mortality. We want to convert coverage estimates for individual vaccine doses to a single aggregate estimate of baseline coverage. To do this, we weight the proportion of children who receive each vaccine dose by that dose’s contribution to reducing under-five mortality. This means that, for example, coverage of the second PCV dose contributes more to our aggregate coverage estimate than coverage of the measles vaccine, since the former drives a larger proportion of mortality reduction.43 Our calculations of each dose’s contribution to reducing under-five mortality take into account the mortality associated with the diseases targeted by each vaccine, vaccine efficacy against those diseases, and assumptions regarding how vaccine efficacy breaks down by dose for multi-dose vaccines (details in footnote).44
- Adjustment for self-report bias. We apply an adjustment for self-report bias of approximately +1% to the coverage survey data and approximately 0% to the MICS data (details on our method in footnote).45 Our estimates rely on caregivers reporting on their child's vaccination status, and we’d expect them to somewhat overreport this because of social desirability bias (the tendency of survey participants to overreport “good” behaviors). In fact, the coverage data we have seen suggests virtually no self-report bias when compared to data on BCG scarring rates. This is in contrast with data from the New Incentives RCT, which we think suggests self-report bias adjustment of -28%.46 We’re not sure how to explain this discrepancy (more below).
- Adjusting for improvements in vaccination coverage over time. Data from national surveys of vaccination coverage in Nigeria suggest that coverage was increasing in the years leading up to the scale up of New Incentives' program. We estimate that, between 2013 and 2021, the proportion of unvaccinated children in Nigeria decreased by roughly 5% each year.47 We would expect this trend to continue in the future, even in the absence of New Incentives' program. Not accounting for these improvements in vaccination coverage over time would likely cause us to overestimate the impact of New Incentives' program, since we assume the program's impact will be smaller in areas with higher baseline vaccination coverage. To account for improvements in counterfactual coverage (i.e. coverage in the absence of New Incentives' program), we take the proportion of unvaccinated children found in New Incentives' baseline coverage surveys and/or MICS 2021 (according to the approach described above) and reduce this proportion by 5% for every year between when those baseline estimates were measured and the middle year of the grant period we are investigating.48 For Bauchi, we start with an estimate of 53% of children being unvaccinated in the absence of New Incentives' program in 2022. Projecting forward to 2026, we estimate that the proportion of unvaccinated children will have fallen to 44%.49 Moving forward, we plan to review our methodology as additional national survey results become available, to see whether vaccination coverage in areas where New Incentives does not operate is increasing at a different rate than we have projected. We will focus in particular on states bordering areas where New Incentives operates.
The resulting estimates (39% - 68% coverage, varying by location) are in this row of our analysis.
How much does the program increase vaccination rates?
We estimate that New Incentives’ program increases childhood vaccination rates by 9 - 18 percentage points (varying by state, 13pp in Bauchi).50
- The primary evidence for the program's effect size comes from a GiveWell-funded randomized controlled trial (RCT). The RCT found that the program increased overall vaccination rates by 22 percentage points from a baseline level of 36% (more). We see this result as reasonably strong. We’ve also seen evidence that the most common barriers to vaccination in areas where New Incentives works are lack of awareness and ambivalence rather than vaccine hesitancy. This strengthens our confidence in the RCT result, because we think it’s plausible that the program would meaningfully address these barriers (more).
- To estimate the impact of the program at different levels of baseline vaccination coverage, we assume that New Incentives’ program leads, roughly, to a 33% reduction in the proportion of unvaccinated children in each state (the same as in the RCT).51 This assumes a linear relationship between baseline vaccination coverage and the program's effect. This captures the intuitive idea that the program's impact will be smaller in areas with higher baseline vaccination coverage and larger in areas with lower baseline vaccination coverage (more).
- We have cross referenced the New Incentives RCT against studies of other vaccine incentive programs. These generally find lower effect sizes. While we’d expect some of this to be explained by low baseline coverage in the RCT, we downadjust our estimates by 12% to account for the chance that the study estimate from the RCT is overestimated (more).
A summary of our calculations for one state, Bauchi, is below as an example.
| What we are estimating | Value (rounded) |
|---|---|
| Overall impact of the program on vaccination rates in the RCT (more) | 21 percentage points |
| Baseline vaccination coverage in the RCT (more) | 36% |
| Subtotal: Reduction in the % of children unvaccinated in the RCT (as a result of New Incentives’ program) | 33% |
| Adjustment for internal validity (more) | -12% |
| Subtotal: Adjusted reduction in the % of children unvaccinated in the RCT (as a result of New Incentives’ program) | 29% |
| Baseline vaccination coverage in Bauchi (discussed above) | 56% |
| Proportion of children who would be unvaccinated without New Incentives’ program in Bauchi | 44% |
| Total (adjusted increase in vaccination rates because of New Incentives’ program in Bauchi) | 13 percentage points |
Findings from a randomized controlled trial of New Incentives’ program
New Incentives’ program was tested in a randomized controlled trial (RCT) in three states in North West Nigeria in 2018-2020.52 The RCT was funded by a GiveWell grant and conducted by IDinsight.53
What was the program's effect on vaccination coverage in the RCT?
A total of 167 vaccination clinics were randomized to either deliver New Incentives’ program or to a control group.54 The RCT found significant increases in vaccination rates in areas served by the program, as reported by their caregivers in household surveys.55 There was a 14 to 21 percentage point increase in the study's three pre-specified primary outcomes — self-report of having received (1) the BCG vaccine, (2) the measles vaccine, and (3) any of the three doses of the Penta vaccine (see table below).56
| Vaccine | Point estimate of program impact | 95% confidence interval |
|---|---|---|
| BCG | 16pp | 12 - 21pp |
| Any dose of Penta57 | 21pp | 16 - 26pp |
| Measles | 14pp | 10 - 18pp |
Some of the vaccines in the program include multiple doses, and the RCT also measured the program’s impact on each directly incentivized vaccine dose.58 The impact measured varied from 14 percentage points (measles1) to 28 percentage points (Penta3).59 The program’s impact on the proportion of children fully vaccinated was 27 percentage points.60
To estimate the overall effect of the program on vaccination rates, we calculate a weighted average across all vaccine doses assessed in the RCT. We use (i) the RCT estimates of the program’s impact on the coverage of each vaccine dose and weight this by (ii) each vaccine dose’s contribution to reducing deaths among children under five.61 This is the same method we use to estimate aggregate baseline vaccine coverage (discussed above).
Using this method, we estimate that the overall impact of the program on vaccination rates in the RCT was 22 percentage points. See this sheet for our calculations and this section of our write-up for further details on our method.
What was baseline vaccination coverage in the RCT?
We estimate that vaccine coverage62 in the RCT control group was 36%.63 The proportion of children vaccinated in the control group varied between 27% (PCV3) to 63% (BCG), depending on the specific vaccine.64
We then make two adjustments to this data to reach our overall 36% estimate, in line with our method for estimating baseline coverage across states:
- Adjustment for self-report bias. We down-adjust our coverage estimates by 28%65 to account for self-report bias. We estimated the magnitude of this adjustment by comparing data on BCG scar rates to caregiver-reported BCG coverage. This adjustment uses the same method as we used to estimate self-report bias in our estimates of baseline vaccine coverage across states (discussed above), but finds a much higher level of implied bias (-28% vs +1%). We are not sure how to explain this discrepancy.
- Weighting vaccine coverage by contribution to reducing mortality. We aggregate vaccine coverage across doses by weighting the proportion of children who receive each vaccine dose by that dose’s contribution to reducing under-five mortality (as discussed above).
See this section of our analysis for calculations.
We note that the self-reported data in the RCT show a large increase in vaccination rates in control clinics from baseline to endline. At baseline in 2017, vaccination coverage rates in control areas were roughly 15% to 25% across vaccines. At endline in 2019-2020, they were approximately 30 - 40 percentage points higher, depending on the vaccine.66 While this increase in counterfactual coverage appears in self-reported data, clinic administrative records in control areas do not show any increase in vaccination volume since baseline.67
We were originally surprised by this large increase in control group vaccination rates. In 2023, we also received feedback from Dr. Jessica Cohen, Bruce A. Beal, Robert L. Beal and Alexander S. Beal Associate Professor of Global Health at Harvard University, expressing some uncertainty about the control group increase along with possible explanations.68 To investigate this question in more detail, we compared the RCT results against independent vaccine coverage surveys in 2016-2017, 2018, and 2021. While these survey results are noisy, we found that perhaps 40%, and plausibly substantially more, of this increase can be explained by a wider regional trend of increasing vaccine coverage around the time the RCT was conducted (details on our method in footnote).69 We discuss how we account for this trend in our analysis elsewhere in the report. Broad alignment between the RCT results and general regional trends slightly increases our confidence in the RCT.
Strengths and weaknesses of the evidence
Overall, we view the evidence for the main effect on vaccination rates as reasonably strong. Factors that give us confidence in this result include:
- GiveWell has followed this RCT closely and believes that it meets high quality standards.
- These findings are from a pre-registered RCT, which we believe reduces opportunities for researchers to publish only the most favorable results.70
- The computer code used to statistically analyze the data was checked by an external auditor.71
- The increase in treatment clinic vaccinations over and above increases in control clinic vaccinations occurs in clinic data (based on tally sheets that count the number of vaccinations given at each clinic by vaccine and by month)72 as well as self-report data.73
- IDinsight’s baseline program report found that the most commonly reported barriers among caregivers to getting their children vaccinated related to awareness of and ambivalence toward vaccines rather than mistrust or fear.74 We think it is intuitively plausible that cash incentives would be effective at tackling these barriers and increasing vaccination rates in the areas where New Incentives operates.
Our main remaining questions and concerns include:
- The RCT effect size is the largest we have seen in any vaccine incentives study. While we would expect some of this difference to be explained by the low level of baseline vaccine coverage in the New Incentives study areas, the New Incentives RCT remains an outlier even after accounting for this. We incorporate the findings of other studies’ lower effects through a downward adjustment for internal validity (discussed below). This modestly reduces our main estimate of the impact of the program, but it remains high relative to other studies we’ve reviewed.75
- We remain uncertain about our adjustment for self-report bias. In particular, we’re not sure how to explain the large gap between the high level of self-report bias implied by the RCT results, and the low level implied by New Incentives’ coverage surveys.
- GiveWell recommended the funding for the IDinsight RCT, and New Incentives had previously received “Incubation Grant” funding from GiveWell. This means there may be an incentive for GiveWell to review the results favorably.
- Checks against large-scale programs generally increase our confidence that results from experimental studies will hold up under real-world conditions. We have not yet validated our estimates (which are based on evidence from a single experiment) against studies of large-scale vaccine promotion programs. New Incentives has begun conducting large-scale coverage surveys in areas where it works to assess vaccine coverage over time, which will allow us to conduct this analysis. However, at the time of writing (February 2024), we have only just begun receiving this data and not yet incorporated it into our analysis (more on a separate page).
How does the impact that the program has on vaccination rates vary by location?
Extrapolating from the RCT results, we assume that New Incentives’ program leads, roughly, to a 33% reduction in the proportion of unvaccinated children in each state in Nigeria.76
This approach assumes a linear relationship between program effect and baseline vaccination coverage. We make this assumption since it is relatively simple to model and fits with our intuitive impression that the program effect would be lower in areas with higher vaccine coverage.
See this section of our analysis for our calculations.
Adjustment for internal validity
Finally, we apply a -12% internal validity adjustment to the estimate above. We use this adjustment because other studies of vaccine incentives that we reviewed have found smaller impacts than the New Incentives RCT, and we think that these studies also provide some useful information about the likely effect of New Incentives’ program. This reduces our best guess of the impact of New Incentives’ program to 9pp - 18pp (varying by state, 13pp in Bauchi).77 See this spreadsheet for our calculations.
Our approach
- We conducted a literature review and identified 13 studies of vaccine incentives, of which 7 were RCTs (including the New Incentives RCT, details in footnote).78
- We compared the impact of vaccine incentives on full vaccination rates, which almost every study reported and we would expect to be a relatively comparable measure.79 This comparison shows that the New Incentives RCT found the largest impact of any study (a 27pp increase in full vaccination rates compared to a range of 1 - 21pp in other studies).80
- We assigned a skeptical prior (a best guess about the expected impact of New Incentives’ program, based on the rest of the literature) of 16pp. While this is larger than all but one non-New Incentives study, we think this is reasonable because baseline vaccine coverage in the New Incentives study areas was low, and we think baseline coverage is likely to be negatively associated with program impact.81
- We subjectively assigned 70% weight to the New Incentives RCT findings, and 30% weight to our skeptical prior. These weights reflect that:
- We believe the New Incentives RCT is the most informative evidence about the likely impact of New Incentives' program (as it is a direct evaluation and we believe it was well-conducted).
- We apply some weight to other studies to account for the chance that the RCT effect size is overestimated because of chance or weaknesses in the study design we haven’t identified.
- Using this method implies a downward adjustment of approximately -12% (calculation in footnote).82
Shortcomings and uncertainties
- We used a relatively simple method for setting our skeptical prior, which only takes into account the average size of vaccine incentives and differences in baseline coverage across studies. We exclude incentive size from consideration because there doesn’t seem to be a relationship between incentive size and program impact in the studies we reviewed.83 However, it’s possible that there should be other dimensions feeding into this prior that we haven’t considered (e.g., operating environment, other components of the intervention other than cash incentives, etc.).
- The weights we assigned to each source of evidence are subjective, and it’s possible we should apply more or less weight to each.
It’s possible that further investigation would cause us to update our internal validity adjustment either up or down.
Effect of the program on uptake of the second dose of the measles vaccine
At the time of the RCT of New Incentives' program, the second dose of the measles vaccine had not been rolled out in Nigeria. New Incentives' program provides an incentive for caregivers who complete the second dose of the measles vaccine, and we expect the program to increase uptake of the second dose. As a rough guess, we assume that New Incentives' program has a 15% lower impact on uptake of the second dose of the measles vaccine compared to the first dose. 84
- This estimate is based on the understanding that the program is likely to have a smaller effect on the second dose due to its later timing—approximately six months after the first dose—and on New Incentives' program monitoring data, which shows that 86% of enrolled children who received the first dose returned for the second dose as of 2023.85
- We expect that program impact could improve as a result of the additional incentives that New Incentives will offer at the measles 2 visit for completing the full immunization schedule (see above). However, we view improving our estimates as a low priority because we think the second dose of the measles vaccine is likely to address a very small share of under-5 vaccine-preventable mortality (1%).86
4. What impact does New Incentives have?
4.1 Summary
Our cost-effectiveness analysis models four main benefits resulting from New Incentives’ program:
- Reduced mortality for children under age five from vaccine-preventable diseases (more).
- Reduced mortality for older children and adults (more).
- Long-term income increases from averting disease in a sensitive developmental window of childhood (more).
- Consumption benefits for households from the cash incentives themselves (more).
A summary of the contributions of each type of benefit to our total modeled estimate of the value of the program is below, using one state (Bauchi) as an example:87
| What we are estimating | % modeled benefits |
|---|---|
| Reduced mortality for children under age five | 63% |
| Reduced mortality for older children and adults | 12% |
| Long-term income increases | 21% |
| Consumption benefits | 4% |
The breakdown of the mortality benefits of the program between different vaccines is in the table below, also using Bauchi as an example. Note that this breakdown was last calculated in December 2024, and does not account for adjustments we have made to our model since then.88
| Vaccine | % mortality benefits in Bauchi |
|---|---|
| BCG | 16% |
| Penta | 22% |
| PCV | 27% |
| Rotavirus | 27% |
| Measles | 8% |
In addition to these four benefits, we also include a number of supplemental adjustments to account for additional benefits and offsetting impacts. Rather than explicitly modeling these, we have applied percentage adjustments based on our best guesses. We divide these into intervention-level factors (relating to conditional cash transfers for vaccination generally), which increase our cost-effectiveness estimate by 50% overall (more), and grantee-level factors (relating to the organization’s implementation of the program), which reduce our estimate by 7% (more).
After factoring in all these impacts (as well as our adjustments to account for the impact on other actors’ spending, discussed below), we estimate that it costs approximately $1,500 to $6,000 (varying by state)89 to avert a death through the program. In the sections below we discuss how we quantify each of these benefits.
Some of the main uncertainties in our estimates are:
- We’ve seen some evidence that vaccines are less effective in low- and middle-income countries (including Nigeria specifically). We account for this with an adjustment of approximately -14%, but this is based on limited data. (More)
- We use estimates of mortality from IHME's Global Burden of Disease Project. These are based on a number of modeling assumptions that we have not reviewed in detail, and we have some doubts about their reliability. (More)
- 10% to 13% of the impact that we model comes from reduced mortality in later life as children vaccinated today age. Because the studies we rely on measure the impact of vaccination in the short term, these long-term estimates rely on some very rough guesses about vaccine efficacy over time and the share of mortality that will be preventable by vaccines in the future. (More)
4.2 Reduced mortality for children under five
We estimate that each $1 million spent by New Incentives averts 134 to 584 deaths of children under age five, varying by location.90 A summary of our calculations is below, using one state (Bauchi) as an example:
| What we are estimating | Value (rounded) |
|---|---|
| Additional children vaccinated per $1 million spent by New Incentives (discussed above) | ~10,200 |
| Probability that an unvaccinated child will die of vaccine-preventable causes before age 5 (more) | 6% |
| Impact of vaccination on vaccine-preventable disease mortality (more) | 52% |
| Total (averted deaths of children under five) | 300 |
What is the probability of death among unvaccinated children?
Summary
We estimate that an unvaccinated child’s risk of death before age five due to vaccine-preventable disease91 in areas targeted by New Incentives’ program is 2.8% to 7.8%, varying by state.92 This estimate includes an assumption that vaccine-preventable diseases cause 0.75 deaths indirectly for every death directly attributed to vaccine-preventable disease (more) and an adjustment to account for unvaccinated children having higher-than-average mortality (more).
A summary of our calculations is below, using one state, Bauchi, as an example.
| What we are estimating | Value (rounded) |
|---|---|
| Probability of death from vaccine-preventable diseases for children before age 5 (vaccinated and unvaccinated), adapted from the Global Burden of Disease model (more) | 2.8% |
| Proportion of children vaccinated at the time of the GBD model (more) | 28% |
| Overall vaccine efficacy against vaccine-preventable disease (more) | 52% |
| Subtotal: Probability of death before age five from vaccine-preventable disease among unvaccinated children in Bauchi (more) | 3.2% |
| Indirect deaths averted from other causes for each vaccine-preventable disease death averted (more) | 0.75 |
| Total (Probability of death before age five attributable to vaccine-preventable disease among unvaccinated children) | 5.7% |
Probability of death among all children (vaccinated and unvaccinated)
Our estimates of vaccine-preventable disease mortality are drawn from the Institute of Health Metrics and Evaluation (IHME)'s Global Burden of Disease (GBD) project. Specifically, we use state-level estimates of a child’s probability of death from each of the diseases targeted by New Incentives’ program (see above for a full list) in the latest model available (from 2021).93 See this sheet for the full estimates for each vaccine-preventable disease in each state.
Adjustments for deaths taking place before vaccination and disease etiology
We make two adjustments to the raw GBD estimates:
- We remove deaths that we think are likely to occur before each vaccine is administered.94 For example, in Bauchi state we estimate that 10% of under-five meningitis deaths occur in the first six weeks of life, before the first doses of the PCV and HiB vaccines are scheduled.95
- Some of the diseases covered by these vaccines are caused by multiple pathogens (e.g., only a portion of diarrheal disease is caused by rotavirus). We count only the portion of deaths that we think are caused by the specific pathogens targeted by vaccination (e.g., 41% of diarrheal disease is caused by rotavirus).96
Our adjustments are based on disease etiology estimates from GBD for rotavirus, View-Hub for lower respiratory tract infections and meningitis, and Mahtab et al. 2024 for lower respiratory tract infections.
- View-Hub is a data visualization platform for vaccine-treatable diseases that we believe is likely to be a more reliable source than GBD for those diseases (details in footnote).97
- Mahtab et al. 2024 was a study conducted through the CHAMPS Network that analyzed the causative pathogens of pneumonia deaths in children aged 1–59 months in sub-Saharan Africa and South Asia from December 2016 to 2022.98 We use the results from Mahtab et al. 2024 to calculate an etiology adjustment for pneumococcal lower respiratory infections because we view them as the highest quality,99 contemporaneous estimates of pneumonia mortality etiology in a comparable setting (details in the footnotes).100 We put the most weight on data from countries with PCV vaccination rates which were most similar to Nigeria’s over the same period (details in the footnotes).101
- We’re highly uncertain how much weight to put on the findings of Mahtab et al. 2024 due to the small and potentially unrepresentative sample (more details on our reservations in the footnotes)102 and the PERCH study, which finds much lower etiological fractions of pneumonia due to bacteria like S. pneumoniae and HiB.103
After making these adjustments, we add the probability of death before age five for each disease together to estimate a total probability of death from all the diseases targeted by New Incentives’ program (e.g., 2.8% in Bauchi). See this row of our analysis.
Adjustment for higher mortality among unvaccinated children
Our understanding is that the GBD mortality estimates that we use represent mortality among all children, both vaccinated and unvaccinated. By contrast, we want to model the impact of vaccination on unvaccinated children (who we would expect to have higher mortality rates).
To account for this, we make an adjustment to estimate the mortality risk from each disease for unvaccinated children only.104 Our method has three inputs:
- The GBD probability of death estimates for all children (vaccinated and unvaccinated), discussed above (e.g., 2.8% in Bauchi).
- Vaccine efficacy against disease (e.g., 52% in aggregate in Bauchi). We discuss how we reach these estimates in detail below.
- Estimates of state-level vaccine coverage at the time of the GBD estimates, using data from household surveys (e.g., 28% aggregate vaccine coverage in Bauchi). Note that these differ from the estimates of state-level baseline coverage discussed above because they rely only on MICS (not New Incentives’ coverage surveys), and they cover an earlier time period.
Details on our specific calculation are in a footnote.105
Overall, this adjustment increases our estimate of vaccine-preventable mortality in all locations, aligning with our expectation that mortality rates would be higher among unvaccinated children than vaccinated children. For example, in Bauchi we estimate that an unvaccinated child’s risk of death before age five is 3.2%, compared to 2.8% for the population of both vaccinated and unvaccinated children. See this section in our cost-effectiveness analysis.
Adjustment for all-cause mortality effect
Some studies have found the vaccines incentivized by New Incentives' program have larger impacts on all-cause mortality than would be expected from preventing the diseases they directly target alone. This might be because vaccines have “nonspecific” effects that generally improve children’s health and reduce their risk of death from other causes.
We account for this effect with a rough guess that the vaccines targeted by New Incentives indirectly avert 0.75 deaths for every one death directly averted through the diseases they target.106 We have only looked at limited data for this and have not spoken to experts about what we should assume. Our current approach is a rough first attempt, and we believe it is likely that we would update this on further investigation.
Our estimate is based on (i) benchmarking to our assumptions for programs to avert malaria, where we also use a 0.75 estimate,107 and (ii) findings from two meta-analyses we have reviewed, Higgins et al. 2016 and Lucero et al. 2009:
- In an earlier version of our cost-effectiveness analysis, we calculated that our primary analysis implied that the vaccines targeted by New Incentives’ program reduce all-cause child mortality by ~12%.108
- However, two meta-analyses we looked at—Higgins et al. 2016 (for measles, BCG, and DTP vaccines) and Lucero et al. 2009 (for the PCV vaccine)—find all-cause mortality reductions significantly larger than this:
- Higgins et al. 2016 finds that the BCG vaccine decreased all-cause mortality by 30% and the measles vaccine decreased all-cause mortality by 26% in clinical trials. It also found the DTP vaccine increased all-cause mortality by 38%, though this is from observational studies that the authors rate as having a high risk of bias.109
- Lucero et al. 2009 finds that PCV decreased all-cause mortality by 11% in clinical trials.110
- Combining the all-cause mortality effects of the measles vaccine, BCG vaccine, and PCV from Higgins et al. 2016 and Lucero et al. 2009 suggests that together they would reduce all-cause mortality by ~54%, or a relative risk of 0.46 (calculation in footnote).111 This would be even lower if we incorporated other vaccines. A rough guess is that, overall, these meta-analyses suggest a reduction in all-cause mortality from vaccination of ~60% (a relative risk of roughly 0.4). This would roughly imply that the vaccines incentivized by New Incentives avert four deaths indirectly for every one vaccine-preventable disease death (calculation in footnote).112
We interpret this discrepancy as evidence that the vaccines we model may have some nonspecific impacts on mortality, although we’re uncertain whether this is the full explanation. We arrive at our estimate of 0.75 deaths indirectly averted for every death directly averted by putting some weight on the all-cause mortality findings in Higgins et. al. 2016 and Lucero et. al. 2009, and some weight on our primary analysis:
- We put the most weight on our primary analysis because we have a number of reservations about the findings from Higgins and Lucero. The biggest of these are indicated below (further reservations in footnote):113
- Simply adding all-cause mortality effects likely "double-counts" non-specific effects. For instance, presumably some of the non-specific effects of BCG on all-cause mortality are due to BCG reducing risk of death from measles and pneumonia, so adding the effects of measles vaccine and PCV to that impact would count those beneficial effects twice.
- Overall health may have improved over time. Access to healthcare, adequate nutrition, and preventative measures may be greater now than when the all-cause mortality trials were conducted. We think this could imply smaller non-specific effects because more deaths averted through other improvements in health may mean fewer remaining deaths to be indirectly averted by vaccines.
- The proportion of child deaths caused by vaccine-preventable disease may have changed over time. When Higgins et al. 2016 and Lucero et al. 2009 were conducted, measles, tuberculosis, and pneumonia due to S. pneumoniae114 may have been responsible for a larger share of child deaths than they currently are (note: we have not investigated this in detail). If correct, this would account for some of the higher increased all-cause mortality that we observe in these studies. This would mean we should give more weight to our estimates based on current disease prevalence, and less to Higgins and Lucero.
- However, we also put some weight on the implied findings of Higgins and Lucero, since (a) we think it's plausible there are non-specific vaccine effects, and (b) we have high uncertainty about the IHME estimates on cause of death.
- Using the same method as our primary analysis, an assumption of 0.75 indirect deaths per direct death implies that vaccines would reduce all-cause mortality by ~21% (a relative risk of 0.79, calculation in footnote).115 This estimate is closer to the value implied by our primary analysis (reducing all-cause mortality by ~12%) than the value implied by Higgins and Lucero (~60%). While we have not assigned specific weights to each estimate, we think it's reasonable to expect all-cause mortality effects to be higher than implied by our primary analysis of vaccine efficacy but likely significantly less than implied by taking all-cause mortality point estimates at face value.
Shortcomings and uncertainties
We’re confident that a high proportion of under-five mortality in locations where New Incentives works is caused by vaccine-preventable diseases, but we have a number of major uncertainties about the specific estimates we use. These include:
- How reliable are the GBD estimates of vaccine-preventable disease mortality? We have a number of reservations about these, including:
- Concerns about cause of death and disease data. Our calculations rely heavily on cause-of-death estimates for specific diseases. Our best guess is that attributing deaths to a particular cause is highly uncertain in low-income countries, and we're highly uncertain about how accurately GBD's model attributes deaths to particular diseases. We also rely on estimates of disease etiology (cause of disease), and we have heard some specific feedback from one researcher that GBD’s estimates of etiology are unreliable for lower respiratory tract infection (LRTI) and meningitis. We therefore use an alternative source for these diseases (more above), but we’re unsure what the best source to use is.
- Uncertainty about modeling assumptions. Our understanding is that the GBD estimates rely on a number of modeling assumptions. We have not investigated all the modeling assumptions underlying these estimates in detail, and we’re unsure how reliable they are.
- Are we overestimating differences between states? The GBD estimates we rely on indicate that mortality varies significantly across states in Nigeria, even within the northern part of Nigeria where New Incentives works.116 We use these values without any adjustments on the assumption that they reflect real differences. However, we would expect these estimates to be noisy, and it’s possible we’re exaggerating the true differences between states.
- Are we estimating higher deaths among unvaccinated children correctly? Our adjustment to account for higher mortality among unvaccinated children involves adapting the GBD estimates of probability of death for all children. But we have not investigated how the GBD produces these estimates, and it’s possible we are making errors in our approach.
- What assumptions should we make about all-cause mortality? We currently assume 0.75 deaths are indirectly caused by every death directly caused by vaccine-preventable diseases. While we have some meta-analysis evidence that vaccines avert more deaths than would be expected from their impact on vaccine-preventable disease alone, this is a very rough guess.
- Are we double counting deaths averted from multiple programs? Our estimates of mortality are based primarily on GBD 2021. Since 2021, GiveWell has invested in multiple programs to avert child mortality in northern Nigeria, and we’d expect that other global health funders have done so too. We’d expect that this may lower the effect of additional vaccination by lowering overall child mortality (so that there are fewer deaths to avert through vaccination) and potentially by also operating through similar mechanisms (so that the percentage reduction in mortality from vaccines is lower than we estimate). We think this question applies to many of the programs we fund and have not tried to quantify how much it impacts cost-effectiveness or how much the impact on cost-effectiveness varies across programs.
We may do further research to update these estimates in the future and cross-check them against other sources of evidence. Possible ways we could validate our estimates include:
- Checking the GBD estimates against other sources on vaccine-preventable disease mortality. In 2023, we conducted an initial (internal) analysis comparing GBD all-cause mortality estimates in states where New Incentives works against estimates from the UN Inter-agency Group for Child Mortality Estimation (IGME). Our findings from this analysis were that the IGME estimates were modestly higher on average than GBD, but this varied by state (with most higher than GBD and a few lower).117 This suggests that we could be underestimating the overall mortality burden in areas where New Incentives works, and that we might be incorrectly assessing the relative cost-effectiveness among different states. We’re unsure what’s driving these differences, and have not yet updated our cost-effectiveness analysis to account for the different sources.
- Speaking to experts to understand whether our estimates are reasonable, particularly our assumptions about nonspecific effects of vaccines.
- Conducting an analysis of what our estimates would imply about what share of falling mortality in recent decades could be attributed to increases in vaccine coverage.
- Discussing our adjustment for unvaccinated children having higher mortality with IHME researchers to understand if we’re adapting their estimates incorrectly.
What is the impact of vaccination on mortality?
Summary
We estimate that the vaccines incentivized by New Incentives reduce a child’s risk of death from vaccine-preventable diseases by 52 - 56%, varying by state.118 A summary of our calculations for one state, Bauchi, is below as an example.
| What we are estimating | Value (rounded) |
|---|---|
| Overall vaccine efficacy for the vaccines targeted by New Incentives, based on published meta-analyses (more, link) | 58% |
| Adjustment for lower efficacy in Nigeria (more) | -14% |
| Coverage in vaccine trials underlying the meta-analyses (more) | 95% |
| Ratio of vaccine-preventable disease reduction to vaccine-preventable mortality reduction (more) | 100% |
| Total (Overall efficacy against vaccine-preventable disease mortality) | 52% |
Meta-analyses of vaccine efficacy
New Incentives’ program incentivizes multiple vaccines (see above for a full list). Each of these vaccines targets different pathogens and has varying levels of efficacy against disease. The vaccines we model in our cost-effectiveness analysis are summarized in the following table.119
| Vaccine | Diseases targeted | Vaccine efficacy120 |
|---|---|---|
| PCV | Pneumococcal bacteria (S. pneumoniae).121 We model the effects on (i) lower respiratory tract infection (LRTI) and (ii) pneumococcal meningitis. | 48% for invasive pneumococcal disease.122 |
| DTP (part of Penta) | Diphtheria, tetanus, and pertussis (whooping cough).123 | 94% for whole-cell vaccines against pertussis.124 We focus on pertussis since it accounts for 80+% probability of death for diphtheria, tetanus, and pertussis.125 |
| HiB (part of Penta) | Haemophilus influenzae type b (HiB), a bacterium responsible for severe pneumonia, meningitis, and other invasive diseases. 126 We model the effects on (i) HiB-caused LRTI and (ii) HiB-caused meningitis. |
82% for invasive HiB disease.127 |
| Measles | Measles | 85% for a single dose of measles vaccine against measles. 98% for two doses of measles vaccines. 128 |
| BCG | Tuberculosis129 | 66% for tuberculosis mortality130 |
| Rotavirus | Rotavirus (one of the causes of diarrhea)131 | 46% for severe rotavirus diarrhea in sub-Saharan Africa.132 |
Our estimates of vaccine efficacy rely on the following sources:
- The Lives Saved Tool (LiST)133 for all vaccines in our analysis except BCG and HiB. For certain vaccines (PCV, DTP) we used a different set of studies from the same meta-analyses which inform LiST for our estimates.
- Abubakar et al. 2013 for BCG, since BCG is not included in LiST.
- Thumburu et al. 2015 for HiB, because Thumburu et al. 2015 contains an intention-to-treat analysis rather than a per-protocol analysis (details in footnote).134
Overall, vaccine efficacy in these meta-analyses ranges from 46% (for rotavirus) to 98% (for measles).135 This can be interpreted as vaccines causing a 46% - 98% reduction in cases of, or deaths from, the diseases they target, relative to an unvaccinated group.
- We make a rough adjustment to decrease the efficacy of two doses of the measles vaccine from 98% to 90% because the two-dose efficacy was based on serological and observational studies rather than RCTs.136
We largely take these vaccine efficacy rates at face value and have not thoroughly vetted the meta-analyses or the individual studies included in them. We are uncertain about two major factors that we have largely not adjusted for:
- Internal validity (study quality). It is possible we should include downward adjustments to account for internal validity concerns about the effect sizes reported in the meta-analyses. Many of the studies referenced above were conducted decades ago, particularly for the BCG vaccine, and our impression is that general research quality may have been worse.137 We have not currently applied internal validity adjustments for study quality because our impression is that the efficacy of vaccines is generally well-established (with the exception of BCG, where there appears to be more expert disagreement. However, our impression is that these disagreements are about generalizability and not about underlying study quality).138
- External validity (generalizability). Our impression is that the meta-analyses above include a combination of results from low, middle, and high-income countries and vaccine effectiveness may differ in low- and middle-income countries. 139
Additionally, many of the studies referenced above were conducted decades ago, and it's possible that the results' validity may not extend to current settings. We adjust separately for the possibility that vaccine efficacy is lower in Nigeria than would be implied by these meta-analyses (more below), but this may not capture all external validity concerns.
- In particular, evidence suggests that the BCG vaccine may be less effective at reducing pulmonary tuberculosis in settings closer to the equator, and the RCTs included in the meta-analysis we rely on were largely conducted in higher latitude settings.140 We have not adjusted for these concerns because we are unsure whether the mechanisms driving apparent lower efficacy against pulmonary tuberculosis generalize to neonatal vaccination, and to the BCG vaccine's effects on fatal forms of tuberculosis in children. This may mean we are overestimating the impact of BCG vaccination. Experts we’ve spoken to and other models we’ve reviewed generally suggest a smaller impact from BCG vaccination than our analysis finds, and we plan to conduct a deeper investigation into whether these differences are due to disagreements about vaccine effectiveness.
Other factors related to the meta-analyses that we have not systematically, explicitly reviewed include:
- How closely do recipients' age, dosage, and other features of the interventions included in the meta-analyses match those of New Incentives' program?
- Do the effect sizes incorporate practical challenges in implementing vaccine programs in the field (e.g., maintaining the cold chain)?
- What proportion of participants in these studies actually received vaccines? We currently assume that this proportion was 95% (more below), but this is a rough guess.141
- How does efficacy vary with vaccine "type"? Our understanding is that vaccines can vary along various dimensions (e.g., "valence" for PCV, "acellular" or "whole-cell" for pertussis) and that efficacy may vary with these characteristics. For pertussis, we used the set of results for the “whole-cell” vaccine because it is the vaccine used in Nigeria.
- Are there interactions between vaccines that would shift our cost-effectiveness estimate?
- How important is serotype replacement (i.e., the risk that vaccines could lead to higher prevalence of non-vaccine serotypes of the diseases targeted)?142 We account for this elsewhere in our analysis with a -4% adjustment, but this is a rough guess.
- Do the effects of vaccination persist through childhood? We’re currently assuming that children receive the full protective effect from vaccination up to age 5, but we haven’t interrogated this.
It's possible that further investigation of these questions would lead us to adjust our best guess on vaccine efficacy.
Overall efficacy across vaccines
We convert the estimates above into a single estimate of vaccine efficacy. To do this, we weight each vaccine by the share of under-five mortality in each state attributable to diseases targeted by that vaccine. For example, we assign more weight to PCV than to the measles vaccine, because PCV targets diseases responsible for a higher share of child mortality.143 This method results in overall weighted efficacy of 54% to 68%, varying by location.144
The weights we use are based on state-level estimates of disease-specific mortality from Institute of Health Metrics and Evaluation (IHME)'s 2021 Global Burden of Disease (GBD) model.145 These are the same as the estimates that we use to model risk of death from vaccine preventable-disease, and we apply the same adjustments (discussed above).146
We use these proportions147 as the weights to calculate our overall estimate of vaccine efficacy.
Adjustment for lower vaccine efficacy in Nigeria
The vaccine efficacy meta-analyses we rely on (discussed above) include studies from both lower- and higher-income countries.148 It’s plausible that there are reasons that vaccine efficacy might be lower on average in low-income countries.149 For example, lapses in the "cold chain" used for vaccine distribution might be more common in low-income countries, and this could reduce vaccine potency by the time the vaccines reach children. On the other hand, it’s possible that this is less of an issue now than when the underlying vaccine efficacy studies were conducted (e.g., because of improved quality control or cold chain management).
We apply a -14% adjustment to our vaccine efficacy estimates to account for lower vaccine efficacy in New Incentives’ program than implied by the vaccine meta-analyses,150 with a 25th to 75th percentile confidence interval of -25% to -5%.151 This effect size is based on four sources of evidence on measles vaccine efficacy (each discussed below):
- The main estimate of measles vaccine efficacy from the LiST meta-analysis (discussed above).
- Results from biomarkers pilots of measles immunity in Nigeria, which found lower-than-expected agreement between reported vaccination and detection of antibodies (more).
- Other studies of immunity biomarkers in Nigeria (more).
- Meta-analyses of the effectiveness of the measles vaccine in Africa compared to vaccine effectiveness overall (more).
We apply weight to each of these because we see them all as potentially informative about the efficacy of the measles vaccine in Nigeria. We then apply our adjustment for measles to the program as a whole using a rough guess that 75% of the factors leading to lower efficacy for measles also apply to the other vaccines in New Incentives’ program.152 Our calculations are in the table below.
| What we are estimating | Value (rounded) |
|---|---|
| Single-dose measles vaccine efficacy from the LiST meta-analysis (discussed above) | 85% |
| Single-dose measles vaccine efficacy that GiveWell infers from the results of IDinsight's biomarkers pilot, assuming the results are entirely explained by vaccine efficacy (more) | 26% |
| Efficacy adjustment implied by seroconversion study of measles immunity in Nigeria (Fowotade et al. 2015) (more) | 69% |
| Efficacy adjustment implied by meta-analyses of measles vaccine efficacy in Nigeria (Uzicanin and Zimmerman 2011) (more) | 73% |
| Weight assigned to each source of evidence | 20% / 10% / 35% / 35% |
| Adjusted single-dose measles vaccine efficacy | 69% |
| Subtotal: Implied adjustment for lower measles vaccine efficacy in Nigeria | -19% |
| Proportion of measles-specific adjustment that we think applies to other vaccines | 75% |
| Subtotal: Adjustment for lower vaccine efficacy for non-measles vaccines | -14% |
| Total (adjustment for lower vaccine efficacy) | -14%153 |
This adjustment is broadly in line with our impression that the vaccine literature generally finds somewhat lower vaccine efficacy in low-income countries. But we are highly uncertain about the specific magnitude of this adjustment. In particular:
- We place limited weight on the IDinsight biomarkers pilot results because the results are out of line with other evidence we’ve seen, and our best guess is that the poor results were due to a failure of the test used to detect antibodies rather than a failure of the measles vaccines to induce immunity. However, we can’t definitively rule out the possibility that the poor results were due to problems with vaccine quality. If the pilot results signaled problems with vaccine quality, then this could imply a large downward adjustment to the impact of New Incentives’ program.
- Our analysis is based only on evidence about the measles vaccine (because this is where we saw troubling evidence from the IDinsight biomarker pilot). Measles only accounts for ~5% of the vaccine-preventable deaths that we think could be averted by the program.154 We should arguably use an alternative method focusing on vaccines that account for a higher proportion of program impact.
- We apply our measles adjustment to other vaccines based on a rough guess that 75% of the issues affecting the measles vaccine would also affect other vaccines. This is a rough guess, and we have not investigated it in detail (possible reasons why biomarker results could apply specifically to measles in footnote).155
Biomarker pilots of measles immunity in Nigeria
IDinsight conducted two pilots to test the feasibility of using oral fluid measles antibody tests to validate caregiver-reported vaccination status. Both of these pilots found low agreement between the test and caregiver-reported vaccination status, as well as administrative records (e.g., child health cards). Among children reported to be vaccinated, just 22% tested positive for measles antibodies.156
These pilots were not designed to test for vaccine efficacy, and we cannot definitively rule out alternative explanations for this lower-than-expected agreement. However, our interpretation of these results is that they imply lower vaccine efficacy than our main estimate of 85% for measles. We estimate (based on a number of uncertain assumptions, discussed in footnote157 ) that measles vaccine efficacy would need to be 26% rather than 85% to explain the results, assuming that the results were entirely explained by vaccine efficacy, and that the sensitivity of the test is the same as reported.
We see these poor biomarkers results as concerning. Experts that GiveWell and IDinsight spoke to pointed to several possible explanations in two main categories:
- The test failed to detect immunity, potentially due to (a) inadequate sample collection, (b) children exhibiting a different immune response, (c) misreporting on cards, (d) the test's accuracy being lower than reported in literature due to publication bias, (e) children being vaccinated too early, or (f) the test being administered too soon after vaccination.
- Vaccines failed to provide immunity, either because (a) the vaccines lost their potency because they got too hot (i.e., the cold chain was compromised), (b) the vaccines expired, (c) the vaccines were fake or poorly manufactured, or (d) the vaccines were incorrectly administered.
Each of these explanations implies something different for our analysis of New Incentives’ program. If children developed immunity but this test failed to detect it, then it would not significantly affect our view of vaccine efficacy. If the vaccines failed to provide immunity in the first place, then it could imply vaccine efficacy in Nigeria more broadly (including in New Incentives’ program) is lower than the published meta-analyses we rely on would suggest.
In 2024, we spoke with an expert on measles biomarkers tests who thought the most likely explanation for the poor results was inadequate sample collection and difficulties around interpreting the results from commercial testing kits (more details in the footnotes).158 Based on this discussion, we think it’s most likely that the poor results were a result of the test failing to detect immunity rather than a failure of the vaccines. We continue to place some weight on these results because we can’t definitively rule out the possibility that the results were indicative of problems with vaccine quality.159
An additional uncertainty is that we’re not sure how these biomarker results translate into vaccine efficacy. We currently use the simplifying assumption that a reduced proportion of children developing antibodies is linearly correlated with reduced vaccine efficacy. However, we’re unsure about this assumption and haven’t interrogated it in depth. Overall, we assign 10% weight to the vaccine efficacy results that our analysis of the pilot implies. We may revisit this in the future.
Other studies of immunity biomarkers in Nigeria
We have also reviewed a published study that finds somewhat low levels of antibodies following measles vaccination in Nigeria, Fowotade et al. 2015. In a sample of 286 children, 69% developed protective antibody titres after vaccination.160 The authors attribute this to low vaccine potency and find that three out of six vaccine vials tested had virus titres above WHO-recommended cutoffs.161 They attribute this to lapses in the cold chain, though they do not provide any formal tests or analysis to support this.162 We find this somewhat surprising, since the authors also note that the vaccines were maintained in cold chains after they received them from the State EPI Unit.163
We see this paper as additional evidence of low vaccine efficacy in Nigeria, implying a vaccine efficacy of 69% for measles.164 This calculation assumes that a reduced proportion of children developing protective antibody titres translates linearly into reduced efficacy.
We have also lightly reviewed other studies in Nigeria that looked at whether infants developed the biomarkers associated with immunity post-immunization. These studies are summarized here.
These results vary substantially both across and within vaccines. For example, two studies of the DTP vaccine find that ~95% of infants developed protective antibodies against tetanus,165 suggesting good levels of protection. For BCG, three of four studies suggest reasonably high rates of scarring (>80%) following BCG vaccination,166 but one study reported very low rates (33%).167 Finally, for measles, four studies (including Fowotade et al. 2015) estimated that ~60% of infants vaccinated against measles developed the associated antibodies.168
Overall, we think this evidence is suggestive of lower-than-average seroconversion rates in Nigeria, but also that our analysis of IDinsight biomarker pilots seems anomalously low. However, many of these biomarker studies appear to be low quality,169 so we don’t put much weight on this check.
Meta-analysis of measles vaccine field effectiveness in Africa
We reviewed one additional meta-analysis of measles vaccine field effectiveness (this is a different meta-analysis than those referenced above). Uzicanin and Zimmerman 2011 find a median vaccine effectiveness for 9-11 month olds of 77% overall for one dose of measles vaccine, with vaccine effectiveness ranging from 73% in the WHO Africa region to 96% in the WHO European region.170
Adjustment for imperfect coverage in vaccine trials
In the meta-analyses we rely on for our primary analysis of vaccine efficacy, we use “intention-to-treat” estimates where possible. These estimate the impact of a vaccine on all RCT participants assigned to receive the vaccine, whether or not they actually received it. This is different from our cost-effectiveness analysis, which models the impact of actually being vaccinated.
We account for this with a rough guess that 95% of the participants in the treatment groups of the studies in the meta-analyses we use were actually vaccinated. This is a rough guess and we haven’t investigated the underlying studies in detail. We incorporate this in our analysis by dividing our estimates of vaccine efficacy by 95%. This adjustment slightly increases our estimates of vaccine efficacy.171
How much does reduced disease from vaccination translate into reduced mortality?
The meta-analyses we rely on largely estimate the impact of vaccination on disease incidence rather than on mortality. We assume that the vaccines incentivized by New Incentives reduce vaccine-preventable mortality by the same proportion that they reduce vaccine-preventable disease (i.e., if a vaccine reduced the number of cases of a disease by 50%, it would also reduce deaths from that disease by 50%).172
We use this assumption because:
- It seems plausible that a reduction in disease would result in a similar reduction in mortality.
- Two meta-analyses we have seen, Higgins et al. 2016 and Lucero et al. 2009 (discussed in detail above) find that some of the vaccines targeted by New Incentives lead to reductions in all-cause mortality as well as reductions in disease. We interpret this as evidence that vaccines provide at least some protection against mortality as well as against disease. We account for the finding in these papers that vaccines lead to larger reductions in mortality than would be expected through their impact on the diseases they target alone through our adjustment for all-cause mortality (discussed above).
However, we are uncertain about this parameter and have not prioritized an investigation into this issue. It seems plausible that the reduction in mortality could be higher than the reduction in disease incidence, and we may explore this possibility further in the future (e.g., by looking at the effects of vaccination on severe disease, not just disease incidence).
Next steps for further research
We hope to improve our estimates of vaccine efficacy with further work in the future. Our biggest priority is understanding how much lower we’d expect vaccine efficacy to be in New Incentives’ program than the meta-analyses we rely on. This could include:
- A deeper investigation on published meta-analysis estimates of vaccine efficacy in sub Saharan Africa, in particular, to better understand why vaccines may be or less effective in different contexts. As of October 2024, we’ve conducted moderately in-depth reviews of the evidence for several vaccines (BCG, PCV, and measles). We could do a detailed review for all the vaccines in New Incentives’ program.
- In 2024, we conducted a moderately in-depth review of vaccine efficacy across locations for several of the vaccines included in New Incentives’ program. We updated our analysis to reflect the evidence that we think best represents vaccine efficacy in Nigeria; however, we may do more work to better understand the mechanisms driving vaccine effectiveness and whether we should apply additional adjustments for internal and external validity.
- We may revisit this in the future, and restructure our analysis so that we rely explicitly on meta-analyses from low-income countries.
- Conversations with experts to understand why vaccines might be less effective in low-income contexts, in particular for BCG where there appears to be more disagreement on efficacy.
- An additional study to validate the findings of the IDinsight biomarkers pilot.
- Cross-checks with macro data on the impact of large-scale vaccine roll-outs in low-income countries.
4.3 Reduced mortality for older children and adults
Summary
The diseases targeted by New Incentives’ program also pose some risk to older age groups. We would expect vaccines to provide some longer-term protection against these diseases and reduce vaccinated children’s mortality risk in the future.
We estimate that each $1 million spent by New Incentives will avert the deaths of between 35 and ~170 children vaccinated today at some point later in their lifetime (varying by state).173 Overall, reduced mortality in later life accounts for ~10% to ~13% of the total modeled benefit from New Incentives’ program.174 In Bauchi, our 25th - 75th confidence interval is that this accounts for 5% - 17% of the total modeled benefits of the program, with a best guess of 12%.175
Our analysis uses the same approach that we use to model averted mortality for children under five. We also roughly adjust for declining vaccine efficacy over time and a guess that vaccine-preventable diseases will probably decline over time as health generally improves. We use the following key parameters:176
- Estimates of probability of death from vaccine-preventable diseases in later life. We use Global Burden of Disease project estimates of vaccine-preventable mortality risk in different age bands (5 - 14, 15 - 49, and 50 - 74). These estimates represent mortality risk for these age groups today. We roughly adjust them downward because we expect the probability of death from the diseases addressed by vaccines will fall over time. Our downward adjustments are 10% (ages 5-14), 30% (ages 15-49), and 60% (ages 50-74).
- Vaccine efficacy against vaccine-preventable diseases in later life. We use vaccine efficacy estimates from the meta-analyses discussed above, weighted by each vaccine’s contribution to reducing mortality (the same approach that we use for under-fives, but adjusted for the relevant age group). Since we would expect the protection provided by vaccines to wane over time, we apply progressively steeper downwards adjustments for vaccine efficacy in older age groups. We have seen some evidence suggesting that the BCG vaccine, in particular, has very limited effectiveness on reducing disease past childhood, so we apply a larger downward adjustment for the effectiveness of this vaccine past age 15. Our downwards adjustments for each age group are 10% for all vaccines (ages 5-14), 40% for non-BCG vaccines and 80% for the BCG vaccine (ages 15-49), and 70% for non-BCG vaccines and 90% for the BCG vaccine (ages 50-74).
- A discount rate of 0.5%. This represents placing a slightly higher value on deaths averted now versus deaths averted in the future to account for intertemporal uncertainty (e.g., unforeseen events) (details in footnote).177
See this section of our cost-effectiveness analysis for our calculations. A summary of our calculations for one state, Bauchi, is below as an example. For simplicity we present calculations for 5 - 14 year olds only.178
| What we are estimating | Value (rounded) |
|---|---|
| 5 - 14 year olds | |
| Probability of death between ages 5 and 14 from vaccine-preventable disease among unvaccinated children in Bauchi, adjusted for lower mortality in the future (link) | 0.23% |
| Indirect deaths averted from other causes for each vaccine-preventable disease death averted (see discussion here) | 0.75 |
| Probability of death between ages 5 and 14 from vaccine-preventable disease among unvaccinated children in Bauchi, including deaths indirectly attributable to vaccine-preventable disease | 0.43% |
| Overall weighted vaccine efficacy for children aged 5 - 14, adjusted for lower long-term vaccine efficacy and lower vaccine efficacy in Nigeria (link) | 51% |
| Discount rate | 0.5% |
| Children vaccinated as a result of New Incentives’ program per $1,000,000 spent (discussed above) | ~10,200 |
| Totals | |
| Discounted deaths averted among people age 5 through age 14 per $1m spent | 21179 |
| Discounted deaths averted among people age 15 through age 49 per $1m spent (link) | 20 |
| Discounted deaths averted among people age 50 through age 74 per $1m spent (link) | 34 |
| Discounted deaths averted among all age groups over age 5 | 75 |
| Total (proportion of modeled benefits from averted deaths above age 5) | 12%180 |
Shortcomings and uncertainties
Our biggest source of uncertainty in these estimates are the adjustments for vaccine-preventable diseases forming a lower share of total mortality in the future, and falling vaccine efficacy over time. We rely on rough guesses in both cases:
- The share of vaccine-preventable mortality in later life: We guess that vaccine-preventable mortality will be lower than it is today as children age (by 10%, 30%, and 60%, respectively, depending on the age group), because it’s plausible that technology improvements and changes to health systems will lead to overall improvements in health over time. But these are speculative guesses, as we can’t know what will happen decades in the future.
- Falling vaccine efficacy over time: Our understanding is that the vaccine efficacy estimates we rely on look primarily at short-term efficacy, and there is a lack of long-term data on efficacy. Our current estimates (10%, 40%, or 70% lower efficacy for non-BCG vaccines and 10%, 80%, and 90% lower efficacy for the BCG vaccine, depending on the age group) are very rough guesses.
We have not prioritized a deep investigation into this question, since averting mortality for older age groups is a relatively small share of the total modeled benefits of the program (10% to 13% of modeled benefits, varying by state). But we may conduct more research to update these estimates in the future.
4.4 Long-term income increases
Summary
Our best guess is that vaccination leads to small income/consumption increases in adulthood. We estimate that these income gains account for approximately 20% of the modeled benefits of New Incentives’ program in all states in our analysis.181 In Bauchi, our 25th - 75th confidence interval is that this accounts for 0% - 34% of the total modeled benefits of the program, with a best guess of 21%.182
We include these benefits because studies of other child health programs we have investigated (malaria and deworming) have found evidence that averted illness in childhood leads to increased income and consumption in later life.183 We think that vaccination probably leads to similar benefits, but have not yet investigated the literature on this question in depth. For simplicity, we benchmark our calculations to our analysis of the income gains from seasonal malaria chemoprevention (SMC), another child health program where we’ve reviewed the evidence in more detail.
A summary of our calculations is below using one state, Bauchi, as an example (full calculations in this section of our analysis).
| What we are estimating | Value |
|---|---|
| Ratio of benefits from income effects to benefits from deaths averted in GiveWell’s analysis of SMC (more) | 0.31 |
| Adjustment for income increases generated by New Incentives' program compared to SMC (more) | 0% |
| Units of value generated from deaths averted among people under age 15 in Bauchi (link) | ~37,800 |
| Units of value generated from long-term income increases | 11,577 |
| Total units of value generated by New Incentives’ program per $1m spent (link) | 55,364 |
| Total (% of total cost-effectiveness from long-term income increases) | 21% |
Our approach
Vaccination and long-term income increases
We have seen several studies directly investigating whether vaccination leads to economic benefits (compiled in this spreadsheet). Overall, our impression from an initial light-touch review is that there is some evidence of a link between vaccination and economic benefits. However, our impression is that these studies have methodological issues, meaning that it is hard to draw strong conclusions from them, and we’d expect it to be time-intensive to review this literature and come up with a quantified estimate. As a result, we haven’t prioritized reviewing this literature in depth.
Benchmarking to SMC
For simplicity, we benchmark to our analysis of income effects from seasonal malaria chemoprevention (SMC), another program targeting children under 5. Our analysis of the income benefits of SMC (and other malaria programs) is based on an in-depth review of two natural experiments (Bleakley 2010 and Cutler 2010) that found malaria elimination programs were associated with income gains in formerly malarious regions in India and Colombia, Mexico, Brazil, and the US.184
- We use a combined estimate from these studies and adjust it downward by -70% to reflect our doubts about the quality of the evidence (among other adjustments).
- Overall, we estimate that each malaria case averted in childhood increases later-life income by 0.6% per year.185
We benchmark the income benefits for New Incentives’ program to SMC using the following method:
- Averaging across locations, we estimate that the value of income benefits from SMC are equivalent to 31% of the value from deaths averted (as measured in GiveWell units of value, an arbitrary unit we use to compare the moral value of different kinds of outcomes).186
- We assume that the income benefits of New Incentives’ program are also 31% as large as the benefits from deaths averted.187 This assumption means the income benefits we estimate in each state supported by New Incentives’ program vary in direct proportion to mortality averted in that state.
Subjective adjustment for vaccination
We assume that the income benefits achieved through New Incentives’ program are the same as for SMC (relative to the level of mortality averted by each program). We’re uncertain about this assumption, since it might be that we should expect vaccine-preventable diseases to have a smaller or larger impact on income than malaria per death averted. We haven't yet done a careful side-by-side comparison to understand whether we'd expect these long-term income benefits to be different for vaccination based on likely mechanisms (e.g., the cognitive effects of vaccine-preventable diseases compared to malaria). We therefore set this adjustment to 0%.
Shortcomings and uncertainties
Overall, we see this method as a pragmatic way to estimate income effects for interventions where we haven’t done a deep review of the relevant literature. But we see it as highly uncertain. Key open questions:
- What should our prior about income effects be? Our approach assumes that vaccination leads to later life income increases, even though we’ve reviewed limited direct evidence to demonstrate this. This is because we have reviewed direct evidence of income benefits from averted malaria, and we think there’s little reason to think (e.g., because of stronger mechanisms or obvious symptoms) that malaria is more likely to reduce income than vaccine-preventable disease. This is a very speculative assumption, and we haven’t done a comprehensive comparison of the symptoms caused by each disease that could plausibly be the mechanism for income effects (e.g., neurological symptoms, disability, or weight loss).
- Should we benchmark only to mortality? Our method benchmarks only to the mortality averted by each program, not the morbidity averted. We think this is a reasonable assumption because we’d expect the level of severe disease to be highly correlated with both income benefits and mortality. But it could be wrong, for example, if the true mechanism for income effects was via averting a large number of mild cases of a disease, each of which contributed a small amount to long-term income (rather than a smaller number of serious cases).
Our best guess is that further research would lead us to update our conclusions on the impact of vaccination on long-term income. However, because these effects are a relatively small share of the overall value we estimate from New Incentives’ program, we have not prioritized this work.
4.5 Increased short-term consumption
We think that the cash transfers paid by New Incentives also improve well-being through increased short-term income and consumption. We estimate that each household receiving cash transfers from New Incentives as a result of a child in the household getting vaccinated sees an $8.95 rise in income. This equates to $1.34 per household member, accounting for 2% to 8% of the total benefits of the program (varying by state).188 In Bauchi, our 25th - 75th confidence interval is that this accounts for 2% - 6% of the total modeled benefits of the program, with a best guess of 4%.189
A summary is below:
| What we are estimating | Value |
|---|---|
| Exchange rate, naira:$USD (based on exchange rate at the time this analysis was conducted) | 1,165:1 |
| Total transfer for receiving all vaccinations in the program (naira) | 11,000 |
| Travel costs for each clinic visit (naira) | 298 |
| Percentage of cash transfers where caregivers reported 0 transportation cost | 68% |
| Number of routine vaccination visits incentivized by New Incentives’ program | 6 |
| Subtotal: Total net transfer amount (subtracting travel costs), $USD | $8.95 |
| Average household size (link) | 6.7 |
| Subtotal: Consumption increase per household member | $1.34 |
| Estimated baseline annual consumption per capita (link) | $286 |
| Value of increasing someone’s annual consumption from $286 to $287.34, in GiveWell units of value190 | 0.01 |
| Number of children enrolled in the program per $1 million spent by New Incentives (discussed above) | ~54,900 |
| Total number of household members benefiting from increased consumption | ~370,000 |
| Units of value generated per $1 million spent | 2,473 |
| Total units of value generated by the program from modeled benefits per $1 million spent in Bauchi (link) | 59,296 |
| Total (% of total modeled benefits from consumption increases) | 4% |
See this section of our cost-effectiveness analysis for our full calculations.
Our analysis is based on:
- The total cash benefit received by caregivers who take their infants for all incentivized vaccinations (11,000 naira).191
- An estimate that it costs on average 577 naira to bring a child to and from all six routine immunization visits. This calculation is based on the percentage of caregivers who report not paying any transportation costs to get to clinics, and the average transportation cost reported among caregivers who did pay for transportation. New Incentives collects this information from caregivers at each incentives disbursement. We use the average figures from 2023 as we expect those to be the best representation of transportation costs at the program's current scale, as we assume transportation costs would have declined as New Incentives expanded to more clinics and reduced the average distance that caregivers would have to travel. 192
- A rough estimate that the average household in the locations where New Incentives works contains 6.7 people. This is based on data from the 2021 Nigeria Malaria Indicator Survey in states where New Incentives currently (as of the end of 2023) works.193
- A rough estimate that the average person in locations where New Incentives works has an average baseline consumption of $286. This is benchmarked to our analysis of GiveDirectly’s program, based on an RCT of the program conducted in Siaya County, Kenya between 2011 and 2013.194
Overall, we see this as a rough and imprecise analysis. Shortcomings include:
- Some children enrolled by New Incentives do not receive a full course of vaccinations (and so their caregivers will not receive the full incentive amount). New Incentives monitors retention rates in the program over time, but we do not currently use this data to adjust total consumption benefits.195 This is likely to slightly overestimate our estimate of consumption benefits.
- Our analysis of baseline consumption is based on data for GiveDirectly’s program in Kenya. We would guess that this is likely to be similar to Nigeria given the two countries’ similar levels of GDP per capita,196 but we have not investigated this in depth. We also do not account for differences in baseline consumption between states or any increase in baseline consumption since the GiveDirectly analysis was conducted.
It is likely that we would update our estimates with further work. But because these benefits constitute a small share of the overall value of the program (2% to 9% across states), we have not prioritized this.
4.6 What happens to vaccination rates if the program ends?
Summary
Why is this important?
We have heard concerns that New Incentives’ program could lead to harmful effects if it is discontinued in a given area.197 For example, by introducing a financial incentive it is possible that New Incentives' program "crowds out" intrinsic motivation to vaccinate infants. This might lead to lower vaccination rates after the program is discontinued than there would have been if the program had never been implemented. Conversely, it is possible that the program leads to longer term increases in vaccination by changing social norms around vaccination, providing information about the value of vaccines, strengthening supply chains, or other means.
How we’ve accounted for this
In our current cost-effectiveness analysis (as of November 2024) we apply a -11% to -30% adjustment in states in Nigeria where New Incentives’ program does not currently operate. This adjustment captures the potential impact from a decrease in vaccination rates if the program was introduced in these locations and then withdrawn. We view this adjustment as highly speculative because there is very limited high-quality evidence on what happens to vaccination rates after an incentives program is discontinued.
Because our cost-effectiveness estimates aim to capture the value of future grants, we only apply this adjustment to areas where New Incentives does not currently operate. In areas where New Incentives already operates, we would guess there is a similar possibility of lower vaccination rates after the program is discontinued, but this risk has existed since New Incentives began operating in these states and we do not currently expect the risk to change with a longer program duration.
A summary of our approach:
- Our best guess is that discontinuing New Incentives' program may lead to roughly a 3% drop in vaccination rates for the first subsequent child born to caregivers who previously had a child enrolled during the program. (more)
- There is limited evidence on the effect of discontinuing an immunization incentives program. For this reason, we put most weight on our prior that vaccination rates will return to baseline after program withdrawal. This is supported by conversations with other funders and implementers, and studies which followed participants after withdrawal of incentives programs that targeted other health behaviors. Our prior also accounts for the possibility that immunization rates may increase in the long run as a result of the program (for example, because of other awareness-raising and supply-side strengthening activities that New Incentives conducts). (more)
- We also put some weight on evidence from two studies which followed up on RCTs of immunization incentives programs in low- and middle-income countries: Kagucia 2018 and Karing, Finetti, and Kuloszewski 2024. Both incentives programs differed meaningfully from New Incentives' program, but both follow-up studies found that younger siblings of previously enrolled children had lower timely vaccination rates (ranging from a 3-22% decrease) 2 to 3 years after the programs were withdrawn. Karing, Finetti, and Kuloszewski 2024 also tracked children in the wider community and found no statistically significant effects in households that did not receive incentives. (more)
- To adjust our cost-effectiveness analysis, we estimate the number of children vaccinated because of the program (a positive effect) and compare it to the number of children who will not be vaccinated after the program, but who would have been vaccinated if the program had never existed (a smaller negative effect). For example, in Niger state, we estimate that for every 100 children who are vaccinated due to the program, 15 will not be vaccinated (due to the program) after the program ends; and we apply a -15% adjustment to our analysis. We only apply this adjustment in states where New Incentives has not yet entered because we do not expect continued funding to increase (or decrease) the post-program effects. (more)
Our major reservations include:
- We view our best guess of a 3% drop in vaccination rates for the first subsequent child as highly speculative. We have very limited evidence on the impact of discontinuing an incentives program targeted at childhood immunizations in low- and middle-income countries. The incentives programs in the two studies we reviewed (Kagucia 2018 and Karing, Finetti, and Kuloszewski 2024) and incorporated into our best guess were meaningfully different from New Incentives’ program, and the results may not generalize to New Incentives’ program. Kagucia 2018 was also significantly limited by a small and likely unrepresentative sample. (more)
- New Incentives has plans in place to responsibly phase out its program in the event of an exit, and we think it is plausible that a responsible exit could mitigate negative effects. (more)
- We estimate the post-program adjustment for our cost-effectiveness analysis by projecting forward our best guess of the impact of New Incentives’ program, and when the program would likely stop. Any number of factors could meaningfully influence how long the program operates in a given area and change the impact of program withdrawal in the long run. (more)
We see the long-term impact of program discontinuation as an important priority area for future research. We plan to seek opportunities to generate additional evidence. (more)
What happens to vaccination rates after incentives programs are discontinued?
Summary
We estimate that discontinuing New Incentives' program will result in a ~3% decline in vaccination rates for the first subsequent child born to caregivers who previously had a child enrolled during the program.
A summary of the evidence we include in our estimate is below:
| Evidence | Weight placed on evidence | Estimated decrease in vaccination rates for siblings born post-program | IV adjustments | EV adjustments | IV/EV Adjusted |
|---|---|---|---|---|---|
| Our prior | 60% | 0% | N/A | N/A | 0% |
| Kagucia 2018 (more) | 15% | -18% to -22% | -60% to -70% | 0% | -7% |
| Karing, Finetti, and Kuloszewski 2024 (more) | 25% | -3% to -10% | -10% | 15% | -4% to -10% |
| Weighted average: | -3% | ||||
Our full calculations are here.
- We place most weight (60%) on our prior that vaccination rates will return to baseline (i.e. there will be a 0% effect) after the program is withdrawn. This is based on our intuitions, expert conversations, and studies which followed participants after withdrawal of incentives programs that targeted non-immunization health behaviors. (more)
- In general, these studies find no negative post-program effects, and in some cases, find evidence that the incentivized behaviors persisted after program withdrawal. We do not put quantitative weight on the findings because the behaviors and populations incentivized differ from New Incentives’ program. (more)
- We place 15% weight on the results of Kagucia 2018, a follow-up of an RCT in Kenya that provided caregivers with mobile cash incentives for timely vaccination. The study suggests that discontinuing a cash incentives program may result in reduced vaccination rates for siblings born post-program (we estimate a 7% decrease, after adjustments), but we place limited weight on the results because of small sample sizes and a large risk of bias in the results. (more)
- We place 25% weight on the results of Karing, Finetti, and Kuloszewski 2024, a follow-up of an RCT in Sierra Leone which provided caregivers with social signaling incentives for timely vaccination in the form of color-coded bracelets. The study provides moderately strong evidence that discontinuing a large-scale incentives program may result in lower vaccination rates for siblings born post-program (we estimate a 4-10% decrease, after adjustments). The study also finds no impact on children born to households in the wider community who had not previously received incentives. We place only modest weight on the results because the incentives differ significantly from the monetary incentives offered by New Incentives, and the observed effects may not generalize to New Incentives’ program. (more)
Our main uncertainties are:
- There is very limited evidence on vaccination rates after incentives programs for childhood immunizations are discontinued, so we put most weight on our prior. The incentives programs in the two studies we reviewed to inform our best guess differed meaningfully from New Incentives’ program—in particular, the type and value of the incentives, and the specific behaviors incentivized (timely vaccination completion as opposed to vaccination completion, regardless of timeliness). The mechanisms for negative post-program effects may not generalize to New Incentives’ program. (more)
- Both programs were in different contexts (Western Kenya, Sierra Leone) from northern Nigeria where New Incentives’ program operates, and negative effects may be more or less likely in northern Nigeria. (more)
- The studied programs were implemented for relatively short periods of time (around two years). In many locations, we expect New Incentives’ program to operate for significantly longer (i.e. five or more years). We think a longer program duration could increase the likelihood of negative effects (e.g. by entrenching expectations around incentives) or decrease the likelihood of negative effects (e.g. by entrenching awareness about the benefits of vaccination), and we're unsure about which of these possibilities is more likely. (more)
- New Incentives has plans in place for a gradual and responsible exit, and we think it is plausible that a responsible exit could mitigate or eliminate any negative effects. (more)
Our prior
Our intuitions
We think New Incentives’ program could lead to positive and negative long-term effects on vaccination rates, and we would guess that these effects roughly balance out.
- Vaccination rates may increase in the long-term because more people getting vaccinated as a result of the program leads to persistent social norms around vaccination. New Incentives’ work raising awareness about the benefits of vaccines, or its supply-side strengthening activities, may also lead to positive long-term impacts.198
- On the other hand, vaccination rates may decrease in the long-term because providing financial incentives risks undermining intrinsic motivation, or because withdrawing the program could decrease trust in the healthcare system or signal that vaccination is less valuable. New Incentives told us of one case indicating this might be a concern in areas where it works: some caregivers reportedly refused to vaccinate their infants after in-kind incentives, different from those provided by New Incentives, for a polio vaccination campaign were suspended.199
What do other implementers and funders think?
In conversations with implementers and other funders of vaccination programs (such as Gavi, UNICEF, and USAID) we have heard mixed perspectives about the likelihood and direction of post-program effects. We think this supports our prior that post-program effects are equally likely to be positive or negative.
- Several major implementers and funders we spoke with thought neutral or positive long-term impacts were more likely and expressed support for CCT programs, particularly in places with very low existing coverage. For example, in January 2023, Gavi launched an RFP for "demand-side incentives", including conditional cash transfers.200
- Others major implementers and funders we spoke to expressed concerns about sustainability and caregivers refusing vaccinations after incentives were removed.
What is the evidence on discontinuation of incentives programs for non-immunization health behaviors?
In 2020 and again in 2023, we conducted light-touch literature reviews on the effect of withdrawing incentives. We identified follow-ups of interventions which offered cash incentives for health behaviors other than vaccination (such as uptake of maternal healthcare services, or treatment for HIV).
In general, these studies find no negative post-program effects, and in some cases, find evidence that the incentivized behaviors persisted after program withdrawal. We think these studies support our prior that offering cash incentives for health behaviors does not necessarily lead to negative effects after program withdrawal (and may lead to positive long-term effects). However, the incentivized behaviors and populations targeted meaningfully differ from receiving childhood vaccinations, and thus the estimated effect sizes are unlikely to generalize to vaccinations, so we do not incorporate them directly into our estimates.
- We identified two studies (Onwujekwe et al. 2020 and Ezenwaka et al. 2021) which looked at the impact of removing a conditional cash transfer program (the SURE-P program) that incentivized uptake of maternal healthcare services in Nigeria (details in the footnotes).201 The studies find suggestive evidence that use of maternal healthcare services remained higher in the groups which received CCTs after program discontinuation, but also some evidence that trust in the healthcare system may have declined.
- We also identified follow-ups of interventions in low- and middle-income countries outside of Nigeria which incentivized non-immunization health behaviors such as HIV treatment and safe sexual practices (details in footnotes).202
In general these studies find no evidence of negative effects, and in some cases, evidence of persistent positive effects on intrinsic motivation or take up of the health behavior. While we think this provides some evidence that cash incentives do not necessarily crowd out intrinsic motivation, the behaviors being incentivized and populations targeted meaningfully differ from incentives for vaccination. We think the results may not generalize to childhood vaccinations because:
- These studies all focus on health behaviors undertaken by adults. We think it is likely that different considerations and barriers influence whether caregivers bring their infants in for vaccinations.
- Some of these programs incentivized uptake of treatment. Treatment has more immediate benefits and may be more likely to result in habit formation or long-term learning than a preventative behavior like vaccination.
To get more information on the impact of program withdrawal on long-term vaccination rates, we searched for and asked experts about randomized controlled trials of incentives for routine immunization programs in low- and middle-income countries where data was collected on vaccination rates after the program ended. We identified two follow-ups of RCTs which offered incentives for routine childhood immunization: Kagucia 2018 (more) and Karing, Finetti, and Kuloszewski 2024 (more). Both studies suggest that removing incentives results in modest declines (we estimate by between 4% and 10% after adjustments) in vaccination rates for younger siblings of children whose caregivers had previously received incentives.
Kagucia 2018
Kagucia 2018 revisited caregivers in Kenya who had participated in an RCT that offered mobile cash incentives for timely vaccination completion. We think the study provides some evidence that discontinuing cash incentives could lead to moderate declines in subsequent vaccination rates (we estimate by 7%, after adjustments), but we place limited weight (15%) on the results because the follow-up was significantly limited by its small and likely unrepresentative sample.
- Kagucia 2018 followed-up on the “M-SIMU” trial in Kenya (Gibson et al. 2017), a cluster-randomized trial conducted in 2013-2015 where caregivers received SMS reminders alone or with small mobile cash incentives.203
- In the original trial, there were three treatment groups. Caregivers in all three treatment arms received SMS reminders.204
- Caregivers in one arm received only SMS reminders.
- Caregivers in two treatment arms were also offered small mobile conditional cash transfers (mCCTs) of either 75KES (~US $0.88 in August 2015) or 200KES (~US $2.35 in August 2015) for getting their child vaccinated on time.205 The researchers found 37% to 42% increases in timely measles vaccination rates for children in the treatment groups that included cash incentives.206
- The follow-up “MSBC” study was conducted in 2018,207 and it included 218 out of the original 1,599 households. Most households (57%) were not included in the follow-up because they did not have a subsequent child (SC) who was at least 10 months old.208 The primary outcome was timely completion of the first dose of a measles-containing vaccine (MCV1), defined as a dose received within 2 weeks of the scheduled date.209
- In the original trial, there were three treatment groups. Caregivers in all three treatment arms received SMS reminders.204
- Kagucia 2018 found large declines in timely MCV1 vaccination rates (of 18-22%) in younger siblings of children who had originally received incentives. These results are concerning and suggest removing incentives could have large negative post-program effects; however, the estimates had very wide confidence intervals due to the small sample sizes.
- During the follow-up, the study found an 18.1% decrease (95% CI: -39.3%, 3.1%) in timely MCV1 coverage in subsequent children of the caregivers who had received 200 KES compared to the control.210 They also found a 21.7% decrease (95% CI: -41.9%, -1.6%) in timely MCV1 coverage in subsequent children of the caregivers who received 75 KES.211 However, the samples were small, and we think the study was likely underpowered for even large effect sizes.212
- We thought it was plausible that the negative results were driven by the relatively strict definition of timeliness (i.e. caregivers may have missed the 2 week cut-off but still brought their child for vaccinations in a reasonable time frame), but the findings were similar when considering vaccination completion at 12 months.213
- We apply large internal validity adjustments (60-70%) to the results prior to incorporating them into our best guess. We think it’s likely the results were meaningfully biased towards larger negative effects, in particular, because an unrepresentative sample of caregivers was included in the follow-up.
- Only a subset (~14%) of households who participated in the original trial were included in the follow-up.214
The caregivers included in the follow-up control group appeared to have higher than average vaccine-seeking behavior (based on higher rates of timely MCV1 completion for children included in the original trial),215
while caregivers in the follow-up 75KES treatment group appeared to have lower than average vaccine-seeking behavior.216
We expect the unrepresentativeness would bias the results towards larger negative post-program effects.
- However, the sample sizes in the follow-up groups were small, and we're unsure if these differences in vaccine-seeking behavior are statistically significant.217
- The caregivers in the follow-up control group also reported higher rates of mobile phone ownership than the caregivers across the three treatment arms, but the researchers controlled for these differences in their analysis.218
- In addition, our understanding is that the study was not pre-registered and has not undergone the formal peer review process required for publication in an academic journal. We think lack of formal peer review increases the risk that methodological flaws or calculation errors may not have been identified.
- Only a subset (~14%) of households who participated in the original trial were included in the follow-up.214
The caregivers included in the follow-up control group appeared to have higher than average vaccine-seeking behavior (based on higher rates of timely MCV1 completion for children included in the original trial),215
while caregivers in the follow-up 75KES treatment group appeared to have lower than average vaccine-seeking behavior.216
We expect the unrepresentativeness would bias the results towards larger negative post-program effects.
- We do not make any adjustments for external validity because the incentives programs are similar in design: caregivers being provided small monetary incentives for completing vaccination visits. We also considered but do not make adjustments for other differences between programs, including the size of the incentives (more) and the locations where the programs operate (more).
- The original M-SIMU program also included SMS reminders, and negative post-program effects may have been driven by removal of the reminders rather than the incentives. However, the SMS-only group included in the follow-up reported smaller decreases in vaccination rates post-program (of roughly 11%), so we think it’s unlikely that the negative effects were solely due to removal of SMS reminders.219
- New Incentives’ program also includes other components in addition to cash incentives (such as awareness raising and supply-side strengthening activities220 ), and removing these other program components alongside vaccinations could similarly increase or decrease the likelihood of negative post-program effects.221
- We put 15% weight on the results overall.222 We think the intervention studied is reasonably similar to New Incentives’ program, but we place limited weight on the results because of the small and likely unrepresentative sample.
Karing, Finetti, and Kuloszewski 2024 revisited communities in Sierra Leone that were part of an RCT which provided color-coded bracelets to incentivize vaccination. Overall, we think the evidence was high-quality and suggests that discontinuing a large-scale223 incentives program could lead to small declines in immunization rates for younger siblings of children who had previously received incentives (we estimate by 4-10%, after adjustments). We place modest weight on the results (25%) because we think the program shares important similarities with New Incentives’ program; however, the post-program effects appeared dependent on the nature of the incentives and we are unsure whether the underlying mechanisms would generalize to New Incentives’ context.
- Karing, Finetti, and Kuloszewski 2024 followed up on Karing 2024, an RCT conducted in Sierra Leone from July 2016 - August 2018 that provided color-coded bracelets as incentives for immunizations.224
- In the original trial there were three intervention arms with different conditions under which infants received bracelets: bracelets in two arms were intended as a "social signal" of timely vaccination—for caregivers to signal timely completion of specific vaccination visits to others in their community–with bracelets in the third arm primarily acting as a “small material reward” (details in footnote).225 Only the bracelets provided in one arm where children received incentives for timely completion of the fifth vaccine visit (denoted as “Signaling Reward” in the follow-up study and “Signal at 5” in the original trial),226 resulted in statistically significant increases in timely vaccination completion (roughly a 13 percentage point increase in the timely completion rate for all five vaccines, or a 9% increase in the average number of timely vaccines received).227
- The follow-up, conducted from December 2020 - August 2021, included both caregivers who had children and received bracelets during the original trial (and were thus “directly exposed”) and caregivers in the same communities who did not have children in the target age range during the original trial.228 The primary outcome was the total number of vaccines received on time, where timeliness was defined as receiving a scheduled vaccine within 2.5 months of the recommended age.229
-
Karing, Finetti, and Kuloszewski 2024 found small declines (3% to 11%) in the number of timely vaccines completed for younger siblings across intervention arms.230 Counter to our intuitions, the largest declines (and the only statistically significant declines) were in the two intervention arms where the bracelets appeared to have limited social signaling value and no impact on vaccination uptake in the original trial. We do not have strong evidence for the mechanisms driving the differences across arms; but we think it is plausible that negative post-programs effects were mitigated in the “Signaling Reward” group because the bracelets in this arm focused attention on the intrinsic reasons for vaccination.
- The authors found that younger siblings of children who had previously received incentives in two out of three treatment arms completed fewer vaccinations on time (by 5% and 11%). These reductions are statistically significant at the p < .10 and p < .01 levels, respectively.231 These are the treatment arms where the original incentive did not appear to carry signaling value (details in footnote)232 and did not significantly increase uptake.233
- They found a smaller and not statistically significant reduction in timely vaccination rates (of 3%) for children in the third treatment arm (“Signaling Reward”).234 This is also the group where the bracelets appeared to have a strong social signaling value (by signaling timely completion of an important vaccination visit, thereby emphasizing care for their child's health),235 and significantly increased vaccination uptake in the original trial. We think it is plausible, as the authors hypothesize, that these bracelets focused caregivers' attention on their intrinsic motivation to vaccinate; and that incentives which serve as a reminder of the intrinsic reasons to vaccinate may be less likely to crowd out intrinsic motivation.236
- In all arms, the post-program effect was limited to families who had a child during the program implementation period and did not extend to members of their communities.237
- Overall, we think the evidence is relatively high-quality, but we discount the results slightly for internal validity (by 10%) because our understanding is that the follow-up study was not pre-registered, which somewhat increases the risk of bias.238
- The researchers conducted follow-up in all communities included in the original study, the sample size was relatively large,239 and we did not identify any obvious quality concerns (e.g. there was no evidence of substantial baseline imbalances,240 differential attrition between control and treatment groups,241 or recall bias242 ).
- We discount the results slightly for lack of pre-registration because we think this increases the risk that methodological choices made by researchers after the fact (e.g. in the outcomes or data analysis) could bias the results towards finding larger effects.
- We also make small upward external validity adjustments (15%) to account for differences in the types of incentives offered from New Incentives’ program. Because bracelets are very different from monetary incentives, we are unsure if the negative effects would generalize; but intuitively, we expect negative effects would be larger for cash relative to non-monetary incentives. This is because we think cash is a particularly salient incentive that is more likely to crowd out intrinsic motivation, or result in other long-term negative effects such as lowering the perceived value of vaccinations.
- The post-program effects appeared to differ based on the perceived value and function of the bracelets. The largest negative effects were found in the treatment arms where the bracelets did not appear to carry any social signaling value, and instead may have focused caregiver attention away from the intrinsic reasons for vaccination (see above). In general, we think it is plausible that monetary incentives would have larger negative effects than non-monetary incentives like bracelets because we think cash is more salient and more likely to shift focus away from the intrinsic reasons for vaccination.
- However, we do not have strong evidence for the mechanisms driving the differences across arms.
- It is also plausible to us that the incentives in New Incentives’ program do not shift attention away from caregivers’ intrinsic motivation to vaccinate their children (details in footnote).243
- Cash incentives may also be more likely to result in long-term negative effects through mechanisms other than crowding out intrinsic motivation. For example, relative to other non-monetary incentives, removing cash incentives may be more likely to signal to caregivers that vaccinations are less important.
- The post-program effects appeared to differ based on the perceived value and function of the bracelets. The largest negative effects were found in the treatment arms where the bracelets did not appear to carry any social signaling value, and instead may have focused caregiver attention away from the intrinsic reasons for vaccination (see above). In general, we think it is plausible that monetary incentives would have larger negative effects than non-monetary incentives like bracelets because we think cash is more salient and more likely to shift focus away from the intrinsic reasons for vaccination.
- We place 25% weight on the results overall, assigning more weight to the treatment arms where the bracelets did not appear to have a social signaling value because we think they are slightly more comparable to New Incentives’ program.244 While bracelets differ significantly from cash incentives, we think the programs share important similarities—they are both large-scale programs providing an external incentive for vaccination to influence caregiver behavior—so we put modest weight on the findings.
We view the evidence from Kagucia 2018 and Karing, Finetti, and Kuloszewski 2024 as a modest negative update on our prior that positive and negative long-term effects are equally likely after New Incentives’ program is discontinued; however, we continue to put most weight on our prior due to meaningful differences between the programs studied and New Incentives’ program, and the limited sample size in Kagucia 2018. We have not reviewed evidence on the long-term impact of components of New Incentives’ program outside of cash incentives.
Other major uncertainties include:
- Would a program that incentivizes vaccination completion, regardless of timeliness, result in similar negative effects on overall completion rates? The programs studied in Kagucia 2018 and Karing, Finetti, and Kuloszewski 2024 incentivized timely completion.245
By contrast, New Incentives' program offers incentives for vaccination completion, regardless of timeliness.246
We think withdrawing an incentive may cause a caregiver to delay vaccination without causing them to stop vaccination entirely. Caregivers incentivized to complete a vaccination on time (who would have otherwise brought their children in for vaccination later) may also systematically differ from those who only bring their infants in for vaccination because of incentives.
- Both follow-up studies also measured the impact on overall vaccination completion (the behavior New Incentives incentivizes). Kagucia 2018 found similar negative effects on vaccination completion at 12 months.247 Karing, Finetti, and Kuloszewski 2024 found no impact on vaccination completion at 15 months.248 However, we focused on the timely vaccination results because we expect that post-program effects are most closely tied to the behaviors originally incentivized. By only putting weight on the timely vaccination results, we may be overestimating the impact on vaccination completion.
-
How does the perceived value of the incentives impact the size and likelihood of post-program effects? Intuitively, we expect post-program effects to correlate with the value of the incentive and the original program’s impact on vaccination rates. In particular, we expect incentives with a higher perceived value to have larger impacts on vaccination uptake and larger negative post-program effects once withdrawn. However, the existing evidence does not suggest a strong relationship between the value of the original incentive and the magnitude of post-program effects. We do not have a clear understanding of the mechanisms driving the negative effects in either study.
- In Kagucia 2018, the impact of the incentives on vaccination uptake and post-program effects was comparable between treatment arms even though one incentive was more than double the other (200KES vs. 75KES).249 However, the estimates in both the original trial and the follow-up were imprecise, so we do not put much weight in this comparison.
- Karing, Finetti, and Kuloszewski 2024 finds larger negative post-program effects in the treatment arms where the original incentives appeared to have the least social signaling value and smallest impact on vaccination uptake. See above. When we asked the researchers about the relationship between the value of the incentive and post-program effects, they told us that they did not think negative effects were driven by the value of the incentive but instead whether incentives support intrinsic motivation.250
-
Would negative post-program effects be more or less pronounced in northern Nigeria? We do not adjust for differences between the study contexts and New Incentives’ program context because we think it is equally plausible that negative post-program effects would be more or less pronounced in northern Nigeria.
- Baseline vaccination rates were considerably higher in Western Kenya and Sierra Leone, where the two studies were conducted, compared to northern Nigeria.251 Higher baseline vaccination rates could imply higher trust in the healthcare system or stronger existing knowledge about the benefits of vaccination, so there may be a higher risk of negative effects in northern Nigeria if New Incentives’ program is withdrawn.
- Conversely, higher baseline rates in the study contexts could mean there was less room for learning, supply-side strengthening, and other positive long-term effects. These positive long-term effects could mitigate any negative post-program effects from New Incentives’ program (and possibly result in positive long-term effects overall). For example, Sierra Leone was a context with strong existing baseline knowledge and beliefs about vaccinations, so there may have been less opportunity for positive long-term effects from learning.252 We have not reviewed evidence on other aspects of New Incentives’ program, such as its supply-side strengthening activities, which could have persistent positive effects.
-
How does program duration impact the size and likelihood of post-program effects?
In both cases the programs were relatively short, lasting about 2 years. We expect that New Incentives will operate for a minimum of 2 years in any given area and will likely operate for much longer than 2 years in most locations. We think a longer program duration could plausibly result in more or less pronounced post-program effects.
- A longer program duration may result in a higher risk of negative post-program effects among children born soon after the program ends because expectations around receiving incentives become more entrenched.
- Conversely, a longer program duration may result in a lower risk of negative post-program effects because social norms and awareness about vaccination may become more entrenched, leading to increased vaccination rates in the long-term.
-
Would a gradual and responsible exit mitigate or eliminate potential negative effects? New Incentives has plans in place to manage an exit and maintains sufficient funding so it would be able to give staff adequate notice, conduct awareness meetings regarding program changes, coordinate with stakeholders at all levels, and complete the cash transfers for the full immunization schedule for enrolled program participants prior to exit. These phase-out plans have been discussed with stakeholders through Joint States Stakeholders Meetings and other avenues.253
What does this imply for the cost-effectiveness of New Incentives’ program?
In areas New Incentives has not entered, we apply an -11% to -30% adjustment to our cost-effectiveness estimates. In areas where New Incentives’ program is operating, we do not apply an adjustment to our estimate of cost-effectiveness because we think continued funding does not introduce additional negative effects (those were introduced when the program first entered a given area and will materialize when the program exits whether we continue to fund the program or not).
Areas where New Incentives does not currently work
Across states where New Incentives has not entered but where our estimates of cost-effectiveness are above 8x (as of November 2024), we estimate that accounting for post-program effects would decrease cost-effectiveness by -11% to -30%, depending on the location. For simplicity, in all other states where New Incentives has not entered, we apply a -19% adjustment. This adjustment is a simple average of the states where we modeled a location-specific effect.
In simple terms, we calculate the post-program effects adjustment in a given location by estimating the program’s impact on the number of children vaccinated during the program (a positive effect) and after the program (a smaller negative effect). In Niger state, we estimate that for every 100 children who are vaccinated due to the program during the program, 15 will not be vaccinated after the program who would have been vaccinated if the program had never existed.
- We start by estimating how long New Incentives will operate in a particular location, which gives us a rough estimate of the total number of children enrolled and counterfactually vaccinated through the program. In Niger, we expect the program would run for about 3 years and counterfactually vaccinate about 26,000 children.
- For each child enrolled, we estimate the number of younger siblings their caregivers are likely to have after the program is discontinued. On average, we expect each child enrolled will have roughly 1.6 additional siblings who need to be vaccinated after the program ends.
- We estimate what the vaccination rates in those siblings would have been if New Incentives’ program had never entered (~65% in Niger), and we apply our best guess that their vaccination rates will decrease by ~1-3% (depending on whether they are the first or second sibling). In Niger, this means that roughly 3,800 children, who would have been vaccinated if the program had never entered, would not be vaccinated as a result of program withdrawal.
A summary using Niger state is below:
| Niger | |
|---|---|
| What we are estimating | Value (rounded) |
| Estimate of the program’s cost-effectiveness (roughly 2025 through 2027), prior to adjusting for post-program effects | ~8.5x |
| Expected program implementation period (years) | 3 |
| Number of children counterfactually enrolled during the program implementation period (assuming a hypothetical $1 mil grant each year) | ~165,000 |
| Number of children counterfactually vaccinated during the program implementation period | ~26,000 |
| Post-program effects | |
| Counterfactual coverage for post-program children | 65% |
| Reduction in vaccination rates caused by withdrawal of incentives for first sibling born post-program | 2.8% |
| % of children enrolled who will have at least 1 sibling who needs to be vaccinated post-program | 90% |
| Children counterfactually not vaccinated as a result of program withdrawal (1st subsequent child) | ~2,700 |
| % of children enrolled who will have at least 2 siblings who need to be vaccinated post-program | 75% |
| Children counterfactually not vaccinated as a result of program withdrawal (2nd subsequent child) | ~1,100 |
| Total siblings counterfactually not vaccinated | ~3,800 |
| Post-program effects adjustment | 15% |
For our full calculations, see here.
Our main reservations include:
- We view these adjustments as highly speculative. In order to estimate the number of children who are impacted during and after the program, we project forward the program benefits and expected changes to vaccination rates over time. These projections require making guesses about future outcomes; and any number of factors could meaningfully influence how long the program operates in a given area, and change the impact of program withdrawal in the long run. For the states where New Incentives has not entered, we expect this to be less of a concern because we generally expect New Incentives to exit sooner (i.e. within 3-6 years). (more)
- We make rough adjustments to estimate the number of siblings who need to be vaccinated after the program. Our simplified approach does not adjust for a number of factors, including potential changes in birth spacing over time and systematic differences in the populations enrolled by New Incentives. We also do not model any impacts on children in the wider community because we have not seen evidence that suggests spillover effects on children who were only indirectly exposed to incentives. (more)
- We roughly guess that negative program effects would fade out by 50% in each subsequent child. A more persistent negative effect could mean we are underestimating the impact. (more)
More details on our approach:
-
We estimate that New Incentives would exit from Niger in roughly three years. With a hypothetical $1 million grant each year, we estimate New Incentives will enroll roughly 165,000 children over that period of time and counterfactually vaccinate roughly 26,000 (see footnotes for more details).254 This assumes that we (or another actor) would support New Incentives until the program fell below 8x and was discontinued. In practice, there are many factors that could lead to the program ending earlier or later, including that the costs and impact of the program may meaningfully change over time. However, in the short run (~3 to 6 years), we expect these changes to be modest.
-
In Niger, we estimate that roughly 272,000 siblings will need to be vaccinated post-program. Based on the World Bank’s estimates of fertility rates, we estimate that caregivers will have roughly 5 children total.255 But some enrolled children will be the last born in their families, and others will have siblings born in time to be enrolled in the program before it ends. As a simplification, we assume caregivers are reached halfway through childbearing years and will have two additional children after the first child enrolled. We use median birth intervals reported in DHS 2018 to roughly estimate when those additional children will be born, and the total number of siblings who will need to be vaccinated post-program (details in footnotes).256
- Karing, Finetti, and Kuloszewski 2024 suggests that post-program effects may be limited to households that had children who participated in an incentive program.257 Intuitively, we'd expect a community-wide effect in the same direction (positive or negative) as the within-household effect, but a considerably smaller effect. We haven't modeled a separate effect for simplicity because our best guess is that it would be small.
-
We estimate a 3% reduction in the vaccination rates for the next sibling born post-program, and we roughly guess that the effect fades out by 50% with each sibling (see above). We estimate that these children would have had a 65% vaccination rate if the program had never entered.258 In Niger, this corresponds to roughly 3,800 children who are not vaccinated due to program withdrawal,259 or ~15% as many children as the number who benefit from the program itself.
- We estimate that in Niger the post-program effect adjustment would be about -15%. In three states where New Incentives does not currently operate (Niger, Taraba, Yobe), we estimate post-program adjustments ranging from -11% to -30% (the latter for a state with relatively high vaccination rates and short expected program duration).262
For simplicity, in all other locations where the program has not entered, we apply a uniform -19% adjustment based on a simple average of these location-specific adjustments.263
We would consider re-evaluating our adjustment if other changes to our model substantially changed the expected impact of New Incentives’ program.
- As a simplifying assumption, we assume the harm from not being vaccinated is roughly equivalent to the benefits of vaccination. This does not account for likely changes in the impact of vaccination over time (e.g. potential decreases in the impact of vaccination due to increased sanitation or overall health improvements that reduce the transmission of vaccine-preventable diseases).
- A -19% adjustment may underestimate the impact in other locations where New Incentives has not entered because vaccination rates are higher on average, and we generally expect larger adjustments in areas where vaccination rates are higher.264 However, we use a simplified approach because these locations are meaningfully below our current funding bar (8x), and a more precise adjustment does not impact our funding decisions.
Areas where New Incentives’ program currently operates
In areas where we currently support New Incentives’ program,265
we do not apply a negative adjustment to our estimate of cost-effectiveness. This is because our cost-effectiveness estimates without a post-program effects adjustment capture the marginal impact of continued funding.
We think the potential for harm is created when the program first enters a given area, and materializes after the program exits. In addition, we think it is equally likely that each additional year of funding could lead to marginal negative and positive long-term effects. (see above). So our estimate of cost-effectiveness without a post-program effects adjustment captures the marginal cost-effectiveness of continued funding in the areas where New Incentives already operates.
This approach could mean we are overestimating the cost-effectiveness of a particular grant, especially if New Incentives’ program is discontinued relatively soon in the future (i.e. within 5 years) because caregivers enrolled in the later years of the program are more likely to have additional children after the program ends. However, in many areas where New Incentives’ program currently operates, we expect the program to operate for at least 5 years and often many more years.
- In general, we expect New Incentives’ program to operate for longer periods of time (i.e. at least 5 years) in areas where we currently support the program because vaccination rates were lower at the start of the program.266 For each additional year the program operates, we expect an increase in the number of children counterfactually vaccinated due to the program relative to the number harmed after withdrawal. This would result in a smaller adjustment to cost-effectiveness as the program continues: using the same approach outlined above, we estimate an adjustment between -3% to -14% (and this adjustment likely overestimates the effect in areas where New Incentives’ program started several years before 2024).267 This is true even if we took a somewhat more conservative approach that limits operations to 10 additional years.268
- There are any number of factors that could influence how long the program operates in any given area, including changes to GiveWell’s funding bar and grantmaking decisions, and what the impact on subsequent vaccination rates would be.
Future research
We view our best guess as highly speculative given the limited evidence, and we see this as an
important priority area for future research. To address our uncertainties, we plan to proactively seek opportunities to generate evidence through follow-up of incentives programs which had previously been discontinued or setting up opportunities to conduct follow-up of incentives programs which are discontinued in the future.
- Seeking out opportunities to conduct long-term follow-up of previously discontinued incentives programs. We have been in touch with researchers who previously conducted studies of immunization incentives and are discussing the possibility of conducting long-term follow-up on vaccination rates.
- Seeking out opportunities to conduct long-term follow-up of ongoing incentives programs or trials which may be discontinued in the future. We have also been in touch with researchers involved with ongoing incentives studies and are discussing the possibility of collecting data that could make long-term follow-up possible if the interventions are eventually discontinued. While we think these opportunities are more promising, we would likely only see results from programs which are not eventually scaled (and thus, may be difficult to generalize to New Incentives’ program) and we likely would not see results for many years.
Our key open questions that we hope to address through additional evidence generation:
- What is the impact of discontinuing incentives on immunization rates in future children? How would this differ across types of incentives and implementation contexts?
- Does discontinuing incentives lead to a delay in vaccinations or does the removal of incentives lead caregivers to not bring their children in for vaccination entirely?
- Would the impact of discontinuing incentives be limited to caregivers who received the program, or would there be a community-wide effect?
- For how long would effects persist after the program was discontinued?
- Would the effects be larger or persist longer for programs that were implemented for longer periods of time?
- How would the quality of program withdrawal impact the direction, magnitude, or persistence of post-program effects?
4.7 Additional program benefits and downsides
Summary
Our cost-effectiveness analysis includes a number of additional benefits and downward adjustments related to this intervention that we have opted not to explicitly model.269 Instead, we incorporate them as rough percentage best guesses. These adjustments increase our estimate of the impact of New Incentives’ program by 50%.270 See the table below for a summary.
| What we are estimating | Value |
|---|---|
| Lower likelihood of infecting others | 6% |
| Herd immunity | 13% |
| Morbidity effects from directly incentivized vaccines and rotavirus | 6% |
| Mortality and morbidity effects of indirectly incentivized vaccines besides rotavirus (i.e., hepatitis B, polio, yellow fever, meningitis A) | 4%271 |
| Effects during outbreaks | 4% |
| Vaccine-derived polio outbreaks | -2% |
| Serotype replacement | -4% |
| Inflation | -5% |
| Treatment costs averted from prevention | 20% |
| Increased timeliness of vaccination | 4% |
| Investment of income increases | 5% |
| Total (adjustment for additional benefits and offsetting impacts) | 50%272 |
See this sheet for our full calculations. We are particularly uncertain about these adjustments (details on our method in footnote),273 and they should be thought of as rough best guesses. As of September 2024, these adjustments have also not been updated recently, and some may be out of date. We are hoping to revisit them in the future but have not yet prioritized this work.
Additional benefits
We include the following additional benefits in our analysis:274
- Lower likelihood of infecting others (+6%): People who are vaccinated may be less likely to spread infection to others. The size of this effect will depend on (1) how much vaccination reduces transmission, and (2) the proportion of the population that is unvaccinated (the higher this proportion, the greater the benefit would be). This effect is included in more complicated models of vaccine efficacy, and it is possible that ignoring this effect leads us to underestimate vaccine efficacy, especially for diseases with high transmissibility (e.g., measles). We have not yet sought to model these effects, since doing so would add a substantial degree of complexity to our model, but we believe this factor may be worth further investigation, since it is a key component of vaccines' impact.275
- Herd immunity (+13%): High overall vaccination levels in treatment groups suggest that it is possible that New Incentives' program could lead at least some areas to achieve herd immunity276 as the program scales up or in specific areas with high vaccination rates. We have not yet sought to model these effects, since doing so would add a substantial degree of complexity to our model, but we believe this factor may be worth further investigation, since it is a key component of vaccines' impact.
- Morbidity effects (+6%): Our main cost-effectiveness analysis only considers the mortality benefits of vaccines, not the well-being benefits that come from reducing morbidity (illness). We expect this benefit to be relatively small because some rough analysis we have done suggests the overall burden of morbidity from vaccine-preventable disease targeted by New Incentives’ program is relatively small relative to the mortality burden (details in footnote).277
- Mortality and morbidity effects of indirectly incentivized vaccines (+4%): Our main cost-effectiveness analysis only considers the benefits of vaccines that New Incentives directly incentivizes (plus the rotavirus vaccine), not the vaccines it indirectly incentivizes (the vaccines for polio, yellow fever, hepatitis B, and meningitis A). We account for their morbidity and mortality impacts here with a +4% adjustment.278 We excluded these vaccines from our main analysis because we think their benefits are likely to be a small share of the total.279
- Effects during outbreaks (+4%): Our analysis models the impact of protecting children from vaccine-preventable disease at current rates of infection. If there was an outbreak, infection rates could jump and so vaccines might play an additional protective role (either by preventing outbreaks from happening or protecting children when they do). We think this effect is plausible but highly speculative, and our specific adjustment (+4%) is a rough guess.
- Treatment costs averted from prevention (+20%): By reducing childhood mortality and morbidity, vaccination may also avert costs that would have been incurred from treatment of disease. These include the direct costs of treating disease (incurred by households or the medical system) as well as indirect costs (e.g., caregivers taking time off work to care for sick children). We account for this with a +20% adjustment. This adjustment is consistent across all GiveWell’s top charities focused on improving child health.280 We chose to use a consistent figure because our model for estimating the value of costs of illness averted was very similar across three interventions we modeled,281 and we thought that explicitly modeling this would not be worth the added complexity. For more details, see this summary.
- Increased timeliness of vaccination (+4%): The RCT of New Incentives’ program found some evidence that incentives increased the number of children who received vaccines at the recommended ages, primarily for the first dose of the measles vaccine.282 We include this as an added benefit because our understanding is that timely vaccination may be more effective,283 but we are uncertain about the magnitude of this and have not investigated it deeply.
- Investment of income increases (+5%): We think that vaccination might increase people’s incomes in later life (see above). If this is correct, some recipients might invest a portion of their increased income. We include a 5% adjustment to account for this. Including this benefit is consistent with our approach for other programs that we think lead to income increases, although the specific adjustment used varies case-by-case.284
Negative and offsetting impacts
We include the following factors that decrease our cost-effectiveness estimate:
- Vaccine-derived polio outbreaks (-2%): The polio vaccine is one of the vaccines indirectly incentivized by New Incentives' program. Our understanding is that while both types of polio vaccine are protective against disease, the oral polio vaccine (OPV) provides stronger protection against polio transmission than the inactivated polio vaccine (IPV).285 However, OPV may cause outbreaks of polio and lead to paralysis.286 Our understanding is that this is rare.287 We roughly account for this risk with a -2% adjustment.
- Serotype replacement (-4%): Vaccination may lead to higher prevalence of non-vaccine serotypes of the diseases targeted, which could offset some of the beneficial effects of increased vaccination.288 We account for this here with a rough -4% adjustment, but we have not investigated this question in detail.
- Inflation (-5%): Inflation is likely to reduce the value of New Incentives’ cash transfers and may therefore weaken its impact on vaccination rates over time. We have monitored this issue since the RCT by comparing the value of the incentive over time to its real value during the RCT. See this section of our separate page for more details. Overall, we think that the real value of the incentive has fallen over time, but this has not yet shown up in any decrease in retention rates (which we’d expect to see fall if the incentive was less motivating for caregivers). We roughly account for the residual risk that this could cause us to overestimate the cost-effectiveness of New Incentives’ program here.
Factors we have excluded
Potential positive adjustments
-
Job creation: We think it's likely that New Incentives' program provides job opportunities to those that might otherwise struggle to find employment. As of July 2024, New Incentives employs over 2,000 local staff as Field Officers, designed to be an entry-level job for high school or local college graduates.289 Our understanding is that stable, decent paying jobs are hard to come by for this population, and that the Field Officer role provides consistent, reasonable compensation and benefits.290 We do not account for this factor in our cost-effectiveness analysis because we expect it would be a small benefit relative to the health benefits we expect from vaccinations, and because we expect it would be difficult to model given our unfamiliarity with the employment landscape in Nigeria. Benefits from job creation are likely larger for New Incentives than for our other current top charities which employ relatively small program management teams year-round and provide short-term pay to large numbers of community distributors for a few days twice a year (vitamin A supplementation), four or five months per year (seasonal malaria chemoprevention), or once every three years (insecticide-treated nets).
- Increased clinic utilization: It is plausible that New Incentives’ program encourages more clinic visits, which could have spillover effects (e.g., improved uptake of other health programs). IDinsight tested this in the RCT and did not find large effects on clinic utilization (an increase of ~5 percentage points), so we have set this effect to zero.291 It’s possible that not accounting for this causes us to underestimate the benefit of the program (since there was some increase, and IDInsight only gathered data on the proportion of children who visited a clinic at least once, not the number of clinic visits). We have not yet updated our analysis to account for this, but may do so in the future.292
Potential negative adjustments
- Risk of HIV-infected children developing disseminated BCG disease: Children who are HIV-infected when vaccinated with BCG at birth are at increased risk of developing disseminated BCG disease (a disease with symptoms resembling tuberculosis, the disease against which the BCG vaccine is used). According to the World Health Organization (WHO), up to 4 in 1,000 HIV-positive infants vaccinated with BCG develop disseminated BCG disease, and the disease has a case-fatality rate greater than 70%.293 We exclude this factor because the risk is relatively low, WHO recommends that the benefits of vaccination outweigh the risks in most cases,294 and our understanding is that HIV prevalence is relatively low in the areas where New Incentives works.295
- Side effects from repeated immunizations: We believe there is some risk of caregivers bringing children to receive the same vaccine multiple times within a short period. This might negatively affect infants' health beyond the ordinary side effects of vaccinations. However, we expect that this is unlikely to have significant negative effects on the treated population, since (a) we estimate that a relatively small percentage (roughly 10%) of children enrolled in the program receive repeated immunizations (more above) and (b) a brief review of the evidence did not indicate that repeated immunizations are likely to cause significant negative health effects.296
- Security threats to staff: New Incentives works in areas at moderate to high risk of security threats.297
New Incentives reports that, in the 2.5 years up to June 2020, it recorded 23 incidents that were connected to the program in some way and that resulted in theft, injury, or death.298
The list includes incidents that involved program staff outside their work capacity as well as those that did not involve program staff but may relate to the program. Sixteen of the 23 incidents involved theft, including minor theft such as phones and cash. Five of the 23 incidents involved injury, and two involved deaths, including an incident in which two people died and three people were kidnapped. This incident did not involve New Incentives staff directly, but the assailants mentioned a vaccination cash transfer program as a reason for the attack. It is unclear from the report whether they said this because they intended to steal the CCT money or for some other reason.299
As of 2020,300
New Incentives' procedures to decrease risks to its staff included (a) collecting information about potential security threats and communicating with staff about threats and (b) training staff to avoid security threats where possible and address them where necessary. More details about these efforts are discussed in the footnote.301
New Incentives monitors the number of security incidents affecting the program over time. The data we’ve seen shows the rate of security incidents has been relatively steady.302
- Staff discontent and risks stemming from penalization due to strict internal controls: New Incentives runs a program that is by its nature a target for fraud, due to its large-scale handling of cash and the difficulty of providing direct oversight in a dispersed work environment.303
To try to detect and deter fraud, New Incentives has instituted what we consider to be unusually tight controls.304
Failure to comply with these requirements can result in the rejection of staff expenses, and expense falsification or deliberate negligence can result in termination.305
Current and former staff have raised complaints about the strictness of these controls, including that New Incentives is rejecting legitimate work expenses.306
We recommend New Incentives as a top charity in part because its extensive monitoring gives us confidence in the impact of its program, but we may be missing an important downside of the program if those practices are unfairly penalizing the numerous local staff that New Incentives employs. We would consider a poor working environment to be a harm in and of itself, and it could also impede New Incentives' ability to effectively operate its program. New Incentives relies on over 2,000 Field Officers to run its program, and we expect the quality and reach of the program might deteriorate if Field Officers underperformed or quit due to discontent with their employment.
We currently do not account for any potential harms from New Incentives' employment policies quantitatively in our model (nor do we account for potential benefits like reduced unemployment). However, we consider staff discontent to be an important risk to the program. We have asked New Incentives about the recent complaints raised by staff, and so far have been reasonably satisfied with its responses and its willingness to address staff feedback. We find it difficult to weigh the tradeoffs between strict internal controls and staff satisfaction, but ultimately we would expect to see low staff retention (due to voluntary departures and/or terminations) or difficulty filling vacant positions if New Incentives' policies were unfair. So far, New Incentives has not had difficulty recruiting Field Officers and reported a roughly 10% staff turnover rate in 2023, which we think is reasonable.307 We plan to regularly check in with New Incentives about staff feedback, retention, and compensation reviews. - Discontent of people who are not served on a particular day: It is possible that New Incentives' program causes discontent among caregivers who have to wait a long time at clinics or who are not served during a particular immunization day.308 We would guess the negative effects from discontent of this kind are likely small. For example, in 2022, New Incentives reported long wait times as a reason for leaving without being vaccinated for less than 1% of disbursement days.309
- Increased crime: Although we account for some risk of fraud by New Incentives’ staff or caregivers (more on a separate page), we don’t separately account for the risk that New Incentives’ program causes increased crime by third parties (e.g., robberies of staff or caregivers). We’d expect this risk to be relatively low. New Incentives reports nine cases of theft by third parties affecting New Incentives staff (up to 2020).310 New Incentives does not collect information about theft by third parties affecting program participants; it believes the risk is low, in part because caregivers only receive relatively small sums.311
- Increased vaccine supply shortages in areas where New Incentives does not work: It is possible that New Incentives' program increases the likelihood of vaccine supply shortages in areas where New Incentives does not work, via a combination of (a) CCTs and awareness-raising activities increasing demand for vaccines in areas where New Incentives works, and (b) vaccine supply support provided by New Incentives increasing vaccine supply flow to the areas it works by diverting supply from other areas.312 We currently think this risk is relatively low. New Incentives notes that its supply side work supports all LGAs in a state—not just those where the program is operating—and that it is unlikely that supply would be reallocated from one LGA to another.313 However, we have not yet seen data on rates of supply issues in non-New Incentives LGAs. This data would help confirm the extent to which this may be a problem. We plan to keep monitoring this issue as New Incentives scales further, since it’s possible that supply of vaccines will struggle to keep up with increased demand caused by New Incentives’ expansion.
4.8 Grantee-level adjustments
Our cost-effectiveness analyses also include adjustments relating to the specific organizations we recommend rather than the intervention itself. These reflect aspects of the organization’s delivery of a program that might have an impact on cost-effectiveness. Rather than explicitly model these, we apply them as rough percentage best guesses.
We think that these factors reduce the cost-effectiveness of New Incentives’ program by 7% on net.314 A summary of our calculations is below:
| What we are estimating | Value |
|---|---|
| Quality of monitoring and evaluation (more) | -2% |
| Non-funding bottlenecks (more) | -5% |
| Total (adjustment for grantee-level factors) | -7% |
Adjustments in detail
Quality of monitoring and evaluation
We use a downward adjustment of -2% to account for the quality of New Incentives’ monitoring and evaluation.315 This adjustment reflects our best guess at how far weaknesses in its monitoring could inflate its estimates of the program’s cost-effectiveness. This adjustment is small because we have relatively high confidence in New Incentives' monitoring, which involves multiple rounds of checks and audits by different teams.316 We make a small downward adjustment to account for our having spent more total time over years of review interrogating some of our other top charities' monitoring methods, relative to a single round of intensive review of New Incentives' monitoring before adding it to our list of top charities in 2020. See this section of our review of New Incentives as an organization for more details on its monitoring.
We have not revisited this question in detail since 2020. We plan to spend more time on this in the future to understand whether our adjustment is appropriate. In particular, we’re concerned that there may be some forms of fraud that New Incentives’ monitoring and fraud mitigation processes are not able to capture. See this section of our separate page on New Incentives’ program for further details.
Non-funding bottlenecks
This adjustment accounts for any scenario in which New Incentives encounters non-funding bottlenecks to delivering its program, resulting in New Incentives holding funding for a prolonged period without reaching beneficiaries. We apply a rough adjustment of -5% to account for this risk. We think there is a risk that opposition to the program among some government stakeholders could affect New Incentives' ability to operate. While this has not meaningfully impacted New Incentives' operations to date, New Incentives does frequently face other operational challenges. For example, we wrote about Nigeria's telecommunications shutdowns in our May 2022 grant page, and, in 2022, Nigeria started phasing out the existing currency in favor of new bills.317 Our adjustment is relatively small because New Incentives has been operating the program since 2017, and these factors have not yet affected its delivery of the program in a major way.
5. How does the program affect other actors’ spending?
5.1 Summary
Part of our cost-effectiveness analysis involves asking what impact funding a program has on other actors’ spending. New Incentives’ program may lead other organizations or governments to spend more (we refer to this as "leveraging" funding, or “crowding in”) or less (we refer to this as "funging," from “fungibility,” or “crowding out”) on vaccines than they otherwise would.
We include a “leverage and funging” adjustment in our cost-effectiveness analysis to account for this. As of September 2024, our leverage and funging adjustment is -13% to -17%, varying by state (-14% in Bauchi).318 A summary of our calculations is below, using Bauchi as an example.
| What we are estimating | Value |
|---|---|
| Grant size (arbitrary value) | $1,000,000 |
| Value of New Incentives’ spending in Bauchi (more) | 0.077 |
| Subtotal: Total units of value generated by grantee spending | 77,387 |
| Costs covered by other actors per $1 million spent by New Incentives | |
| Nigerian government (more) | ~$350,000 |
| Gavi (more) | ~$291,000 |
| What would happen if we did not fund the program | |
| The Nigerian government would replace New Incentives’ costs (more) | 10% probability |
| The program would be unfunded (more) | 90% probability |
| Estimated value of activities that would be funded by other actors instead of vaccines | |
| Activities funded by the Nigerian government (more) | 0.005 |
| Activities funded by Gavi (more) | 0.007 |
| Change in value under different scenarios (relative to initial estimate of grantee spending) | |
| The program would be unfunded (leverage) | -3,422 |
| The Nigerian government would replace New Incentives’ costs (funging) | -7,233 |
| Final adjustments | |
| Adjustment for diverting other actors’ funding into the program (leverage) | -4% |
| Adjustment for diverting other actors’ funding away from the program (funging) | -9% |
| Total: Adjustment for leverage and funging | -14% |
We think of these adjustments as particularly uncertain inputs in our analysis. Our biggest areas of uncertainty are:
- Our analysis of how other actors will behave if we do not make a grant are necessarily subjective guesses, as we can only speculate about their future priorities and decisions.
- Our adjustments rely on estimates of the value of other programs that other actors might fund instead of New Incentives’ program. We outline the estimates and our reasoning for them below, but these are rough estimates based on limited information. We have also invested considerably less time in producing these estimates than we have in our main cost-effectiveness analyses, and they should be thought of as rougher guesses.
5.2 Leverage
Leverage refers to New Incentives’ program causing other actors to spend more on vaccines than they otherwise would. Specifically, we think that each $1 million spent by New Incentives in Bauchi incurs approximately $640,000 in additional vaccination costs, spent by the Nigerian government and Gavi.
We exclude these leveraged costs from the cost side of the equation when we estimate the number of children vaccinated and deaths averted in the main part of our cost-effectiveness analysis. But the benefit of these resources is already incorporated in our initial impact calculations (because New Incentives would not be able to deliver the program without them).
We account for these resources on the benefit side of the equation by deducting the value of the programs we think they would have been spent on otherwise. This approach means that, although we think programs that leverage other actors’ resources are generally more cost-effective, our leverage adjustment is negative. We estimate that accounting for this effect reduces our initial cost-effectiveness estimate by 4% in Bauchi.319
We use the following reasoning:
- We think that each $1 million spent by New Incentives incurs approximately $640,000 in additional vaccination costs, spent by the Nigerian government and Gavi.320
- Our best guess is that if these funds were not used for vaccines, the Nigerian government and Gavi would have used them for something 6% to 8% as cost-effective as New Incentives’ program in Bauchi.321 In total, diverting these funds away from other programs “costs” -3,802 units of value in Bauchi (calculation in footnote, more on units of value here).322
- We think there’s a ~90% chance that New Incentives' program would not be delivered without GiveWell funding. If this is correct, it implies that GiveWell funding causes the government and Gavi to divert their funding away from other programs into extra vaccinations. For more on the reasoning behind this guess, see the discussion below.
- Our final leverage adjustment involves multiplying -3,802 units of value by 90%, and deducting the total (3,422 units of value) from our estimate of the total value generated by New Incentives’ spending (77,387 units of value).323 This equates to a -4% adjustment.324
- Intuitively, the reason this adjustment is relatively small is that we think the other activities the Nigerian government and Gavi might fund are considerably less cost-effective than New Incentives’ program. This means the value lost from diverting these funds away from other activities is relatively small.
5.3 Funging
Funging refers to GiveWell funding causing other actors to spend less on New Incentives’ program (or a similar vaccine incentive program) than they otherwise would. We estimate that this effect reduces our initial cost-effectiveness estimate by ~9% in Bauchi.325
Our reasoning is:
- We think that there’s a ~10% chance that the Nigerian government would fund this program if GiveWell did not. This is a very rough guess, on the basis that we have seen little interest from the Nigerian government in funding conditional cash transfer programs. For more on our reasoning, see the discussion below.
- If the Nigerian government were to fund a program like this in GiveWell's absence, this implies that the true impact of our funding for New Incentives would be shifting the Nigerian government’s spending away from vaccine incentives into some other program. Our best guess is that the other programs they might fund instead are only ~6% as cost-effective as New Incentives’ program in Bauchi,326 and therefore we would lose 72,330 units of value, relative to our initial estimate of the total value generated by New Incentives’ spending (77,387 units of value) as a result.327
- Because we think that there is just a 10% chance that the Nigerian government would fund this program or a similar one instead of GiveWell, for our final funging adjustment we multiply 72,330 units of value by 10%, and deduct the total (7,233 units of value) from our estimate of the total value generated by New Incentives’ spending (77,387 units of value). This equates to a -9% adjustment.328
- Intuitively, the reason this adjustment is relatively small is that we think there’s only a low probability of the Nigerian government replacing this program in GiveWell's absence. If the chance was higher, it would considerably reduce our estimate of the program’s value. This is because it would imply a high chance that the real impact of our spending was simply to free up Nigerian government funding for other activities that we think are probably less cost-effective.
5.4 Key parameters
Percentage of costs paid by different actors
We estimate the proportion of program costs paid for by different actors. These estimates are based on our cost analysis (discussed above) using cost data from New Incentives, estimates of the impact of the program on vaccination rates, and publicly available data on the Nigerian government and Gavi’s vaccine spending in Nigeria.
Overall, we think that for each $1 million spent on the program, the Nigerian government and Gavi incur an extra $410,000 to $1.1 million in costs.329 These cover the costs of procuring, delivering, and administering vaccines for the additional children vaccinated as a result of New Incentives' program. In Bauchi, these costs come to ~$640,000 (~$350,000 for the Nigerian government, and ~$291,000 for Gavi).330
What would happen if GiveWell did not fund the program?
We make guesses about what would happen to other actors’ funding for vaccines if GiveWell did not fund the program. We currently estimate (as of September 2024):
- There’s approximately a 90% chance that the additional vaccinations caused by New Incentives’ program would not take place without this funding, and therefore that the funding causes the government and Gavi to divert their funding away from other programs into extra vaccinations.331
- There’s approximately a 10% chance that the Nigerian government would fund the program if New Incentives did not (and therefore that the additional vaccinations caused by the program would still take place).332
These guesses should be considered rough, because we have very limited understanding of the Nigerian government’s likelihood of funding the program or a similar one. Some of the points we considered were:
- New Incentives has the support of many government agencies in Nigeria, including the state agencies whose permission it requires to work in clinics in each state and some national health and social protection agencies. But we have also heard from New Incentives that there is some opposition within the Nigerian government to the program. Criticisms include that it may not be sustainable and that there is a risk of vaccination rates falling if the program were to stop.333 All else equal, we think this reduces the probability that the government would fund the program in GiveWell's absence.
- In 2018, the Nigerian government published its ten-year strategy for strengthening vaccination.334 Cash transfers and incentives are not mentioned in the “demand creation” section of the strategy,335 which we interpret as evidence that there is minimal interest in cash transfer programs to increase vaccination rates.
- The World Bank has provided funding for a conditional cash transfer program targeting very low-income households in Nigeria, under which each state can choose the condition for the transfers. We interpret this as evidence of some interest in conditional cash transfers as a program, although when we most recently investigated the program in 2020 we did not place much weight on this because our understanding was that the program was small and may not be focused on vaccines (details in footnote).336 We haven’t deeply investigated what happened to the program since 2020.
- We have not heard about any other large-scale cash incentive for vaccination programs in sub-Saharan Africa other than New Incentives. We think it’s likely that we would have heard about similar programs if they existed, although we haven’t investigated this question systematically.
How valuable is New Incentives’ program, compared to the activities that other actors might fund instead?
Our leverage and funging adjustments estimate the impact of shifting funding to or from vaccines, relative to other activities that governments and global health funders might fund instead. This means that we need to estimate the value of these other activities.
To do this, we compare activities in terms of "units of value," an arbitrary unit GiveWell uses to compare the moral value of different types of outcomes (e.g., increased income vs reduced deaths). We benchmark the value of each benefit to a value of 1, which we define as the value of doubling someone’s consumption for one year. See this document for more details on how we think about comparing value across different interventions.
Our analysis of leverage and funging for New Incentives’ program (using Bauchi as an example) involves three specific estimates:
- New Incentives’ spending in Bauchi (before leverage and funging): 0.077 units of value per US dollar (more)
- Activities that the Nigerian government might fund instead of vaccines: 0.005 units of value per US dollar (more)
- Activities that Gavi funding might be used for instead of vaccines: 0.007 units of value per US dollar (more)
Our estimates of the other activities that might be funded instead of vaccines are based on considerably less work than our main cost-effectiveness analysis, and so we think of them as rougher guesses.
New Incentives’ spending in Bauchi
We estimate that each US dollar spent by New Incentives in Bauchi generates 0.077 units of value. This figure is the final output generated by our cost-effectiveness analysis, after factoring in all adjustments except leverage and funging.337
Activities that the Nigerian government might fund instead of vaccines
We estimate that each US dollar spent by the Nigerian government on vaccines as a result of New Incentives’ spending would generate 0.005 units of value if used for other activities.338 This is around 6% as valuable as New Incentives’ spending in Bauchi.339
In summary, our approach to estimating this is:
- We estimate that 80% of these resources would be used on health programs, 10% would be used for education programs and 10% would be used on social security programs.340 This is a very rough best guess, for which we have not done any in-depth research.
- Next, we estimate the value of spending in each category, using some rough guesses and data on the Uganda government’s spending breakdown in 2013-2014, which we take as a proxy for government spending by low-income countries. Details on our approach are in this footnote.341
This results in the following estimates:
- Health: 0.0056 units of value per US dollar spent
- Education: 0.0028 units of value per US dollar spent
- Social security: 0.0026 units of value per US dollar spent
- Finally, we take a weighted average of the value of each type of spending, with our guesses about how the spending would be allocated (80% health / 10% education / 10% social security) as the weights. This results in an overall estimate of 0.005 units of value per US dollar spent.342
Activities that Gavi funding might be used for instead of vaccines
We estimate that each US dollar spent by Gavi on vaccines as a result of New Incentives’ spending would generate 0.007 units of value if used for other activities.343 This is around 9% as valuable as New Incentives’ spending in Bauchi.344
Our reasoning is discussed in detail in this document. The main assumption underlying our estimate is that Gavi has a track record of successfully fundraising for its full desired portfolio.345 This implies that we should value the activities that might be funded instead of vaccines in terms of the activities that Gavi donors would fund instead, rather than the value of Gavi programs themselves. Gavi donors are primarily high-income countries and the Gates Foundation. We therefore roughly estimate the value of the activities that we think these donors would fund instead of Gavi.
6. Additional perspectives beyond our cost-effectiveness model
6.1 Summary
In theory, our cost-effectiveness analysis intends to capture the total impact of a program per dollar spent. But we recognize that our cost-effectiveness calculations are not able to capture every factor that could make a program more or less impactful. Focusing only on our cost-effectiveness model may mean we’re missing things that are difficult to quantify.
As a result, we think it’s helpful to look at other perspectives and types of evidence that may not be captured in our bottom line cost-effectiveness number. Some additional questions we have considered are:
- Is there evidence that New Incentives’ program is working effectively at scale? (more)
- Is there evidence that large-scale vaccine roll-outs lead to reductions in child mortality? (more)
- Could we promote vaccine take-up in other ways? (more)
- Do experts and practitioners see the program as promising? (more)
- Is it intuitively plausible that the program is cost-effective? (more)
- How does our cost-effectiveness model compare to others? (more)
- Does the program have unintended negative consequences? (more)
- How accurate was our analysis of New Incentives’ program in hindsight? (more)
- Will New Incentives’ program remain impactful in the future? (more)
We see asking these questions as a type of “cluster thinking,” or considering a program from multiple perspectives. The more additional perspectives we’ve considered, in general the more confident we are in our funding recommendations.
Overall, none of the work we’ve done on these questions has substantially undermined our view that the case for New Incentives is strong. However, we’ve spent considerably less time and effort engaging with these questions than we have on our main cost-effectiveness model. Some of the questions we’re uncertain about are:
- Is there evidence that New Incentives’ program is working effectively at scale? Our analysis of New Incentives’ program relies on extrapolating from the 2018-2020 RCT, when New Incentives was operating at a smaller scale. Based on monitoring data we’ve reviewed since the RCT, we think New Incentives has been able to deliver the program at a similar high quality as it has grown (more).
- How does our cost-effectiveness model compare to others? We use a relatively simple model to estimate the benefits of vaccination, and it's possible this means we’re not properly accounting for the community-level benefits of vaccination (more).
6.2 Is there evidence that New Incentives’ program is working effectively at scale?
Why is this important? Our analysis of New Incentives’ program is based on extrapolating data from the 2018-2020 RCT to new locations, and applying a number of adjustments. It’s possible that the program’s impact is lower than this method would suggest (e.g., if New Incentives’ rapid growth meant it was not able to maintain the same level of oversight over the program as during the RCT).
How we’ve accounted for this
Our bottom line: The monitoring data we’ve reviewed has remained broadly stable since the RCT. We interpret this to mean that New Incentives has been able to deliver the program to a similar high quality as it has grown, although we plan to keep monitoring this. We also plan to incorporate survey data on vaccination rates in locations where New Incentives works as another source of evidence to check the program is having the expected effect at scale.
In more detail:
- Since the RCT, we’ve analyzed several types of monitoring data collected by New Incentives. We’ve focused on indicators that help us understand how the program’s impact at scale might differ from the RCT. These include the proportion of enrolled children who receive follow-up vaccines (retention), data on supply issues in New Incentives’-supported clinics, and the real value of the incentive accounting for inflation.
- We discuss our findings on our separate page. Overall, the indicators we’ve analyzed have been largely stable since the RCT. An exception is on supply-side issues, where we’ve seen an increase in stockouts (clinics running out of vaccine) over time, as discussed in the footnote.346 Our impression is that the data we’ve reviewed is relatively high-quality, although we’ve subjected it to fewer methodological reviews than monitoring data from our other top charities, and it’s possible there are weaknesses in the data we’ve missed. We plan to keep monitoring these indicators as New Incentives continues to grow.
- We also plan to begin incorporating data from household surveys of vaccine coverage into our analysis. In September 2021, New Incentives began conducting these surveys to assess baseline vaccination coverage before starting to work in new areas.347 It then conducts follow-up surveys to reassess vaccination coverage over time. We discuss these surveys in more detail here.
- Because these surveys produce observational data that can’t isolate the impact of New Incentives’ program from other factors, they have limitations as a way to estimate the causal impact of its program. However, we see them as a potentially valuable additional source of evidence to check that its program is having the expected effects on vaccines outside experimental conditions. We plan to incorporate them into our analysis in the near future. As of February 2024, we have only just started reviewing the data and so we currently do not put any weight on them. More information on how we expect to use this data can be found in our pre-analysis plan here.
6.3 Is there evidence that large-scale vaccine roll-outs lead to reductions in child mortality?
Why is this important? We largely rely348 on randomized controlled trials (RCTs) for evidence about the impact of vaccines on child health. In general, it strengthens our confidence if there’s evidence from large-scale observational studies that shows impacts similar to the impacts shown in studies conducted in experimental conditions. There might be a number of reasons why these programs might not be delivered to the same quality at scale.
Our bottom line: We have lightly reviewed three studies finding that large-scale vaccine roll-outs are associated with reductions in child mortality. We don’t put any weight on these in our analysis because they don’t significantly affect our conclusions and it is challenging to demonstrate causation based on an observational methodology.
How we’ve accounted for this
- We’ve spent very little time cross checking our main analysis of vaccines against large observational studies. In part, this is because our impression is that vaccines are reasonably uncontroversial as a priority among the global health community (more below). We think it’s unlikely that the vaccines included in New Incentives’ program don’t have significant impacts on child mortality.
- In 2023, we tested our assumptions with some rough internal analysis of three large-scale vaccine studies of PCV (King et al. 2020) and the rotavirus vaccine (Bar-Zeev et al. 2018, and Sifuna et al. 2023).
- Our findings, from a light-touch review, were that each of these studies found that vaccine roll-out was associated with a substantial reduction in child mortality (details in footnote).349
- Because we thought that the findings broadly aligned with our analysis, and there were likely to be challenges in using these studies to demonstrate causation, we have not published this analysis or prioritized further work.
6.4 Could we promote vaccine take-up in other ways?
Why is this important? New Incentives’ program (~$18 per child enrolled) is reasonably expensive compared to other programs GiveWell typically funds. There might be other ways to increase vaccination rates that would be cheaper.
How we’ve accounted for this
- GiveWell has funded other programs for increasing vaccination in other locations, including other conditional cash transfer programs. In October 2021, GiveWell recommended a three-year grant of up to $25 million to IRD Global, to implement a mobile phone-based conditional cash transfer program in Sindh Province, Pakistan. IRD Global’s program provides mobile cash payments to caregivers who take their children to health clinics for routine vaccinations.350
- We haven’t yet systematically investigated the landscape for promoting vaccine take-up. We’re actively thinking about this question, and considering other programs we could fund in addition to New Incentives to increase vaccination rates.
6.5 Do experts and practitioners see the program as promising?
Why is this important? We’re more confident in programs which have wide support from experts and government authorities in the countries where they’re delivered and the global health community more widely.
How we’ve accounted for this
- Relative to other GiveWell top charities, we’re less confident that New Incentives’ program commands widespread support from the health authorities in Nigeria and other global health actors. Reasons we’re unsure about this include:
- Overall, our understanding is that New Incentives’ relationships with authorities at the state level are reasonably strong, and New Incentives is also supported by a number of health and social protection agencies at the federal level. However, there is some opposition to the program among some members of the Nigerian federal authorities. We discuss New Incentives’ relationships with the health authorities in locations where it works on a separate page.
- We’ve seen little interest from other vaccine funders in funding programs similar to New Incentives (more above).
- We plan to learn more about this in the future (e.g., through conversations with health officials in Nigeria, and other major global health funders), alongside efforts to better understand the arguments that New Incentives’ program could lead to falling vaccination rates if it stops working in a given area (more above). We have not conducted this work yet.
- On the other hand, we’re confident that increasing routine vaccination coverage is widely seen as a priority for the global health community, and vaccines are generally supported. We haven’t investigated this systematically, but one factor driving our understanding of this is that Gavi has not faced budgetary constraints in its fundraising (e.g., pledges to Gavi for both the 2016-2020 and 2021-2025 period met or exceeded its replenishment target).351
6.6 Is it intuitively plausible that the program is cost-effective?
Why is this important? In general, we are more confident in our funding recommendations if we can easily explain the intuitive case for why a program is cost-effective. Thinking through the intuition behind a program can help us reveal where we might have made mistakes.
How we’ve accounted for this
- Overall, we think that the intuitive case for New Incentives (set out in detail in the report summary) is very strong.
- In their most simple terms, GiveWell’s cost-effective analyses can be boiled down to the following components: (a) burden (does the intervention tackle a big problem), (b) impact (does the intervention have a significant impact on the problem), (c) cost (is the intervention cheap to deliver), and (d) impact of our funding the program on intervention uptake (does our funding lead to more people receiving the intervention). Although New Incentives is moderately expensive relative to other programs GiveWell funds, the program performs strongly on all the other criteria since:
- We also think it’s plausible that New Incentives’ program would increase vaccination rates, based on our understanding of the barriers to vaccination in areas where New Incentives works. Before the RCT, IDInsight surveyed caregivers who had missed one or more vaccinations and asked why their child hadn’t received all the recommended vaccines.352 The most commonly cited reasons related to awareness ("lack of knowledge," 53%) or "ambivalence" (11%), both factors that we’d expect cash incentives to partly address. Less than 15% of the sample reported factors indicating vaccine hesitancy ("mistrust or fears," 5.5%; and "socio cultural reasons," 7.3%), which we’d expect to be less easily addressed by incentives.353 This kind of evidence strengthens our confidence that the RCT result is solid.
6.7 How does our cost-effectiveness model compare to others?
Why is this important? GiveWell’s analysis is only one attempt to model the cost-effectiveness of different global health programs. We would find it concerning if other analyses implied that the program or similar programs were significantly less cost-effective than we currently estimate.
How we’ve accounted for this
- As of October 2024, we’ve spoken with several other modelers and conducted light checks of our model against others such as Carter et al. 2024. This work is still ongoing, but we’ve identified several common divergences between our analysis and others that we are investigating further: (i) other models of routine childhood vaccinations, such as Carter et al. 2024, estimate a very large impact from the measles vaccine whereas measles vaccination contributes to a small share of under-5 benefits in our model (~8% in Bauchi as of December 2024, see this worksheet) whereas other models suggest minimal impact.354
- We see this as a particularly significant source of uncertainty for New Incentives. We have previously received feedback that our analysis would benefit from input from epidemiologists and disease modelers.355
- We essentially use a “static” model based on vaccine efficacy figures reported in RCTs, before adding supplemental adjustments to account for the community-level benefits of vaccines (i.e., benefiting everyone in a community by reducing overall transmission of a disease). Our understanding is that these may be a significant proportion of vaccines’ overall benefit, but we have not deeply investigated whether these adjustments are the appropriate size. We also haven’t accounted for how the size of transmission benefits might vary according to the level of vaccine coverage in the locations where New Incentives works. It’s possible that this means we’re missing important factors.
- We plan to get input from disease modeling experts and epidemiologists as a future priority and do a deeper review of the literature on the transmission benefits of vaccination.
6.8 Does the program have unintended negative consequences?
Why is this important? When trying to estimate the total impact of New Incentives’ program, we need to offset the benefits with any negative impacts.
How we’ve accounted for this
- We explicitly account for three potential negative consequences from the program: serotype replacement and vaccine-derived polio outbreaks, discussed here, and post-program effects, discussed here. We also discuss some potential negative factors we’ve excluded from our model in this section.
- Overall, we think the negative impacts of New Incentives are relatively small in comparison to the benefits, and in the same range as other programs we see as very effective. However, we may not have considered all the possible downsides, and we have not investigated some of these issues recently. An exception is the question about whether New Incentives’ program could cause a reduction in vaccination coverage after the program ends, where we have more significant uncertainty.
6.9 How accurate was our analysis of New Incentives in hindsight?
Why is this important? Our cost-effectiveness analyses are “forward-looking.” They aim to project the future impact of funding a program at the time we make a grant decision. We would be concerned if backward checks of our analysis found significant problems we hadn’t considered at the time we made our decisions, or were overly optimistic in general.
How we’ve accounted for this In 2025, we published a “lookback” that compared the impact of New Incentives’ grants to our initial expectations. The full lookback can be read here. From that page:
New Incentives offers small cash incentives to increase coverage of routine childhood vaccination in northern Nigeria. Since 2020, GiveWell has directed over $120 million to New Incentives for the years 2020-2026. New Incentives is a top charity, and we think it is one of the most impactful programs donors can support.
This page provides a lookback on our grants to New Incentives since 2020. We assess these grants’ performance against initial expectations and identify key lessons learned.
Since GiveWell began funding New Incentives, it has scaled substantially (from ~70,000 children in 3 states in 2020 to ~1.5 million children in 9 states in 2023).
We now think New Incentives is twice as cost-effective as we thought when we made the initial expansion grants (starting in 2020). When we made those grants, we estimated New Incentives was ~11x as cost-effective as cash transfers. As of December 2024, we estimated it's ~22x in the original 3 states and ~9x-38x across all 9 states. At that time we estimated that our funding so far to New Incentives has or will avert ~27,000 deaths. If we had used our initial cost per child enrolled assumptions, this estimate would be ~17,000. We would make these grants again, knowing what we know now.
The increase in our estimate of cost-effectiveness is driven primarily by a large drop in cost per child enrolled (from ~$39 in 2020 to ~$18 in 2024). We think this is due to economies of scale, efficiency efforts by New Incentives, and the devaluation of the naira. However, we haven’t deeply investigated the reasons for the decline in costs, and given the impact of this change in our cost-effectiveness estimates, we think this is worth probing further. We also plan to explore whether we’re underestimating the potential for this type of decline in costs at scale for other programs we’ve considered. We plan to do this in 2025.
Additional takeaways and next steps:
- Data collected by New Incentives suggest the program has maintained a similar level of quality even during scale-up (e.g., ~90% retention through the vaccination schedule in 2020 and in 2024). However, at the time of conducting this lookback, we were waiting on surveys that measure vaccination coverage pre and post New Incentives’ entry to see if the effect matches our predictions. We think this will provide a more reliable measure of quality of implementation at scale. We expect to review these data in 2025.
- While we’ve been able to learn a lot about program implementation from conversations and data from New Incentives, we think we’ve historically underinvested in speaking to local stakeholders in Nigeria, including government officials, and vaccine experts. We spoke to some local officials as part of our most recent grant to New Incentives, and plan to do more of this going forward.
We expect to conduct more lookbacks on New Incentives’ program in the future.
6.10 Will New Incentives’ program remain impactful in the future?
Why is this important? Our cost-effectiveness analysis aims to model the impact of our funding at the time we make a grant, but this may reflect program delivery several years in the future. We could be making mistakes if we don’t anticipate likely changes.
How we’ve accounted for this
- In general, we have paid more attention to making our analysis accurate at the time we make a grant, and less to anticipating future changes. This is a possible weakness in our approach and something we aim to improve in the future.
- Our biggest source of future uncertainty is what would have happened to vaccination rates (which were rising in northern Nigeria before New Incentives scaled up) in the future in the absence of New Incentives’ program. Our best guess is that they would have continued to rise, implying less room for New Incentives to increase vaccination rates. We account for this in our analysis at the moment by assuming the proportion of unvaccinated children would decrease by 5% each year absent New Incentives' program, but this adjustment is uncertain (more above).
- We haven’t deeply considered how changes in the routine immunization schedule could affect the program. The biggest likely change we know of is the roll-out of malaria vaccines, following the approval of the RTS,S vaccine by the WHO in 2021 and the R21 vaccine in 2023.356 This could plausibly make New Incentives’ program more cost-effective (because it is incentivizing vaccines with higher total impact), or less effective (if availability of malaria vaccines increases caregivers' willingness to visit clinics for several rounds of vaccines, independent of cash incentives), but we haven’t deeply investigated this. Our guess is that malaria vaccines are more likely to increase than decrease the cost-effectiveness of New Incentives' program.
7. Previous New Incentives grants
8. Sources
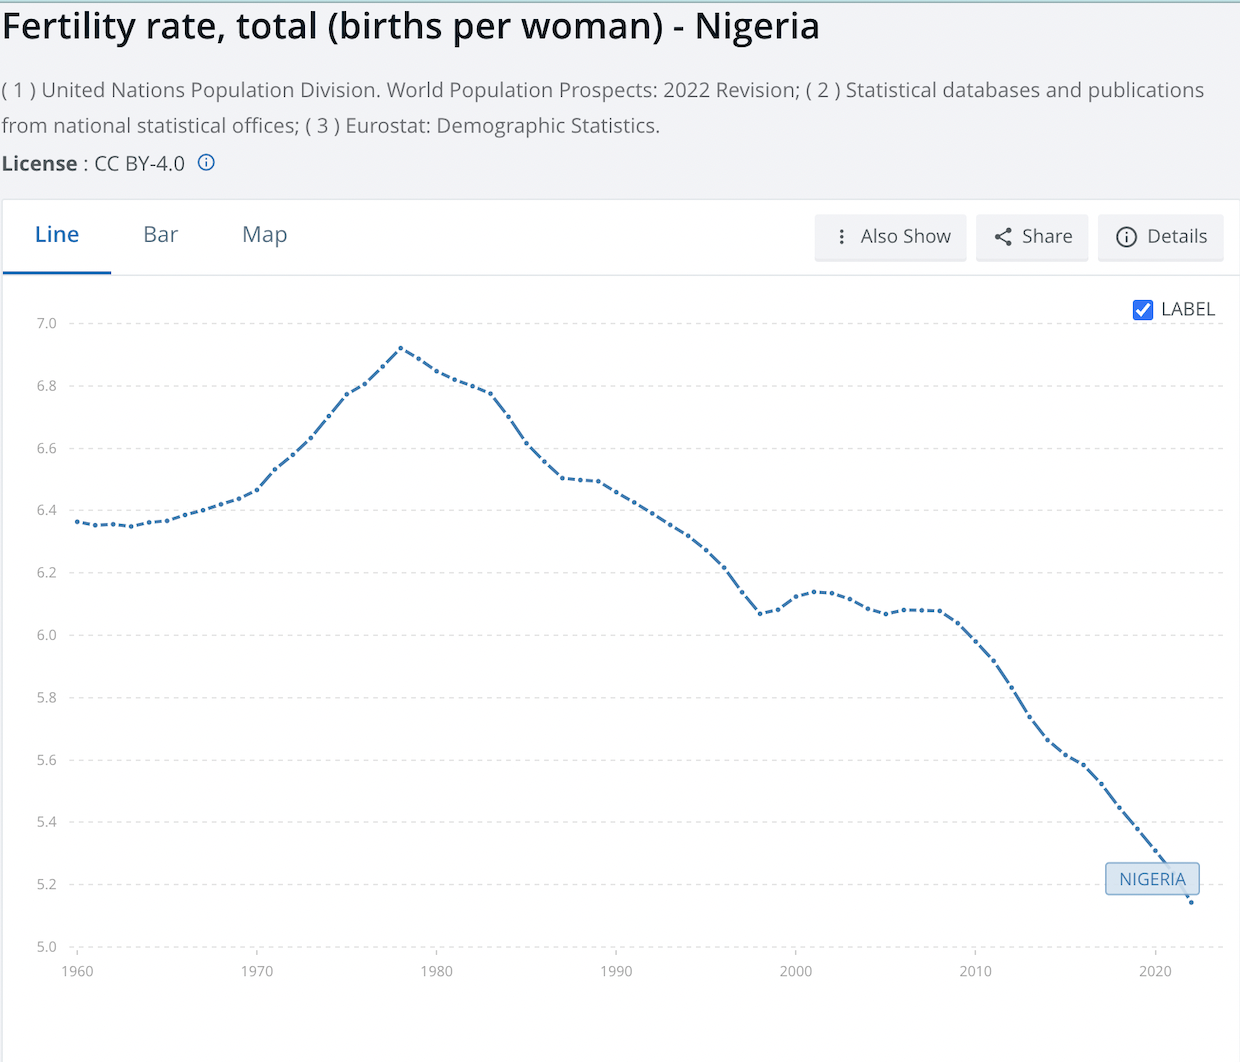
- 1
See this row in our cost-effectiveness analysis.
- 2
“Vaccines train your immune system to create antibodies, just as it does when it’s exposed to a disease. However, because vaccines contain only killed or weakened forms of germs like viruses or bacteria, they do not cause the disease or put you at risk of its complications.” World Health Organization, “Vaccines and immunization.”
- 3
See World Health Organization, “Immunization dashboard”, “Vaccination coverage globally” section.
- 4
See the following maps showing each country’s vaccination rates for the main vaccines we model in our analysis of New Incentives’ program:
- DTP: see Nigeria (56% vaccinated) in the following map, which uses the WHO/UNICEF, “DTP3 (% of one-year-olds immunized)" dataset.. Our World in Data, "Share of one-year-olds vaccinated against diphtheria, pertussis, and tetanus," 2021
- BCG: see Nigeria (75% vaccinated) in the following map, which uses the WHO/UNICEF, “BCG (% of one-year-olds immunized)" dataset. Our World in Data, "Share of one-year-olds vaccinated against tuberculosis, 2021"
- Measles: see Nigeria (59% vaccinated) in the following map, which uses the WHO/UNICEF, “MCV1 (% of one-year-olds immunized)" dataset. Our World in Data, "Share of one-year-olds vaccinated against measles, 2021"
- HiB: see Nigeria (56% vaccinated) in the following map, which uses the WHO/UNICEF, “Hib3 (% of one-year-olds immunized)" dataset. Our World in Data, "Share of one-year-olds vaccinated against Haemophilus influenzae type B, 2021"
- PCV: see Nigeria (52% vaccinated) in the following map, which uses the WHO/UNICEF, “3.b.1 - Proportion of the target population with access to pneumococcal conjugate 3rd dose (PCV3) (%) - SH_ACS_PCV3" dataset. Our World in Data, "Share of children vaccinated with pneumococcal conjugate, 2021"
- Rotavirus: Nigeria has no data for rotavirus, based on the WHO/UNICEF, “RotaC (% of one-year-olds immunized)" dataset. See this map: Our World in Data, "Share of one-year-olds vaccinated against rotavirus, 2021"
- 5
- “Northern Nigerian communities were less likely to be vaccinated compared to Southern Nigerian communities. Studies suggested this was driven by higher levels of education and wealth in the South, higher proportions of Muslim households in the North, and greater insecurity in the North.” Mahachi et. al, 2022
- See also National Bureau of Statistics and United Nations Children's Fund, Multiple Indicator Cluster Survey 2021, Statistical Snapshot Report, 2022, p. 30, figure labeled “Immunisation Coverage across Nigeria.”
- 6
- “In partnership with WHO, Gavi, the Vaccine Alliance, UNICEF, and other partners, the Government of Nigeria, through the National Primary Health Care Development Agency (NPHCDA), administers 13 vaccines on its Expanded Programme on Immunization (EPI) schedule.” World Health Organization, “Beyond the numbers—Nigeria steps up measures to reach eligible children with potent vaccines,” May 19, 2023.
- “The Expanded Programme on Immunization (EPI) was launched in 1974 to ensure that all children, in all countries, benefited from life-saving vaccines… There are now 13 vaccines (antigens) recommended by WHO for the EPI programme.” World Health Organization, “Essential Programme on Immunization”.
- 7
- "In Nigeria, routine childhood vaccinations are provided at government clinics free of charge, but caregivers often find it difficult to afford transportation and face other challenges to taking their baby to a clinic – often half a day’s trip away or longer. These round-trip journeys to the clinic must be made six times to complete a childhood routine vaccination schedule, all within the first year of a baby’s life." New Incentives, "How it works"
- See the infographic at New Incentives, "How it works".
- 8
This conversion uses the naira:USD market exchange rate, which the Nigerian Central Bank reported as 1,165 naira per $1 as of April 25, 2024. See this page(archived version available here). 11,000 / 1,165 = 9.442.
New Incentives has made a number of updates to the incentive schedule (originally 4,000 naira for all incentivized vaccinations) over time:
- New Incentives originally added a 500 naira incentive for measles 2 (which had not yet been introduced into Nigeria's routine vaccination schedule at the time of the RCT). This brought the total incentive across all visits to 4,500 naira. In early 2023, New Incentives increased the incentive for measles 2 to 1,000 naira. This brought the total incentive across all visits to 5,000 naira.
- In August 2023, New Incentives decided to change its schedule to offer 1,000 naira per visit (6,000 in total).
- In April 2024, New Incentives decided to pilot offering an additional 5,000 naira incentive at the measles 2 vaccination visit for caregivers whose infants completed the entire routine immunization schedule. As of May 2024, New Incentives had begun piloting this additional incentive in a few clinics, and expected to roll it out across the program later in 2024, conditional on the pilot proceeding well.
New Incentives, January 14th 2022, December 16th 2022, September 8th 2023, May 13th 2024 Program Updates (unpublished).
- 9
“CCTs are now present in 64 countries, a dramatic increase from 2 countries in 1997 and 27 in 2008.”
“Conditional cash transfers (CCTs) are periodic monetary benefits to poor households that require beneficiaries to comply with specific behavioral requirements to encourage investments in human capital (such as school attendance, immunizations, and health checkups).” World Bank Group, The state of social safety nets 2015, p. 1 and 8. - 10
- Adapted from New Incentives, "How it works"’.
- We directly model the benefits of increasing coverage of the directly incentivized vaccines and the rotavirus vaccine in our cost-effectiveness analysis. We do not directly model the remaining indirectly incentivized vaccines. We expect that they will provide only a small proportion of the overall benefits and so the additional time required to directly model their benefits would not be worth the added complexity (more below). Instead, we account for these vaccines with a rough percentage adjustment (+4% as of February 2024) elsewhere in our analysis.
- 11
Oral polio vaccine.
- 12
Inactivated polio vaccine.
- 13
- “We closely collaborate with the state governments of Bauchi, Gombe, Jigawa, Kaduna, Kano, Katsina, Kebbi, Sokoto, and Zamfara in northern Nigeria.” New Incentives, “Our work” page (as of February 2024).
- Note: Our cost-effectiveness analysis includes columns representing all 36 states in Nigeria and the Federal Capital Territory, but New Incentives does not currently operate in most of those states.
- 14 We assigned 25th and 75th percentiles to key parameters based on our subjective impression of how uncertain we thought our best-guess was. Considerations that affected this choice included: whether we had evidence informing the parameter; sampling error attached to empirical estimates; whether we felt confident in the underlying theoretical mechanism; whether experts we spoke to tended to agree with the magnitude of our estimate.
To convert these 25th and 75th percentiles on our inputs into a distribution of cost-effectiveness estimates, we run monte carlo simulations, taking 500 draws from each parameter independently. In doing so, we make 2 simplifying assumptions:- Uniform distributions on each parameter
- No covariance between parameters (i.e. independent draws)
The p25 and p75 of our cost-effectiveness estimates are the 25th and 75th percentiles of the resulting distribution. Sometimes, we subjectively inflate or deflate the resulting distribution if we think it doesn’t appropriately capture how uncertain we feel about our cost-effectiveness estimate.
- 15
We use the term “counterfactual” to refer to the state of the world that would exist if we did not provide funding to a grantee for a program. In this case, we refer to children who are “counterfactually vaccinated” to mean children who are vaccinated as a result of New Incentives’ program who would not otherwise have been vaccinated. We exclude children whose caregivers receive the cash incentive, but who we think would have been vaccinated anyway, even without the program.
- 16
$1 million is an arbitrary amount that we use to quantify the benefits of the program in the rest of our analysis.
- 17
See this row of our cost-effectiveness analysis.
- 18
We calculate this by dividing $1 million by our estimate of the number of additional children reached by the program in each state, e.g., ~10,200 in Bauchi.
- 19
See this row of our cost-effectiveness analysis. Note that this is a forward-looking estimate of what New Incentives' cost per child enrolled will be in 2024. We chose to use a forward-looking projection here rather than relying on cost data from previous years because New Incentives is making some changes to its program in 2024 that we think should be factored into our cost per child estimate. The biggest change from a costs standpoint is the introduction of an additional 5,000 naira incentive for caregivers whose infants complete the full routine immunization schedule.
For more details, see this section of our November Top Charity Fund allocation to New Incentives.
This additional incentive brings the total incentives available to caregivers from 6,000 naira to 11,000 naira, which we think is a substantial enough change to warrant an adjustment to our cost per child calculations. Our cost per child estimate relies on New Incentives' assumptions about how program changes will affect its cost per child and about the foreign exchange rate it will receive in 2024. While relying on New Incentives' assumptions could cause us to over or underestimate cost per child, we were uncertain whether attempting to model the impact of the program changes ourselves would produce a more accurate estimate, and ultimately did not think the capacity tradeoff was worthwhile. See our cost per child estimate here. - 20
See this sheet in our analysis for a breakdown by category.
- 21
We estimate that the cost per child fell from $38.91 between March 2020 and December 2020 to $17.26 between January and December 2023. We think this is because a decreasing share of New Incentives’ overall costs were start-up costs during that period. See this row in our analysis.
- 22
$23,399,097 / 1,518,511 = ~$15.41. See calculation here.
- 23
For more details, see this section of our November 2023 Top Charity Fund allocation to New Incentives.
- 24
See New Incentives' estimate here.
- 25
Note that this foreign exchange rate assumption represents New Incentives' best guess as of February 2024, but the real foreign exchange rate is likely to fluctuate. Our understanding is that Nigeria operated two exchange rates, an official rate and a parallel rate, until June 2023, but after that time has allowed the exchange rate to be set by the market.
“Nigeria has for years operated multiple exchange rates for the naira—with the official exchange rate dictated by the central bank, while a far higher unofficial rate determined the price of imported commodities like wheat, which are priced in dollars. The exchange rate now will be determined by market forces and no longer the central bank, a move that analysts on Thursday said would boost inflows of money and help stabilize an economy battered by surging inflation and a record unemployment rate.” Associated Press, "Nigeria lets market set currency exchange rate to stabilize economy, woo investors, 2023.
- 26
Our calculation is based on:
- Expected BCG scar rate: 90%. This is based on a quick literature review. We found three studies reporting scarring rates of 82-96%. These average to 87% (unweighted) which is roughly in line with the 90% cited by WHO as the BCG scar rate in its 2018 position paper ("BCG vaccination usually causes a scar at the site of injection due to local inflammatory processes. However scar formation is not a marker for protection and approximately 10% of vaccine recipients do not develop a scar." p. 84). We therefore use 90% as our rough best guess for the BCG scar rate. (More details above).
- Scar rate in New Incentives’ monitoring data: New Incentives tracks the percentage of enrolled children with BCG scars. In 2023, it found that 99.64% of children had one BCG scar and 0.01% had two scars (New Incentives monitoring results as of December 2023). This is higher than the 90% rate we’d expect. Our best guess is that the explanation for this is that some children received the BCG vaccine more than once, and developed a scar on a subsequent occasion even if they didn’t scar at first.
- We calculate our ~10% repeat enrollment estimate as the difference between the expected and actual scar rate / the expected scar rate + the percentage of children with two or more scars in 2023. This is 10% / (90% + 0.01%) = 10.72% See this section of our analysis for our calculations.
- 27
See here for this calculation.
- 28
See here for this calculation.
- 29
Our calculation is based on publicly available data on vaccine coverage, costs, and population size between 2014 and 2018:
- Vaccine coverage: We estimate that overall vaccine coverage was 51% in Nigeria between 2014 and 2018, using WHO and UNICEF estimates of coverage (available here).
- Vaccine costs: We use publicly-available WHO estimates of expenditure on routine vaccinations between 2014 and 2018, compiled in this sheet. The WHO estimates that total spending in this period in Nigeria was ~$1.6 billion ($314 million per year), and the government covered around 29% of this. See this section of our analysis.
- Population size: We use estimates from the Global Burden of Disease project (compiled here) that the average population under age 1 in Nigeria was ~6.9 million between 2014 and 2018. Assuming 51% of these children were vaccinated, this implies 3.5 million children per year vaccinated.
- % of fixed costs: Our estimates are for the cost of each additional child vaccinated to the Nigerian government and Gavi. We would guess that this is lower than the average cost of each child vaccinated, because some proportion of total costs are fixed costs. We estimate that 30% of total costs to these actors for routine vaccinations are fixed costs. This is a very rough guess.
Using these inputs, we estimate that each additional child vaccinated costs $62.92. ($314m x (100% - 30%) / ~3.5m children = $62.92. See this section of our analysis for our calculations.
Finally, we roughly allocate costs between Gavi and the Nigerian government (as indicated in this section):- Based on the WHO data cited above, we estimate that the Nigerian government covered 29% of vaccine costs between 2014 and 2018, and Gavi covered 71%.
- Based on Nigeria’s 2022 - 2024 strategy for immunization, which sets out a roadmap for transitioning vaccination spending to the government over time, we estimate that future costs will be covered 80% by the government and 20% by Gavi.
- A straight average of these gives an estimate of 54% costs covered by the government and 46% covered by Gavi. This is a rough guess.
- Multiplying these percentages by the total cost per additional child vaccinated ($62.92) gives our final estimates of $34.29 per additional child vaccinated to the government, and $28.64 to Gavi.
- 30
See this row of our cost-effectiveness analysis. .
- 31
We estimate that the cost per child fell from $38.91 between March 2020 and December 2020 to $17.26 between January and December 2023. We think this is because a decreasing share of New Incentives’ overall costs were start-up costs during that period. See this row in our analysis.
- 32
See this row of our cost-effectiveness analysis.
- 33
See this row of our cost-effectiveness analysis.
- 34
We use the term “coverage” to refer to the proportion of children vaccinated. We define “baseline vaccination coverage” as the proportion of children who would be vaccinated in the absence of New Incentives’ program.
- 35
See this row of our cost-effectiveness analysis.
- 36
- "New Incentives will group local government areas (LGAs) it expands to within a given state at a given point in time into ‘expansion groups’. New Incentives will then collect coverage data in these expansion groups once before the start of operations to establish baseline coverage rates." IDinsight, Coverage monitoring analysis plan, 2021, p. 1.
- These expansion groups are called "cohorts."
- 37
See the number of LGAs included in each cohort for which we have received coverage survey results (as of March 2024) here.
- 38
"The Multiple Indicator Cluster Survey (MICS) was carried out in 2021 by the National Bureau of Statistics (NBS) as part of the Global MICS Programme. . . . The Global MICS Programme was developed by UNICEF in the 1990s as an international multi-purpose household survey programme to support countries in collecting internationally comparable data on a wide range of indicators on the situation of children and women." National Bureau of Statistics (NBS) and United Nations Children's Fund (UNICEF), Multiple Indicator Cluster Survey 2021, Statistical Snapshot Report, 2022, p. ii.
- 39
See the MICS data we use in this sheet. Note that we do not use the MICS 2017 data in this sheet. This feeds into our calculations in a different part of our analysis.
- 40
See this section of our analysis for the rules we apply to the data.
- 41
For example in Zamfara, where New Incentives started operations before instituting coverage surveys in 2021. "New Incentives will group local government areas (LGAs) it expands to within a given state at a given point in time into ‘expansion groups’. New Incentives will then collect coverage data in these expansion groups once before the start of operations to establish baseline coverage rates." IDinsight, Coverage monitoring analysis plan, 2021, p. 1.
- 42
Reasoning for each:
- Measles vaccine: We think the coverage surveys may systematically underestimate coverage of the measles vaccine because they only survey children through 12 months, whereas MICS surveys 12-23 month olds. The first dose of the measles vaccine is recommended to be administered at 9 months, though some infants may receive it later. Thus, the MICS data captures infants getting the measles vaccine after 12 months (see the cell notes in this section for more detail). ("The unit of analysis is the individual 6-12-month-old infant." IDinsight, Coverage monitoring analysis plan, 2021, p. 4)
- PCV vaccine: Because the coverage surveys do not include PCV, we use the coverage estimates for the Penta vaccine according to the rules above, and apply an adjustment based on the ratio of PCV coverage to Penta coverage observed in the MICS data (see this section for our calculations). (The coverage surveys include coverage of BCG, Penta, and measles vaccines, as indicated by this research question the assessments are intended to answer: "What is the self-reported coverage of the following routine childhood immunizations among 6-12 month olds at a given point in time in the state-LGA cohort: BCG, any Penta, Measles 1, full vaccination (loose)?" IDinsight, Coverage monitoring analysis plan, 2021, p. 2)
- Rotavirus vaccine: We do not have data from either source on the rotavirus vaccine because it was not introduced in Nigeria’s immunization schedule until August 2022 (see Gavi, "Dealing with diarrhoea: Nigeria introduces rotavirus vaccine into its immunisation plan," August 30, 2022). We assume rotavirus coverage is the same average of Penta and PCV coverage, as both vaccines are administered at the same time (see this section for more detail).
- 43
See this section of our analysis. For example, in Bauchi we estimate that the second dose of PCV contributes 19% to the overall under-five mortality benefit of the program, and the first dose of the measles vaccine contributes 6%.
- 44
Our calculations are in this sheet. Each of the factors we include are discussed below.
- Mortality associated with diseases targeted by each vaccine: We use state-level estimates of mortality from vaccine-preventable diseases from the Institute for Health Metrics and Evaluation's 2021 Global Burden of Disease model to calculate the proportion of vaccine-preventable deaths attributed to the diseases targeted by each vaccine. These are the same as the estimates that we use to model risk of death from vaccine preventable-disease, and we apply the same adjustments (discussed in this section).
- Vaccine efficacy: We then adjust those proportions to account for the estimated efficacy of each vaccine in preventing disease. Adjusting for vaccine efficacy increases the overall contribution of vaccines with high estimated efficacy (such as measles) and decreases the contribution of vaccines with lower estimates of efficacy (such as the rotavirus vaccine). We discuss our vaccine efficacy estimates in this section.
- Efficacy by dose: Our vaccine efficacy estimates are for a full course of that vaccine. To translate dose-specific coverage to overall coverage for vaccines with multiple doses (PCV, Penta, and rotavirus), we came up with rough estimates of the marginal efficacy of each dose (i.e., how much protection is provided by a first dose compared to a second dose, etc.), based on a quick literature review. Our calculations are in this section of our analysis. The literature broadly matched our understanding that the marginal efficacy of the final dose of each vaccine tends to be lower than previous doses.
- 45
See this row of our analysis for the coverage survey data and this row for the MICS data.
Our method
We estimate the level of overreporting by comparing caregiver-reported data on BCG vaccination coverage to data from the coverage surveys on BCG scarring (BCG vaccination typically leaves a scar, providing a more objective measure of vaccination rates). We roughly assume, based on a quick literature review, that 90% of children who are vaccinated against BCG develop a scar that will be detected and correctly identified when checked for (details discussed below).
- The proportion of children with BCG scars in coverage surveys to date has been 56%, compared to 62% of children reported to be vaccinated by caregivers.
- These values imply that the true rate of BCG vaccination was ~1% higher than caregivers reported (56% / 90%) / 56% - 100% = ~1%). See calculations here.
- We make this same adjustment to coverage of all vaccines (not just BCG), assuming that the level of bias was probably around the same regardless of the specific vaccine.
- We use a smaller (~0%) adjustment for the MICS data because we estimate that only 22% of the MICS data comes from self-reported questions (the rest comes from reviewing children’s vaccination cards). See this section of our analysis.
Data on BCG scarring rates
We found three studies reporting scarring rates of 82-96%. These average to 87% (unweighted) which is roughly in line with the 90% cited by WHO as the BCG scar rate in its 2018 position paper. We therefore use 90% as our rough best guess for the BCG scar rate. Because the estimates from the literature rely on an individual detecting and correctly identifying BCG scars (rather than being a theoretical percentage of all infants who receive BCG who scar, we no longer make additional adjustments for the percentage of scars which are detected or the percentage of detected scars which are in fact BCG scars. We had included such adjustments in earlier versions of our CEA. See here.
- "BCG vaccination usually causes a scar at the site of injection due to local inflammatory processes. However scar formation is not a marker for protection and approximately 10% of vaccine recipients do not develop a scar." World Health Oragnization, BCG vaccines: WHO position paper – February 2018, p. 84.
- "Two hundred and six subjects (96.3%) had a postvaccination BCG scar." Atimati and Osarogiagbon 2014.
- "The prevalence of BCG scar was 79.5% among the male infants and 84.7% among the female infants, while the overall prevalence of BCG scar was 81.5%." Gambo et al. 2014.
- "Although 84.2% had physical evidence of BCG inoculation only 69.8% had developed detectable sensitization to the tubercle bacilli as shown by the Mantoux test." Odujinrin and Ogunmekan 1992.
- 46
See our analysis of self-report bias in the RCT here.
- 47
We looked at vaccination coverage estimates from the DHS 2013, MICS 2016-17, DHS 2018, and MICS 2021 surveys when making this estimate.
- 48
For example, our most recent investigation considered the reallocation of New Incentives' surplus funding to support program additions from 2024-2026. We therefore used 2025 as the middle year of the grant period.
- 49
See these calculations in the "Baseline vaccination coverage for the target population, aggregated across vaccines" section on the 'Aggregation across vaccines' sheet of our cost-effectiveness analysis.
- 50
See this row of our cost-effectiveness analysis.
- 51
We divide the impact of the program by the share of unvaccinated children at baseline to estimate the reduction in unvaccinated children caused by the program: 22pp / (100% - 36%) = ~33%. More information in this section.
- 52
"This study is an impact evaluation of the NI-ABAE CCTs for RI Program in Katsina, Zamfara, and Jigawa
States in North West Nigeria funded by Open Philanthropy at the recommendation of GiveWell."
"The evaluation consisted of a two-arm clustered randomized controlled trial." IDinsight, Impact evaluation of New Incentives, final report, 2020, p.7. - 53
The report is available here: IDinsight, Impact evaluation of New Incentives, final report, 2020.
- 54
“The evaluation consisted of a two-arm clustered randomized controlled trial. We worked with NIABAE to identify clinic catchments in the three evaluation states that met its operational criteria. We then randomly selected our sample of 167 clinics from among these clinics.” IDinsight, Impact evaluation of New Incentives, final report, 2020, pg. 7.
- 55
"We measured most outcomes using caregiver reports from a household survey, during which enumerators also checked for BCG vaccine scars and recorded data from vaccination records kept in the home." IDinsight, Impact evaluation of New Incentives, final report, 2020, pg. 7.
- 56
Adapted from IDinsight, Impact evaluation of New Incentives, final report, 2020, Table 3, pg. 23.
- 57
This is referred to as “Penta 1” throughout the IDInsight final RCT report. However, our understanding based on viewing the survey questions (not published) is that "Penta 1" refers to receiving any dose of the Penta vaccine.
- 58
In addition to the primary outcomes, this includes all three doses of PCV, and the three doses of Penta individually.
- 59
See this section of our analysis for the impact on each vaccine dose.
- 60
“Fully vaccinated” here refers to children receiving BCG, all 3 doses of the Penta vaccine, and the measles vaccine. “When using the strict definition of full immunization (BCG vaccine, Penta vaccine 1-3, Measles 1 vaccine), the likelihood of being fully immunized was 27 percentage points (95% CI: 23, 31, p-value 0.001) higher among children in the treatment areas.” IDinsight, Impact evaluation of New Incentives, final report, 2020, pg. 28.
- 61
Note that this aggregation method implies that the program increased take-up of each vaccine by a different amount. This is different to our previous method for estimating the program’s effect size, which viewed the effects on the three main primary study outcomes as noisy estimates of the same underlying effect (more in a previous version of our research report here, footnote 7). We think it is plausible that New Incentives’ program would have different effects depending on where a vaccine falls in the schedule (e.g., less effect on early vaccines and more effect on later vaccines), although we’re unsure about this.
- 62
We use the term “coverage” to refer to the proportion of children vaccinated.
- 63
See this row in our supplementary analysis.
- 64
See this section in our analysis.
- 65
See this section in our analysis.
- 66
"Across the study area, coverage in the control group was substantially higher at endline than at baseline. This was true for each of the primary study vaccines, with the largest difference for the Measles vaccine: 17.8% of children at baseline versus 57.2% of children at endline had reportedly received Measles 1 vaccine (Table 16). We did not expect a change of this magnitude." See also Table 16, IDinsight, Impact evaluation of New Incentives, final report, 2020, pg. 50.
Note that the baseline survey was conducted in Zamfara and Katsina states only, and so these estimates aren’t directly comparable to the overall coverage estimate (including Jigawa state) that we discuss above. - 67
"Changes in the questionnaire or enumerator technique could have led to increased recording of vaccinations via the survey even if true vaccination coverage had not changed. This could result from either improved recall or increased social desirability, or both. This hypothesis could explain why we do not see similar increases in clinic tally sheets, which record relatively stable control-group vaccination volumes between baseline and endline (see Appendix I)." IDinsight, Impact evaluation of New Incentives, final report, 2020, pg. 51.
- 68
“I don’t understand the reason for the huge increases in vaccination rates in the control areas in the RCT. I agree with your conclusion that those effects are unlikely to change the determination that NI’s program significantly increased vaccinations but I have two reservations. First, it seems important to determine what it was that increased vaccination rates in the control areas that much because that change was bigger than the treatment effect from NI. My hunch is that it was survey effects or spillovers that weren’t totally captured. I have seen these big changes in control group outcomes before in some of my own studies.”
“The RCT report shows a very big increase in clinic outreach days in the control areas (from 2 to 3.5 month, a 75% increase). Is that accounted for in your model?” Dr. Jessica Cohen, Bruce A. Beal, Robert L. Beal and Alexander S. Beal Associate Professor of Global Health, Comments on GiveWell’s draft New Incentives Report, November 2023, unpublished. Note that Dr. Cohen’s response was shared before we compared the control group results to independent vaccine coverage surveys.
- 69
See this spreadsheet for our calculations.
Our approach
- We compared RCT data on control group vaccine coverage increases from baseline to endline (in Katsina and Zamfara states only, since the baseline survey was only conducted in these states) with 3 independent vaccine coverage surveys conducted before and after the RCT: (1) MICS 2017 (here), (2) DHS 2018 (here), and (3) MICS 2021 (here). We compared data for BCG and measles 1 because they are the first and last vaccines covered in the RCT (in terms of time of vaccination).
- The New Incentives baseline survey took place in 2017, and the endline took place in 2020 (in between these surveys). We extrapolated results from the three surveys using a linear trend to estimate what we’d expect vaccine coverage to have been in the New Incentives RCT at baseline and endline in both states. In both states and for both vaccines there was a trend of increasing BCG and measles vaccine coverage between 2016-2017 and 2021.
- We compared the implied increase in vaccine coverage with the observed increase in the New Incentives RCT. Overall, the implied increase was 13 percentage points for the BCG vaccine and 12 percentage points for the measles 1 vaccine based on extrapolating from independent surveys, compared to 28 percentage points (BCG) and 38 percentage points (measles) in the New Incentives RCT. This implies 48% of the control group increase (BCG) and 30% (measles) is explained by the regional trend, or roughly 40% overall.
- There are two reasons why we think these could be underestimates:
- Different age ranges: The RCT used a different age range (12-16 months) than DHS/MICS vaccine coverage (12-23 months). We’d expect that this means the RCT would show larger increases than DHS/MICS given the same underlying changes. For example, for BCG received at birth, if coverage at birth increases over a short period of time, the BCG coverage measured among children aged 12-16 months will increase more rapidly than coverage measured amongst children aged 12-23 months because the children receiving the increase make up a larger share of the measured population.
- New Incentives clinics may not be representative: The RCT was conducted in a set of clinics that met NI’s operational criteria, which meant excluding clinics that had high security risk and that were barely functional, amongst other reasons. We think it’s plausible that coverage would have increased faster in these clinics than average, regardless of New Incentives’ program.
Uncertainties
- The DHS/MICS state level results are fairly noisy and there are substantial survey-to-survey fluctuations. For example, in Zamfara in the DHS/MICS, BCG coverage was 19% in 2016, 16% in 2018, and 51% in 2021. This means we’re uncertain whether it’s valid to assume a linear trend.
- Our analysis is based on only two states and two vaccines. Given the noisy estimates mentioned in the previous bullet, this means this comparison is fairly uncertain.
- 70
Note: For our estimate of the main effect size of the program (21 percentage points), we use IDinsight’s estimates of the impact on all vaccine doses, not just the pre-specified outcomes (BCG, measles, and any dose of Penta vaccine). We do not see this as a significant threat to the validity of our analysis because (i) there were also significant increases in the pre-specified outcomes, (ii) we also incorporate information in the pre-specified outcomes, and (ii) we think it’s plausible that the impact of the program might vary according to when a vaccine is delivered in the vaccine schedule.
- 71
From the independent review by the International Initiative for Impact Evaluation (3ie): "Overall, I found that IDinsight was receptive to suggestions, made major adjustments between baseline and endline that substantially improved the design, was diligent in documenting the Stata code, and their work and assessment are a valid assessment of the New Incentives Conditional Cash Transfer program. While there are remaining questions about the change in coverage (greatly improved) in control areas, and the poor accuracy of the biomarkers and its implications for the efficacy of the measles vaccine in Nigeria, we do not believe that these questions change the interpretation and conclusions of the study. The New Incentives program substantially and significantly increased immunizations rates." International Initiative for Impact Evaluation, Quality assurance of IDinsight's evaluation of New Incentives, 2020, pg. 3.
- 72
“Vaccination volumes recorded at clinics have experienced statistically significantly larger increases since baseline in treatment clinics than in control clinics. Using clinic tally sheets (which count vaccination doses given at each clinic by vaccine and by month), we found that the average increase in monthly BCG vaccine doses administered between baseline and endline was 17.6 (95% CI: 9.1, 26.2, p-value < 0.001) doses greater in treatment clinics than control clinics.” IDinsight, Impact evaluation of New Incentives, final report, 2020, pg. 31-32.
- 73
IDinsight, Impact evaluation of New Incentives, final report, 2020, Figures 16-18, pg. 65-66.
- 74
“Programmatically, New Incentives’ theory of change continues to look promising. First, the sources of vaccinations measured align with the program. Outside of the national measles campaigns, almost all infants receive vaccinations from the sources New Incentives’ program will cover: health facilities and health facility outreach. Second, most caregivers cited lack of knowledge or ambivalence and relatively few caregivers cited socio-cultural reasons or mistrust and fear, as reasons for not vaccinating. It seems likely that an incentive, coupled with awareness raising activities, can overcome these stated reasons for not vaccinating. Finally, New Incentives’ program appears to be unique. While small incentives are relatively common, incentives worth more than 500 Naira are rare and only two caregivers received cash in our sample.” IDinsight, New Incentives evaluation baseline report, 2019, p. 71.
- 75
We use an internal validity adjustment of -12%. Applying this to the impact of New Incentives’ program on full vaccination coverage of 27 percentage points (the measure we use here for comparison since it’s available across almost all of the other studies we looked at) implies an updated impact of 24 percentage points. See this row of our supplementary analysis for this calculation. This estimate would still be higher than any of the other studies we included in our analysis. Applying our internal validity adjustment to the estimate of program impact we actually use in our main analysis (21 percentage points, discussed above) implies an impact of ~18% (21pp x (100% - 12%)). This is higher than all but one of the other studies we looked at (Banerjee et. al. 2010).
- 76
This is based on the estimates that we calculate above from the RCT: that it increased vaccine coverage by 21 percentage points from a baseline of 36%. 21pp / (100% - 36%) = ~33%. See this row in our analysis.
- 77
See this section in our cost-effectiveness analysis.
- 78
We reviewed nine studies in a 2021 World Bank meta-analysis of conditional cash transfers for immunization. We also conducted a literature search for additional studies. We found two studies published since the World Bank analysis and one study (Bannerjee et. al. 2010) that tested the impact of non-cash incentives (raw lentils and plates) that was not included in the World Bank analysis. Although this is not strictly speaking a conditional cash transfer for immunization, we included this study because the monetary value of these was similar to the cash transfer of the New Incentives program. The final study was the New Incentives RCT. See this spreadsheet for a summary of all 13 studies. This column summarizes which studies were randomized controlled trials.
- 79
The exception to this is Morris et al. 2004, which reports outcomes on DTP3 instead. Since DTP3 comes last in the vaccination schedule, we think this is a reasonable proxy for full vaccination. See this row in our accompanying spreadsheet.
- 80
See this column in our analysis spreadsheet.
- 81
See the graphs in our accompanying spreadsheet. There seems to be a negative relationship between baseline coverage and effect size, such that effect size reduces as baseline coverage increases. We think this makes intuitive sense, as higher baseline coverage implies a smaller pool of caregivers that can be influenced by incentives.
- 82
We use the following calculation:
- (RCT effect size x RCT weight) + (skeptical prior x skeptical prior weight) = (27pp x 70%) + (16pp x 30%) = 24pp.
- This implies a downward adjustment of ~12% ((24 / 77) - 100%). See this section of our accompanying spreadsheet.
- 83
See this chart in our accompanying spreadsheet.
- 84We estimate that New Incentives' program leads to a 25% reduction in the proportion of the population that has not received the first dose of the measles vaccine. Using our assumption that the program would be 15% less effective at increasing uptake of the second dose, that implies a 21% reduction in the proportion of the population that has not received the second dose of the measles vaccine. You can see our detailed calculations here.
- 85See New Incentives' program monitoring indicators through 2023 here. In 2023, New Incentives reported a measles 1 retention rate of 87% and a measles 2 retention rate of 75%. 75%/87% = 86%
- 86See our calculations here.
- 87
See this section of our cost-effectiveness analysis.
- 88
See this sheet for our calculations. These calculations include deaths averted across all age groups, and they account for variation between vaccines in disease burden, vaccine efficacy, baseline coverage, and treatment effect of the program. They also account for GiveWell’s moral weights.
- 89
See this row of our cost-effectiveness analysis.
- 90
See this row of our cost-effectiveness analysis.
- 91
We refer to the diseases targeted by routine childhood vaccinations that are included in our analysis as “vaccine-preventable disease.” This does not include diseases targeted by other vaccines not included in our model.
- 92
See this row of our cost-effectiveness analysis.
- 93
These estimates (available here) are from the 2021 Global Burden of Disease model.
- 94
See this sheet for our calculations.
- 95
See this row in our cost-effectiveness analysis. Because the GBD age bands (0 to 6 days, 7 to 27 days, under 1 year, and 1 to 4 years) don’t align exactly with the scheduled vaccination dates, this adjustment relies on some rough guesses.
For example, in Bauchi State, the GBD model estimates that 9% of under-five meningitis deaths occur in the first 27 days of life (see this row). We roughly guess that the proportion of under-five meningitis deaths occurring in the first six weeks (before the first doses of PCV and HiB are scheduled) is 10% higher than this, or 10% in total (9% x 110% = 10%).
- 96
See this row in our analysis.
- 97
GiveWell conducted a literature review in 2020 to learn more about what proportion of pneumonia deaths are caused by different pathogens. As part of this review, we spoke to Dr. Maria Knoll, a researcher at the Bloomberg School of Public Health, Johns Hopkins University. Dr. Knoll told us:
- The best available estimates of the contribution of SP and Hib to mortality are available at View-Hub, a data visualization platform for vaccine-treatable diseases (created at Johns Hopkins and supported by Gavi and BMGF).
- The WHO and member states use View-Hub data rather than IHME data to quantify their SP and Hib burdens.
- She expressed skepticism about the IHME data, in part because it allegedly does not reflect recent vaccination trends, in contrast to View-Hub data.
- The model used to generate the SP and Hib data in View-Hub was created specifically for SP and Hib, whereas IHME methods are more general and therefore potentially less accurate for specific conditions.
The GiveWell literature review concludes: “I recommend using View-Hub estimates. I found Dr. Knoll’s arguments persuasive and they conform to my priors about IHME, although I would feel more confident if I had independent confirmation that the WHO and member states use View-Hub data and that they are typically viewed as superior by other researchers.” (Pg. 3 here).
We also decided to use View-Hub rather than other studies of pneumonia disease etiology (PERCH and GABRIEL), in part because these studies provide estimates of the etiology of severe pneumonia hospitalization (not mortality).
- 98In Mahtab et al. 2024, post-mortem minimally invasive tissue sampling (MITS) was conducted on deaths which occurred in children aged 1-59 in 7 countries (Ethiopia, Kenya, Mali, Mozambique, Sierra Leone, South Africa, Bangladesh) from Dec 16, 2016, to Dec 31, 2022. Data was collected through the Child Health and Mortality Prevention Surveillance (CHAMPS) Network programme.
- “In this observational study we analysed deaths occurring between Dec 16, 2016, and Dec 31, 2022, in the CHAMPS Network across six countries in sub-Saharan Africa (Ethiopia, Kenya, Mali, Mozambique, Sierra Leone, and South Africa) and one in South Asia (Bangladesh). A standardised approach of MITS was undertaken on decedents within 24–72 h of death. Diagnostic tests included blood culture, multi-organism targeted nucleic acid amplifications tests (NAATs) of blood and lung tissue, and histopathology examination of various organ tissue samples.”
Out of 1,120 deaths, the study finds that pneumonia was in the causal pathway of death for 455; and of those deaths, S. pneumoniae was in the causal pathway of death for 123 children, or 27% of the pneumonia deaths.
- See Table 2. For the total number of deaths in which S. pneumoniae was in the causal pathway of death, sum the number of S. pneumoniae attributable deaths that were classified as community deaths or deaths occurring within 72 hours of hospitalization (108) and those which occurred at least 72 hours after hospitalization. (15)
- 99Our high-level understanding is that minimally invasive autopsies like those conducted by the CHAMPS Network generally provide accurate cause-of-death assessments in low- and middle-income settings when compared against invasive complete diagnostic autopsies, which are considered the “gold standard” for assessing deaths. From Molinengo et al. 2024, a review of minimally invasive autopsy use for infectious diseases:
- “This Review examines the use of needle biopsy post-mortems in infectious diseases. The primary objective was to evaluate whether needle biopsy post-mortem can serve as a valid alternative to a complete diagnostic autopsy in the context of emerging and endemic infectious diseases.”
- “The invasive complete diagnostic autopsy, which involves evisceration of a cadaver and whole-organ dissection, is still considered the gold standard for death investigation.”
- “The Cause of Death through Minimally Invasive Autopsy (CaDMIA) and CaDMIA-plus projects were developed to expand access to post-mortems in low-income and middle-income countries.85 These projects later evolved into the Minimally Invasive Tissue Sampling (MITS) Alliance, and some projects were included as part of the Child Health and Mortality Prevention Surveillance (CHAMPS) project. These projects aim to test the validity of needle biopsy post-mortems as a routine technique in general populations in seven different countries in sub-Saharan Africa and southeast Asia where traditional complete diagnostic autopsies might not be accepted for cultural reasons or not be feasible due to scarcity and in some cases an absence of resources, leaving a verbal autopsy or no autopsy at all as the only alternatives. A standard protocol for needle biopsy post-mortem has been developed as part of the CHAMPS project”
- “Nine of the studies that evaluated concordance between needle biopsy post-mortem and complete diagnostic autopsy specifically investigated deaths caused directly by infectious disease, some of which include sub-analyses of CaDMIA project and MITS Alliance studies. When these nine studies were combined with those that reported the accuracy of identifying the infectious agent with needle biopsies (via culture or molecular tests), the weighted mean diagnostic accuracy to establish the diagnosis or identify the pathogen in needle biopsy post-mortems was approximately 87%.”
- 100We place 100% weight on the results of Mahtab et al. 2024 to calculate an etiology adjustment for pneumococcal lower respiratory tract deaths because:
- The estimates are based on pneumonia deaths rather than hospitalizations or other severe cases of pneumonia, and we think it is likely that these results are more representative of the etiology of pneumonia mortality than other studies such as PERCH and GABRIEL, which look at severe pneumonia etiology.
- In brief, we think it is likely that the pathogens responsible for severe pneumonia and pneumonia deaths meaningfully differ. For more on why we place more weight on estimates of the etiology of pneumonia mortality than severe pneumonia, see this write-up at pages 3-4.
- Mahtab et al. 2024 did not include data from Nigeria, but we assume estimates of disease etiology from the included countries (Ethiopia, Kenya, Mali, Mozambique, Sierra Leone, and South Africa) are likely to be a reasonable approximation to Nigeria.
- While View-Hub provides estimates of pneumococcal pneumonia mortality specific to Nigeria, these were modeled estimates; and we think the figures are likely less accurate than etiology estimates based on actual deaths.
- The View-Hub estimates are based on Wahl et al. 2018, which provides country-level modeled estimates of Streptococcus pneumoniae and Haemophilus influenzae type b deaths. Among other limitations, the authors used conservative assumptions where there was no strong evidence, which likely contributed to an underestimate of disease burden; and the all-cause pneumonia and meningitis mortality estimates underlying the model were largely based on verbal autopsies, which have a high potential for misclassification.
- “Where evidence was unavailable or contradictory, we selected the most conservative approach that would be likely to underestimate disease. Our rationale was to minimise the likelihood that policy decisions would use overestimated burden estimates.” Wahl et al. 2018, p. E745
- “Pathogen-specific pneumonia and meningitis deaths are constrained by the all-cause pneumonia and meningitis death estimates produced by the WHO/MCEE collaboration.16 Given that few deaths occur in countries with adequate vital registration systems, these estimates are based largely on verbal autopsy data. The potential for misclassification and other challenges associated with verbal autopsy studies, particularly for non-specific syndromes such as pneumonia, have been described extensively.” Wahl et al. 2018, p. E755
- The View-Hub estimates are based on Wahl et al. 2018, which provides country-level modeled estimates of Streptococcus pneumoniae and Haemophilus influenzae type b deaths. Among other limitations, the authors used conservative assumptions where there was no strong evidence, which likely contributed to an underestimate of disease burden; and the all-cause pneumonia and meningitis mortality estimates underlying the model were largely based on verbal autopsies, which have a high potential for misclassification.
- In addition, the latest View-Hub estimates were for 2015. PCV was being introduced into the Nigerian routine immunization schedule from 2014 through 2016. We think it’s likely that the share of pneumonia deaths due to S. pneumoniae meaningfully declined since PCV scaled up, in part, because we’ve seen evidence that mass childhood PCV vaccination may lead to large population-level decreases in pneumococcal disease caused by serotypes included in the vaccine.
- See the WHO for the timeline of PCV introduction in Nigeria, and here for PCV3 vaccination rates in Nigeria since 2015 based on WHO-UNICEF estimates.
- Shiri et al. 2017, a systematic review and meta-analysis of studies which reported changes in invasive pneumococcal disease following vaccine introductions, finds that PCV introduction in middle- and high-income countries lead to large population-level decreases in invasive pneumococcal disease due to vaccine serotypes.
- “In this systematic review and meta-analysis, we searched bibliographic databases for non-randomised quasi-experimental or observational studies reporting invasive pneumococcal disease changes following PCV introduction in unvaccinated populations (studies published Sept 1, 2010, to Jan 6, 2016), updating the previous systematic review of the same topic (studies published Jan 1, 1994, to Sept 30, 2010).”
- “Data were extracted from 70 studies included in the previous review and 172 additional studies, covering 27 high-income and seven middle-income countries.”
- “Invasive pneumococcal disease due to serotypes included in PCV7 in all unvaccinated age groups significantly reduced, with little variation by individual serotype (table 1, figure 2, appendix). The overall RR of change per year in invasive pneumococcal disease caused by PCV7 serotypes was 0·79 (95% credible interval [CrI] 0·75–0·81) in all age groups combined, translating to mean periods of 2·3 years (95% CrI 1·9–2·7) to attain 50% reduction in invasive pneumococcal disease caused by PCV7 serotypes in all unvaccinated age groups and 8·9 years (7·8–10·3) to attain a 90% reduction.”
- The estimates are based on pneumonia deaths rather than hospitalizations or other severe cases of pneumonia, and we think it is likely that these results are more representative of the etiology of pneumonia mortality than other studies such as PERCH and GABRIEL, which look at severe pneumonia etiology.
- 101Our approach:
- Mahtab et al. 2024 reports data from 6 countries in sub-Saharan Africa: Ethiopia, Kenya, Mali, Mozambique, Sierra Leone, and South Africa. In total, there were 453 deaths where pneumonia was in the causal pathway of deaths. Across countries, S. pneumoniae was found to be in the causal pathway of death for 15-50% of the pneumonia deaths. See our calculations here
- We assume that the share of deaths attributable to S. pneumoniae would correlate strongly with PCV coverage rates. To calculate an etiology adjustment, we assigned the largest weights (25% each) to results from the 3 countries in Mahtab et al. 2024 (Ethiopia, Mali, Mozambique) which had the most similar PCV3 coverage rates to Nigeria (59%) during this period. We assigned a smaller weight (roughly 8% each) to results from the remaining 3 countries (Kenya, Sierra Leone, and South Africa).
- We calculated the average PCV3 coverage rate in each of these countries and Nigeria over the study period (roughly 2017 through 2022) using WHO/UNICEF estimates of vaccination coverage. See here
- For our full calculations, see here
- 102 Our main reservations about relying on the results of Mahtab et al. 2024 for our etiology adjustments include:
- Small sample sizes may mean we are placing too much weight on statistical noise or unrepresentative deaths.
- The total sample size for pneumonia deaths in Mahtab et al. 2024 was small, 453 deaths total.
- The sample sizes for each country were even smaller (ranging from 20 to 151 total pneumonia deaths), and we place the most weight on countries with the smallest total number of pneumonia deaths (Ethiopia and Mali). This could mean we are overweighting noise or unrepresentative deaths
- Populations represented in Mahtab et al. 2024 may not be representative of all deaths, particularly in Nigeria.
- The CHAMPS data likely overrepresented deaths that occur in hospitals, i.e., may overrepresent caregivers with higher access to healthcare. “Limitations of the CHAMPS programme include the fact that prompt identification of deaths for timely sample collection can lead to an over-representation of presumed hospital-acquired pneumonia, potentially skewing the proportional distribution of deaths from presumed community-acquired pneumonia and presumed hospital-acquired pneumonia. Furthermore, the ease of identifying deaths in a health facility compared with in the community could introduce selection bias, favouring the inclusion of children from families with access to health care.” Mahtab et al. 2024
- The CHAMPS data do not include data from Nigeria. We’ve weighted country-specific results based on similarity of PCV vaccination rates, but these weights are rough; and it’s plausible that causes of death may differ meaningfully across countries for other reasons.
- Small sample sizes may mean we are placing too much weight on statistical noise or unrepresentative deaths.
- 103
See this write-up for further discussion of how we ought to weight the findings of the PERCH study in our estimates of the proportion of pneumonia deaths that are caused by S. pneumoniae and HiB.
- 104
We exclude rotavirus from this adjustment because rotavirus was only introduced in Nigeria’s childhood vaccination schedule in 2022 (see Gavi, "Dealing with diarrhoea: Nigeria introduces rotavirus vaccine into its immunisation plan," August 30, 2022), and so we would not expect it to have any impact on the GBD mortality estimates. See this row in our supplementary analysis.
- 105
This calculation uses the following formula:
- Mortality among unvaccinated children = Mortality overall / (% of unvaccinated children) + (% vaccinated x % relative risk as a result of vaccination).
As an example, in Bauchi, we estimate that the vaccine-preventable mortality rate among children who have not been vaccinated is 2.8% / ((100% -28%) + (28% x (100% - 52%)) = ~3.2% (see this row).
This calculation relies on estimates of vaccine coverage for each state in our analysis. For this, we use vaccine coverage data from the Multiple Indicator Cluster Survey (MICS), a household survey which provides data on vaccine coverage at the state level. This is the same survey that we use in our estimates of New Incentives’ impact on vaccination rates (discussed above). Our estimates are calculated as follows in this section:
- Since the under-5 mortality data we use comes from GBD 2021, we want our estimate of vaccination coverage for that cohort of children to represent the average vaccination rate across the 5 years preceding the GBD 2021 estimates. We assume that the under 5 population represented by GBD 2021 consists of children born between 2017 and 2021, and we estimate vaccination coverage was increasing by roughly 5% each year over that period (see our calculations here). To roughly approximate average vaccination coverage across that cohort, we estimate vaccination coverage for the midpoint of the cohort (2019). Data collection for MICS 2021 ran from September to December 2021 (See "Fieldwork" dates on p.iii of the MICS 2021 Report). Vaccination coverage was measured for children aged 12-23 months, so we assume the children for whom vaccination coverage was measured were born mostly in 2020. To estimate vaccination coverage for children born in 2019, we back out the 2021 MICS estimates by 5% (since we expect vaccination coverage was increasing by roughly 5% each year from 2017 to 2021). See our calculation here.
- We adjust the MICS 2021 coverage estimates by -1% for self-report bias, using the same method discussed above.
- MICS provides data on how many children have received each dose of a given vaccine, whereas our vaccine efficacy estimates are for a full course of that vaccine. To translate dose-specific coverage to overall coverage for vaccines with multiple doses (PCV, Penta, and rotavirus vaccines), we came up with rough estimates of the marginal efficacy of each dose (i.e., how much protection is provided by a first dose compared to a second dose, etc.), based on a quick literature review. Our calculations are in this section.
As an example, this produces the following estimates for vaccine coverage in Bauchi State:
- PCV: 37%
- DTP 37%
- HiB: 37%
- Measles: 29%
- BCG vaccine: 47%
- Rotavirus: 0%
A weighted average of these vaccines, using each vaccine’s contribution to the primary benefit of New Incentives’ program (reducing under-five mortality), is 30% in Bauchi. See this row in our cost-effectiveness analysis.
- 106
See this row in our cost-effectiveness analysis.
- 107
Our estimate of 0.75 for malaria is a rough best guess, based primarily on evidence that malaria control interventions often have bigger impacts on mortality than their impacts on malaria-related mortality alone would imply. See this section of our report on seasonal malaria chemoprevention for more details.
- We would guess that non-specific effects would be similar for vaccines because the age profile of the beneficiaries is the same (children under 5) and the mechanism seems similar (i.e., beneficial health effects reduce the likelihood of death from other causes).
- We'd guess these effects might be somewhat lower for vaccines, since all of these vaccines together are preventing a slightly larger share of overall deaths than SMC (and so there are fewer deaths "available" to prevent indirectly). However, vaccines also prevent a wider range of diseases. As a result, an adjustment of 0.75 indirect deaths seemed appropriate for both programs.
- 108
See our original cost-effectiveness analysis for New Incentives here.
- 109
Higgins et al. 2016 finds:
- The BCG vaccine decreases all-cause mortality by 30% in clinical trials: "BCG vaccine was associated with a reduction in all cause mortality: the average relative risks were 0.70 (95% confidence interval 0.49 to 1.01) from five clinical trials." pg. 1.
- The measles vaccine decreases all-cause mortality 26% in clinical trials: "Receipt of standard titre MCV was associated with a reduction in all cause mortality (relative risks 0.74, [CI] 0.51 to 1.07) from four clinical trials." pg. 1.
- The DTP vaccine increases all-cause mortality by 38%, though this is from observational studies that the authors rate as having a high risk of bias: "Receipt of DTP (almost always with oral polio vaccine) was associated with a possible increase in all cause mortality on average (relative risk 1.38, [CI] 0.92 to 2.08) from 10 studies at high risk of bias." pg. 1.
- 110
Lucero et al. 2009 finds that PCV decreases all-cause mortality by 11%: "Pooled vaccine efficacy (VE) for VT‐IPD was 80% (95% confidence interval (CI) 58% to 90%, P < 0.0001); all serotypes‐IPD, 58% (95% CI 29% to 75%, P = 0.001); World Health Organization X‐ray defined pneumonia was 27% (95% CI 15% to 36%, P < 0.0001); clinical pneumonia, 6% (95% CI 2% to 9%, P = 0.0006); and all‐cause mortality, 11% (95% CI ‐1% to 21%, P = 0.08). Analysis involving HIV‐1 positive children had similar findings." pg. 2.
- 111
0.74 (for measles) x 0.70 (for BCG) x 0.89 (for PCV) = 0.46.
- 112
This rough calculation is based on our earlier cost-effectiveness analysis implying a 12% reduction in all-cause mortality, and our rough estimate based on Higgins and Lucero that these vaccines might lead to a 60% reduction in all-cause mortality. (60% - 12%) / 12% = ~4.
- 113
Further reservations include:
- Wide confidence intervals. The 95% confidence intervals in Higgins et al. 2016 and Lucero et al. 2009 include a risk reduction on all-cause mortality of 0%.
- Characteristics of infants in trials may not be representative. Two of the BCG trials were limited to a sub-sample of low-birthweight infants, for whom we would guess this effect is larger than for the average infant in northern Nigeria today.
- There is high uncertainty about the mechanisms for non-specific effects. Our impression is that the mechanisms driving non-specific effects are poorly understood, which leads us to discount them slightly.
- There is evidence of a negative effect of DTP on mortality. The negative effect of DTP on mortality suggests that we ought to downweight non-specific effects, though this is based on observational studies with high risk of bias.
Sources:
- Low birthweight infants: “We considered four results from cohort studies to be at very high risk of bias and excluded them from meta-analyses. The clinical trial results, including two at low risk of bias in low birthweight infants and two in Native American children in the 1930s and 40s, suggested a beneficial effect of BCG on mortality (average relative risk 0.70, 95% confidence interval 0.49 to 1.01).” Higgins et al. 2016, pg. 4.
- Evidence of a negative effect of DTP on mortality: “Receipt of DTP (almost always with oral polio vaccine) was associated with a possible increase in all cause mortality on average (relative risk 1.38, 0.92 to 2.08) from 10 studies at high risk of bias; this effect seemed stronger in girls than in boys.” Higgins et al. 2016, abstract.
- 114
These are the specific diseases targeted by the vaccines that Higgins et al. 2016 and Lucero et al. 2009 find lead to large impacts on all-cause mortality (PCV, the measles vaccine, and the BCG vaccine).
- 115
We estimated in an earlier version of our analysis that the vaccines incentivized by New Incentives’ program would reduce all-cause mortality by approximately 12%, if they only reduced mortality through the diseases they directly avert (see here). 12% x (1 + 0.75) = ~21%.
- 116
For example, we estimate the probability of death before age 5 from vaccine-preventable diseases ranges from ~1.3% in Kaduna to ~3.9% in Zamfara. The range for other states in Nigeria is considerably wider. See this row in our cost-effectiveness analysis.
- 117
For estimates from IGME, see this page.
- 118
See this row of our cost-effectiveness analysis.
- 119
Note: We exclude hepatitis B and yellow fever (indirectly incentivized) because IHME estimates show a very low probability of death from these diseases in Nigeria and so we do not think they would make a significant difference to our analysis. See IHME data here.
We exclude the oral polio vaccine because we expect that there is a very low probability of death from polio in Nigeria today.- The last reported case of wild polio virus in Nigeria was in 2016. Global Polio Eradication Initiative, "Polio-free countries".
- Cases of vaccine-derived polio have been reported in recent years in Nigeria, but we expect that these case numbers are small enough that the average probability of child mortality from polio remains very low.
- "No cVDPV2 case was reported this week. There have been 16 cVDPV2 cases reported this year and 48 cases in 2022." Global Polio Eradication Initiative, "Where we work: Nigeria", accessed July 26, 2023.
Instead of explicitly modeling them, we account for the benefits of these vaccines with a rough +5% adjustment elsewhere in our analysis (discussed here).
- 120
These efficacy numbers correspond to 1 minus the relative risk.
- 121
IDinsight, New Incentives evaluation, pre-analysis plan, 2019, pg. 2.
- 122We rely on two high-quality, large-scale RCTs that were conducted in sub-Saharan Africa for our efficacy estimates. The two studies estimate a 45% and 50% reduction in invasive pneumococcal disease from all serotypes as a result of PCV vaccination using an intention-to-treat analysis. We take the simple average of the results to arrive at 47.5%.
- Cutts et al. 2005 was an RCT conducted in eastern Gambia. 8,718 infants were randomly allocated to receive 3 doses of a 9-valent PCV while 8,719 received a placebo. The study finds a 45% reduction in invasive disease caused by all serotypes as a result of vaccination. We did not identify any obvious quality concerns (the study was double-blind, there were no apparent losses to follow-up or baseline imbalances, and the results between the per-protocol and intention-to-treat analysis were similar).
- “We undertook a randomised, placebo-controlled, double-blind trial in eastern Gambia. Children age 6–51 weeks were randomly allocated three doses of either pneumococcal conjugate vaccine (n=8718) or placebo (8719), with intervals of at least 25 days between doses.” (Abstract)
- “Efficacy against invasive pneumococcal disease attributable to serotypes present in the vaccine was 77% (95% CI 51–90) in the per-protocol analysis and 71% (46–86) by intention to treat, and efficacy against all serotypes of invasive pneumococcal disease was 50% (21–69) and 45% (19–62), respectively.” (pp. 1142-1143)
- Klugman et al. 2003 was an RCT conducted in South Africa. 19,922 children received a 9-valent PCV while 19,914 received a placebo. Among all children, the study finds a 50% reduction in invasive disease caused by all serotypes as a result of vaccination. We did not identify any obvious quality concerns (the study was double-blind, there were no apparent losses to follow-up or baseline imbalances, and the results between the per-protocol and intention-to-treat analysis were similar)
- “We evaluated the efficacy of a 9-valent pneumococcal conjugate vaccine in a randomized, double-blind study in Soweto, South Africa. [...] At 6, 10, and 14 weeks of age, 19,922 children received the 9-valent pneumococcal polysaccharide vaccine conjugated to a noncatalytic cross-reacting mutant of diphtheria toxin (CRM197), and 19,914 received placebo.” (Abstract)
- “The protective efficacy of the vaccine against all serotypes of invasive pneumococcal disease in all children was 50 percent.” (p. 1344)
- “The results presented are for analyses conducted according to the intention-to-treat principle and include all cases of invasive pneumococcal disease and pneumonia. Qualitatively similar results were obtained with the use of per-protocol analyses.“ (p. 1346)
We also reviewed results from Lucero et al. 2009, a meta-analysis of RCTs conducted in a mix of higher and lower income countries, which estimates 58% efficacy against invasive pneumococcal disease caused by all serotypes. The studies underlying the results include Cutts 2005 and Klugman 2003 along with other trials conducted in the US, Finland, and the Philippines.
- "Pooled vaccine efficacy (VE) for VT‐IPD was 80% (95% confidence interval (CI) 58% to 90%, P 0.0001); all serotypes‐IPD, 58% (95% CI 29% to 75%, P = 0.001); World Health Organization X‐ray defined pneumonia was 27% (95% CI 15% to 36%, P 0.0001); clinical pneumonia, 6% (95% CI 2% to 9%, P = 0.0006); and all‐cause mortality, 11% (95% CI ‐1% to 21%, P = 0.08). Analysis involving HIV‐1 positive children had similar findings." p. 3
We rely on Cutts 2005 and Klugman 2003 for our efficacy estimates rather than the results in Lucero et al. 2009 because we think it’s plausible that vaccine efficacy would differ across settings based on what “serotypes” of S. pneumoniae are circulating, and which serotypes the vaccines being used target. We think it’s likely that serotype prevalence, and therefore vaccine efficacy, would be more comparable between Nigeria and the Gambia and South Africa than the US, Finland, or the Philippines (where the other trials generally found larger effects). We have not investigated which strains of S. pneumoniae are circulating in Nigeria, and how those compare to the strains circulating at the time of the trials.
- “Serotypes included in PCV7 accounted for ≥49% of IPD in each region, but this percentage varied substantially by region (range: 49%–82%), with highest serotype coverage in NA and Europe (Figure 4A). Coverage of PCV10 was similar to PCV13, with serotypes accounting for ≥70% of IPD in every region and less regional variability (range: 70%–84% and 74%–88%, respectively) than with PCV7 (Figures 4, and S6, S7, S8).“
- Cutts et al. 2005 was an RCT conducted in eastern Gambia. 8,718 infants were randomly allocated to receive 3 doses of a 9-valent PCV while 8,719 received a placebo. The study finds a 45% reduction in invasive disease caused by all serotypes as a result of vaccination. We did not identify any obvious quality concerns (the study was double-blind, there were no apparent losses to follow-up or baseline imbalances, and the results between the per-protocol and intention-to-treat analysis were similar).
- 123
World Health Organization, Diphtheria, pertussis, tetanus vaccines information sheet, 2014.
- 124
- "Study outcomes were required to be based on the current WHO definition of (1) "typical" pertussis (>14 days of cough with at least one of the following: paroxysmal cough, inspiratory whoop, or posttussive vomiting, in addition to laboratory confirmation); or (2) "severe" pertussis (>21 days of paroxysmal cough with laboratory confirmation of Bordetella pertussis infection, or epidemiological linkage). Studies using less stringent clinical criteria were also included if their laboratory criteria provided a high level of confidence for pertussis infection (eg, positive culture or polymerase chain reaction assay for B. pertussis)." Pg. 1101.
- "Regional Databases, with no date restrictions, for English-language studies using the following search terms: pertussis, whooping cough, DTwP, DTaP, vaccine, efficacy, morbidity, and mortality." Pg. 1101.
- "Meta-analysis of the 2 aP vaccine efficacy studies generated a random-effects pooled vaccine efficacy of 84% (95% confidence interval [CI], 81%–87%; P<.00001; Figure 2)." Pg. 1107.
- “Meta-analysis of 3 wP vaccine effectiveness studies (assessing the Behringwerke, Pasteur/Mérieux, and SmithKline Beecham formulations) yielded an overall wP vaccine effectiveness of 94% (95% CI, 88%–97%) (both I2 = 0%).”
We use the effect of the whole-cell pertussis vaccine in the cost-effectiveness analysis, since Nigeria uses a whole cell vaccine as part of the pentavalent in its routine immunization schedule.
- According to the WHO, as of 2023 the Nigerian routine immunization schedule uses a whole-cell (“wP”) pertussis vaccine as part of the pentavalent vaccine (DTwP-Hib-HepB)
- While only one of the studies included in the meta-analysis was an RCT, the RCT (Simondon 1997) was conducted in a country which we think is likely to be comparable to Nigeria (Senegal) and found an efficacy of 92% (95% CI: 81%–97%). Based on this, we think an efficacy of 94% from the whole cell vaccine in Nigeria is plausible.
- 125See calculations here.
- 126
See World Health Organization, Haemophilus influenzae type b (Hib) Vaccination Position Paper – July 2013, pg. 414. “Hib infection and disease start with colonization of the nasopharynx. Following colonization the organism can cause disease either (i) through invasion of the bloodstream with secondary spread to other sites leading to meningitis, pneumonia, and other serious diseases including septic arthritis, osteomyelitis, pericarditis, cellulitis and epiglottitis (referred to collectively as invasive Hib disease) or (ii) through contiguous spread to the paranasal sinuses or the middle ear leading to sinusitis and otitis media.”
- 127
"Nine randomized studies were included in the analysis. Pooled vaccine efficacy using a fixed effects model against confirmed invasive Hib disease following the 3, 2 and 1 primary dose schedule were 82% [95% confidence interval (CI) 73-87], 79% (95% CI 54–90) and 65% (95% CI 23–84), respectively, and the overall efficacy was 80% (95% CI 72–85)." Thumburu et al. 2015, pg. 31.
- 128See Figure 1, Sudfeld, Navar, and Halsey 2010, p. I50.
The same meta-analysis estimates efficacy for two doses of ~98%. This is based on serological and observational studies rather than randomized controlled trials.
“The effect of a second dose of measles vaccine on measles disease or mortality compared with no vaccination has not been evaluated on individual children in prospective randomized studies as this type of trial would be unethical. Therefore, the best estimate of the effect of a two-dose measles vaccine schedule on measles mortality must be extrapolated from serology data, studies looking at effectiveness of two dose vs one-dose measles vaccination, and observational studies. Caution should be taken when using serology data to estimate the impact on mortality. A recent WHO review of serology studies determined that a median 97% [inter-quartile range (IQR) 87–100%] of children that failed to seroconvert to first dose measles vaccine developed immunity after a second dose.64 If 85% efficacy is assumed for single dose measles vaccine, these serology results would correlate to an efficacy of 99.6% for two dose measles vaccine with a range of 98.1–100% based on the IQR of the review. In addition, the effectiveness of two doses of measles vaccine will vary by setting based on the age of vaccination. Epidemiologic studies comparing the effectiveness of early two dose vaccination vs single dose have found varying results in developing country settings; a study in Niger found two doses (first dose at 6–8 months and second at 9 months) was 23% less effective than single dose whereas studies in India (first dose at 9–12 months and second at 15–18 months) and Guinea Bissau (first dose at 6–8 months and second at 9–12 months) determined two doses of vaccine were respectively 83 and 90% more effective than one dose of measles vaccine.66–69 In order to produce a conservative estimate of the efficacy of two dose measles vaccine per LiST rules, we felt an input of 98% based on the lower quartile of the WHO two dose measles vaccine serology review was reasonable.” Sudfeld, Navar, and Halsey 2010, p. I52.
- 129
"Diseases prevented: Disseminated disease and meningitis caused by M. tuberculosis." Feikin et al. 2016, Annex 10A, p. 4
- 130
Abubakar et al 2013 was a systematic review and meta-analysis of studies on the impact of BCG vaccination. We rely on the set of results which only included RCTs for our estimates. The review finds that neonatal BCG vaccination has a 66% efficacy against deaths due to tuberculosis.
- “The most consistent protective effect of BCG vaccination was seen in neonatal vaccination and school-age vaccination with stringent tuberculin testing [overall good protection with rate ratio from five studies of 0.34 (95% CI 0.12 to 0.92) corresponding to a VE of 66% (95% CI 8% to 88%) and rate ratio from one study of 0.26 (95% CI 0.17 to 0.40) corresponding to a VE of 74% (95% CI 60% to 83%), respectively].” (Chapter 4, Results)
- 131
"Diarrhea remains the second leading cause of death around the world for children under 5 years of age. Because the majority of diarrhea deaths occur in the low and middle-income countries, the etiologic agents responsible for diarrhea deaths among young children are unknown. Using hospitalization data as a best estimate of severe diarrheal disease and a proxy for diarrhea mortality, it has been estimated that rotavirus may be responsible for up to 39% of child deaths, the majority of which occur in low and middle income countries." Walker and Black 2011, pg. 1.
- 132
See Lamberti et al. 2016, Table 1.
- 133
“The Lives Saved Tool is a mathematical modeling tool which allows users to estimate the impact of coverage change on mortality in low and middle income countries.” LiST, Home page, accessed July 26, 2023. The tool provides meta-analyses as sources for its estimates.
To obtain the vaccine efficacy estimates above, we accessed LiST’s ‘Explore Data’ tool (available here), and looked at its sources for estimates of vaccine efficacy for children under-five. We used the efficacy estimates cited in its sources for each disease available (see the footnotes for the table above where we cite the meta-analyses available via the LiST tool). - 134
An "intention-to-treat" (ITT) analysis includes all RCT subjects originally allocated to receive the intervention, whereas a "per-protocol" analysis is a comparison of treatment groups that includes only subjects who in fact completed the intervention.
The meta-analyses referenced in LiST include a combination of ITT and per-protocol effects. Where possible, we've used ITT effects. - 135
See this section of our analysis.
- 136This is a rough guess, which we have not thoroughly vetted. There is other evidence consistent with the effect size reported from serological studies of measles (see sources below). Our impression (which we have not investigated in detail) is also that measles has been reduced in many countries that have had good vaccination coverage.
A Cochrane review (Di Pietrantonj et al. 2020) finds an effect of 95% for a single dose at age 9 months to 15 years, though this is also based on cohort studies and includes a much broader age range. We therefore do not put any weight on it in our analysis.
"The proportion of children who develop protective antibody levels following measles vaccination depends on the presence of inhibitory maternal antibodies and the immunological maturity of the vaccine recipient, as well as on the dose and strain of the vaccine virus as described in detail below. In general, some 85−90% of children develop protective antibody levels when given one dose of MCV at 9 months of age, and 90−95% respond when first vaccinated at 12 months of age. Median MCV effectiveness (i.e. protection from disease) following a single dose of MCV administered at 9−11 months of age was 84% (interquartile range [IQR] 72–95%) across several studies, and increased to 92.5% (IQR 84.8–97%) among children first vaccinated at 12 months or older. Thus most, but not all, children are protected following a single dose of MCV." World Health Organization, Immunological Basis for Immunization Series, Measles, 2020, pg. 12.
- 137The RCTs we rely on for our estimates of the BCG vaccine efficacy were conducted in the 1930s and 40s, prior to standardization of research methods and reporting. We think it’s plausible that the estimates are less robust due to weaker methodological quality.
“Randomised controlled trials provide the best evidence for the effectiveness of any intervention. Unfortunately, data from trials investigating BCG vaccination efficacy are limited largely by the fact that most were conducted decades prior to the development of robust standard methods for RCTs. Therefore, it is not surprising that they are subject to several potential biases, and some failed to report essential information, for example on the strength of PPD used for tuberculin sensitivity testing.” Abubakar et al 2013, Chapter 5
- 138Our understanding is that there’s still considerable controversy around the efficacy of the BCG vaccine, particularly in different geographies (more in our discussion of external validity). However, our rough impression is that the studies with higher diagnostic quality generally found higher effect sizes, so we do not make a downward adjustment for internal validity here.
“A previous appraisal by Clemens et al.40 provided a framework for our assessment of trial quality. Following careful consideration, we abstracted the quality criteria outlined in this review but a priori selected one criterion – blinding of study staff who assessed outcome on BCG vaccination status or the use of active surveillance – to inform our judgement about quality in the statistical models. Based on these criteria, which we described as diagnostic detection bias, studies with a lower risk of bias had a more significant protective effect compared with those with a higher risk of bias. This is contrary to the usual pattern in which biased studies are generally associated with an exaggeration of effect size.” Abubakar et al 2013, Chapter 5
- 139 For example, many vaccines require constant refrigeration to maintain their potency, and the cold chain may be weaker outside of study contexts.
From UNICEF , “Vaccines must be continuously stored in a limited temperature range – from the time they are manufactured until the moment of vaccination. This is because temperatures that are too high or too low can cause the vaccine to lose its potency (its ability to protect against disease). Once a vaccine loses its potency, it cannot be regained or restored.”
- 140There is mixed evidence on the efficacy of the BCG in different geographies, with RCTs conducted closer to the equator generally finding smaller (or no) effects from BCG vaccination on pulmonary tuberculosis in adults. These studies are all relatively old and included a mix of children and adults.
"Protection against pulmonary tuberculosis in adults is variable, ranging from substantial protection in the UK MRC trial {rate ratio 0.22 [95% confidence interval (CI) 0.16 to 0.31]}, to absence of clinically important benefit, as in the large Chingleput trial [rate ratio 1.05 (95% CI 0.88 to 1.25)] and greater in latitudes further away from the equator. BCG vaccination efficacy was usually high, and varied little by form of disease (with higher protection against meningeal and military tuberculosis) or study design when BCG vaccination was given only to infants or to children after strict screening for tuberculin sensitivity. High levels of protection against death were observed from both trials and observational studies.”Abubakar et al 2013, Abstract
- 141
The study we use for HiB efficacy (Thumburu et al. 2015) uses ITT effects. However, other studies use a combination of ITT and per-protocol effects. The appropriate adjustment would also take into account efficacy achieved through partial vaccination.
- 142
"Vaccination with the protein-polysaccharide conjugate vaccine, PCV7, has significantly reduced the burden of pneumococcal disease in populations where it is in widespread use and has had an important public health benefit. This vaccine targets only 7 of the more than 92 pneumococcal serotypes, and there have been concerns that the non-vaccine serotypes (NVTs) could increase in prevalence and reduce the benefits of vaccination." Weinberger, Malley, and Lipsitch 2011, pg. 1.
- 143
For example, we estimate that the diseases targeted by PCV are responsible for 36% of vaccine-preventable deaths among children under age five in Bauchi, compared to 5% for the measles vaccine. See this section of our analysis.
- 144
Note that this figure does not appear directly in our cost-effectiveness analysis. In our cost-effectiveness analysis, we adjust each vaccine’s efficacy to reflect lower vaccine efficacy in Nigeria (more) and imperfect coverage during the underlying trials (more) in this sheet. We then aggregate them here in our analysis.
We present the aggregated estimate of unadjusted vaccine efficacy here for simplicity. This change to the order of operations does not make a quantitative difference.
Note: The variation between states is because different diseases are responsible for varying shares of mortality in each state.
- 145
See this sheet in our cost-effectiveness analysis for these estimates.
- 146
The adjustments we apply are:
- Removing deaths that we think are likely to occur before each vaccine is administered (more).
- An adjustment for disease etiology (cause of disease) (more).
- An adjustment for unvaccinated children having higher mortality (more).
We do not apply the adjustment for all-cause mortality to these estimates because we are unsure how vaccine nonspecific effects vary across vaccines. This is equivalent to assuming nonspecific deaths are the same across vaccines.
- 147
See this section of our cost-effectiveness analysis.
- 148
For example, Thumburu et al. 2015 includes studies from Finland, Chile, Gambia, the US, and Indonesia, among others.
- 149
One piece of evidence for this is that the meta-analysis we rely on to estimate rotavirus efficacy finds efficacy varies widely by region. Efficacy in sub-Saharan Africa (the estimate we use in our analysis) is significantly lower than efficacy in wealthy countries. “Efficacy against severe rotavirus diarrhea ranged from 90.6% [95% confidence interval (CI): 82.3–95.0] in the developed region to 88.4% (95% CI: 67.1–95.9) in Eastern/Southeastern Asia, 79.6% (95% CI: 71.3–85.5) in Latin America and the Caribbean, 50.0% (95% CI: 34.4–61.9) in Southern Asia and 46.1% (95% CI: 29.1–59.1) in sub-Saharan Africa”, Lamberti et al 2016, pg 1.
- 150
See this row in our cost-effectiveness analysis.
- 151
This interval was selected by GiveWell staff members familiar with our New Incentives analysis based on their subjective judgment. It does not appear in our cost-effectiveness analysis.
- 152
We assign the following weights based on our subjective impression of how informative each source is about the likely efficacy of the measles vaccine in Nigeria today:
- 20% Weight assigned to the vaccine efficacy rate from the LiST meta-analysis
- 10% Weight assigned to the vaccine efficacy rate GiveWell infers from the results of IDinsight's biomarkers pilot
- 35% Weight assigned to each of Fowotade et al. 2015 and Uzicanin and Zimmerman 2011.
The weights are in this section of our cost-effectiveness analysis.
- 153
This figure is a weighted average of the -19% (measles) and -14% (non-measles) adjustments, weighted by each vaccine’s contribution to reducing deaths among children under five. The adjustment varies slightly between states because we think that each vaccine contributes a different amount to the program benefit in each state.
- 154
See this row in our cost-effectiveness analysis.
- 155
We have considered two reasons why the biomarker results could be measles-specific, although we haven’t deeply investigated either:
- Children in Nigeria could receive the measles vaccine too young. The first dose of measles is given at 9 months in the Nigeria vaccination schedule, compared to 12 - 15 months (for the MMR vaccine) in many high-income countries. This could be too early for them to develop antibodies in response to vaccination.
- No measles 2 vaccine: At the time the biomarker pilots were conducted, Nigeria only offered one dose of the measles vaccine (compared to two doses in many high-income countries). We would guess that this is insufficient to induce full immunity for some children.
- 156
See here.
- 157
We estimate vaccine efficacy as a function of (i) the test sensitivity (the proportion of children with antibodies correctly identified by the test), (ii) the proportion of children falsely reported to be vaccinated, (iii) the proportion of children who were immune before the test, because of a previous measles infection, and (iv) the proportion of children testing positive.
Our calculations are in this supplementary spreadsheet. We use the following assumptions:
- Test sensitivity: we use a reported figure that the test sensitivity is 86%. We do not have permission to share the source for this estimate.
- False report: we roughly guess that 15% of children are falsely reported to be vaccinated when they were not.
- Prior immunity: we roughly estimate that 5% of children had a prior measles infection. This is a rough estimate, based on a number of sources, discussed here.
- Rate testing positive: we use the pilot’s finding that 22% of children tested positive.
These assumptions imply a vaccine efficacy of 26% (see calculation in this row).
Note: Our analysis assumes that vaccine efficacy is linearly correlated with the proportion of children developing antibodies. We have not deeply investigated this assumption. - 158 The expert we spoke to told us that:
- In order to get an adequate oral fluid sample for biomarkers tests like the ones we believe were used in the IDInsight biomarkers pilot, study participants need to have their gums rubbed for about two minutes. We think it’s highly plausible specimen collection was poor for many of the children included in the biomarkers pilot.
- Interpreting the results from many commercial enzyme assay kits is difficult, and there is some leeway in determining the right thresholds to use to detect antibodies.
- 159 In particular, the IDinsight team submitted a number of “fake” samples collected from staff who had been vaccinated for measles as part of the piloting. Most of these samples were obtained by purposefully employing poor collection techniques or improperly storing the tests. The results from these fake samples were closer to the expected sensitivity from the biomarker test.
- 160
"This study was designed to assess the seroconversion rate of measles vaccine among infants receiving measles immunization in Ilorin, Nigeria. . . . Only 286 (71.5%) of the vaccines returned to give post-vaccination samples. All the infants screened had low pre-vaccination measles antibody titers. Thirty one (8.0%) of the infants had measles prior to vaccination. The seroconversion pattern showed that 196 (68.6%) of the infants developed protective antibody titers." Fowotade et al. 2015, Abstract
- 161
"This study was designed to assess the seroconversion rate of measles vaccine among infants receiving measles immunization in Ilorin, Nigeria. . . . Only 286 (71.5%) of the vaccines returned to give post-vaccination samples. All the infants screened had low pre-vaccination measles antibody titers. Thirty one (8.0%) of the infants had measles prior to vaccination. The seroconversion pattern showed that 196 (68.6%) of the infants developed protective antibody titers." Fowotade et al. 2015, Abstract
- 162
"The loss in vaccine virus titers in our centre may be attributed partly to repeated thawing and freezing due to erratic power supply and the absence of standby power generating set serving the immunization clinic where the vaccines are stored. Another contributory factor is the absence of a refrigerator thermometer to ensure that the correct storage temperature is maintained. The low potency found has been the usual trend in potency studies carried out by various researchers in Nigeria. This finding is however different from vaccine studies carried out in other parts of the world. Techatharyat et al. in Thailand and Saha et al. in India reported measles vaccine potency test results of 100.0% and 95.0% respectively. Other adverse factors such as poor handling by vaccinators, existence of chains of salesmen, lack of good storage system for vaccines and difficulty in maintaining a cold chain system have also been suggested to be responsible for the loss in potency of vaccines used in Nigeria and other African countries." Fowotade et al. 2015, Discussion.
- 163
"These vaccines were obtained from United Nations International Children’s Emergency Fund (UNICEF), through the State EPI Unit and were stored in the freezer until required for immunization. These lyophilized Ruvax vaccines were maintained in cold chains and reconstituted each time per vial according to manufacturer’s instruction." Fowotade et al. 2015, Materials and Methods.
- 164
See this row in our cost-effectiveness analysis.
- 165
- “One hundred and twenty-two out of 130 children (93.9%) who had received DPT had protective levels of anti-tetanus IgG compared to 278 out of 288 children (96.5%) who had received the pentavalent vaccine… DPT and pentavalent vaccines are equally effective in inducing protective levels of anti-tetanus IgG in children”, Uket et al. 2018, abstract.
- “Four hundred and eighteen children participated in the study. The mean IgG antibody level was 1.021 ± 0.9 IU/ml. Four hundred children (95.7%) had protective levels of antibodies”, Ekanem, Uket, and Okpara 2018, abstract.
- 166
- “The prevalence of BCG scar was 79.5% among the male infants and 84.7% among the female infants, while the overall prevalence of BCG scar was 81.5%”, Gambo et al. 2014, results.
- “Two hundred and six subjects (96.3%) had a post-vaccination BCG scar”, Atimati and Osarogiagbon 2014, abstract.
- “84.2% had physical evidence of BCG inoculation”, Odujinrin and Ogunmekan 1992, abstract.
- 167
“Only one‑third (49/138) of those vaccinated had identifiable BCG scars”, Orogade et al. 2013, abstract.
- 168
- “Of the vaccinated children, 157 (57.5%) developed protective measles virus HI antibody, which is not enough to maintain protective herd immunity”, Onoja and Adeniji 2013, abstract
- "A total of 150 (52.8%) of the 284 children who received measles vaccine returned for post-vaccination screening, and of these, 82 (54.7%) seroconverted (titres, 10-320) following vaccination; 68 (45.3%) did not seroconvert (Table 1)." Adu et al. 1992, pg. 458.
- “The seroconversion pattern showed that 51(60%) had potent antibody titres ranging from 1:40 to 1:1280, while the remaining 34 (40%) had a low antibody titres between < 1:20 and 1:20”, Omilabu et al. 1999, abstract.
- 169
Many have small sample sizes and many are published in less well-recognized journals.
- 170
- Uzicanin and Zimmerman 2011 find a median vaccine efficacy for individuals who were 9-11 months old at age of first dose of 77%, with vaccine efficacy ranging from 73% in the WHO Africa region to 96% in the WHO European region (Table 2, pg. 145).
- "Results of this literature review suggest that the VE of MCV1 administered at 9–11 months of age is generally lower than 85%, which is the usual expected rate of immune response after vaccination at that age." Uzicanin and Zimmerman 2011, pg. 135.
- "Generally, the reasons related to low VE estimates can be grouped into 3 broad categories, including (1) issues related to study methods; (2) program-related factors, such as appropriate vaccine storage, handling, and administration; and (3) host-related factors, most notably, age at vaccination." Uzicanin and Zimmerman 2011, pg. 144.
- 171
The 95% guess appears here in our cost-effectiveness analysis.
- 172
This appears as a 100% ratio between vaccine-preventable disease and vaccine-preventable mortality in our cost-effectiveness analysis. See this row.
- 173
See this section in our cost-effectiveness analysis.
- 174
This excludes our supplemental adjustments discussed in section 4.6. See this row in our cost-effectiveness analysis.
- 175
For ease of modeling, we quantify our uncertainty ranges for benefits other than mortalities averted among people under age 5 as percentage adjustments applied to other modeled benefits of the program. For Bauchi:
- Our 25th to 75th percentile range for mortalities averted after age 5 is an adjustment ranging from +7% to +29% (with the percentage adjustment applied to the modeled benefits of averted mortality for children under five). See table above.
- This conversion is imperfect because varying the proportion of the program's total impact that is contributed by one type of benefit will also affect the proportion of impact contributed by other types of benefits, but we think the values presented in the table are a reasonably good approximation of our uncertainty level for this parameter.
- 176
Note: We use a similar method to the one described above to estimate vaccine-preventable mortality among unvaccinated children (as opposed to all children). This method incorporates estimates of vaccine coverage among this age group during the time period in which this age group would have been scheduled to receive child vaccinations. To roughly estimate this, we assume that people aged 5 - 14 were 50% less likely to have been vaccinated than children under age 5 today, 15 - 49 year olds were 80% less likely to have been vaccinated, and 50 - 74 year olds were 90% less likely to have been vaccinated. See this section in our cost-effectiveness analysis.
- 177
A discount rate of 0.5% implies that we discount the value of averting a death by 0.5% if it happens one year from now, compared to if it happens now. The purpose of this discount rate is to account for uncertainty about future events, for example, possible fundamental changes which would render the program ineffective. The discount rate compounds, so deaths averted far in the future are valued less than deaths averted in the near future. See this document for more details on discount rates.
- 178
Our method for 15 - 49 year olds and 50 - 74 year olds is the same, but we apply larger discounts for reduced mortality and vaccine efficacy in the future.
- 179
To reach this figure, we also apply our discount rate. This slightly reduces the effective number of deaths we think will be averted in the future, because each death counts for less than if it was averted now. See this row of our cost-effectiveness analysis for our calculation.
- 180
This calculation takes into account both the numbers of deaths averted in each age group and GiveWell’s moral weights for averting a death in each age group (we assign more weight to averting the deaths of children than adults).
- 181
See this row in our cost-effectiveness analysis. Note that this estimate doesn’t account for the benefits we incorporate as rough supplemental adjustments, and so can’t be interpreted as an estimate of the total benefits of the program.
- 182
For ease of modeling, we quantify our uncertainty ranges for benefits other than mortalities averted among people under age 5 as percentage adjustments applied to other modeled benefits of the program. For Bauchi:
- Our 25th to 75th percentile range for income effects is an adjustment ranging from +0% to +56% (with the percentage adjustment applied to the total modeled benefits of averted mortality). See the "Adjustment to account for developmental benefits (long-term income increases)" row on the 'Sensitivity analysis' sheet of our cost-effectiveness analysis.
- This roughly translates to between 0% and 34% of the total modeled benefits of the program, as shown in the table above.
- This conversion is imperfect because varying the proportion of the program's total impact that is contributed by one type of benefit will also affect the proportion of impact contributed by other types of benefits, but we think the values presented in the table are a reasonably good approximation of our uncertainty level for this parameter.
- 183
Our estimate of the development effects of deworming programs is based on long-run follow-ups to the experiment described in Miguel and Kremer 2004. See our report on mass deworming programs for our full assessment of the study. For malaria programs, we rely on the findings of two natural experiments: Bleakley 2010 and Cutler 2010. See this section of our report on mass distribution of insecticide-treated nets (ITNs) for a detailed discussion of these studies.
- 184
“This study uses the malaria-eradication campaigns in the United States (circa 1920), and in Brazil, Colombia and Mexico (circa 1955) to measure how much childhood exposure to malaria depresses labor productivity. The campaigns began because of advances in health technology, which mitigates concerns about reverse causality. Malarious areas saw large drops in the disease thereafter. Relative to non-malarious areas, cohorts born after eradication had higher income as adults than the preceding generation. These cross-cohort changes coincided with childhood exposure to the campaigns rather than to pre-existing trends. Estimates suggest a substantial, though not predominant, role for malaria in explaining cross-region differences in income.” Bleakley 2010, abstract.
“We examine the effects of exposure to malaria in early childhood on educational attainment and economic status in adulthood by exploiting geographic variation in malaria prevalence in India prior to a nationwide eradication program in the 1950s. We find that the program led to modest increases in household per capita consumption for prime age men, and the effects for men are larger than those for women in most specifications. We find no evidence of increased educational attainment for men and mixed evidence for women.” Cutler 2010, abstract.
- 185
See this section of our report on insecticide-treated nets for more detail on these estimates.
- 186
See this row in our cost-effectiveness analysis.
- 187
See this row in our cost-effectiveness analysis.
- 188
For the income increase per household member, see here in our cost-effectiveness analysis. For the proportion of benefits this makes up, see this row.
- 189
For ease of modeling, we quantify our uncertainty ranges for benefits other than mortalities averted among people under age 5 as percentage adjustments applied to other modeled benefits of the program. For Bauchi:
- Our 25th to 75th percentile range for income effects is an adjustment ranging from +2% to +7% (with the percentage adjustment applied to all the other modeled benefits of the program, including averted mortality and long-term income effects). See this row in the “Sensitivity analysis” section of our cost-effectiveness analysis.
- This roughly translates to between 2% and 6% of the total modeled benefits of the program, as shown in the table above.
- This conversion is imperfect because varying the proportion of the program's total impact that is contributed by one type of benefit will also affect the proportion of impact contributed by other types of benefits, but we think the values presented in the table are a reasonably good approximation of our uncertainty level for this parameter.
- 190
To compare cost-effectiveness across different programs, we use "moral weights" to quantify the benefits of different program impacts (e.g., increased income versus reduced deaths). We benchmark the value of each benefit to a unit value of 1, which we define as the value of doubling someone’s consumption for one year. For more on our approach to moral weights, see this document.
We model units of value for income increases in terms of the natural log of consumption. The logarithmic model captures the idea that money has diminishing value as you get more and more of it. For example, our model considers a 50% increase in income as a little better than 50% as good as an 100% increase in income. Using this model, a $1.34 increase in income from a $286 baseline equates to 0.01 units of value. See this row in our cost-effectiveness model.
- 191
New Incentives has made a number of changes to its incentive schedule over time, from the original 4,000 naira incentive offered during the RCT:
- New Incentives originally added a 500 naira incentive for measles 2 (which had not yet been introduced into Nigeria's routine vaccination schedule at the time of the RCT). This brought the total incentive across all visits to 4,500 naira. In early 2023, New Incentives increased the incentive for measles 2 to 1,000 naira. This brought the total incentive across all visits to 5,000 naira.
- In August 2023, New Incentives decided to change its schedule to offer 1,000 naira per visit. This brought the total incentive across all visits to 6,000 naira.
- In April 2024, New Incentives decided to pilot offering an additional 5,000 naira incentive at the measles 2 vaccination visit for caregivers whose infants completed the entire routine immunization schedule. As of May 2024, New Incentives had begun piloting this additional incentive in a few clinics, and expected to roll it out across the program later in 2024, conditional on the pilot proceeding well. The calculations in our cost-effectiveness analysis assume that this incentive will be offered in all states where New Incentives operates.
New Incentives, January 14, 2022; December 16, 2022; September 8, 2023; May 13, 2024 Program Updates (unpublished).
- 192
We calculate this as follows:
Average per visit transportation cost among caregivers who reported paying for transportation in 2023: 149 naira (one-way cost) x 2 = 298 naira round trip cost
Percentage of disbursements for which caregivers reported no transportation cost in 2023: 68%Average total transportation cost across the full routine immunization schedule: (298 naira x 6 visits) x (1 - 68%) = 577 naira
See the 2023 transportation cost data here.
- 193
See this spreadsheet for our calculations (underlying data from StatCompiler available here). The states we include in this average are: Zamfara, Katsina, Jigawa, Sokoto, Bauchi, Kaduna, Gombe, Kano, and Kebbi. For simplicity and because these estimates make such a small difference to our bottom line, we use a cross-state average rather than a state-specific estimate.
- 194
The calculation behind this value can be found in the "Cash" section of the "Parameters" tab at this link. Our analysis is based on Haushofer and Shapiro 2013, an RCT of GiveDirectly’s program. In Haushofer and Shapiro 2013, non-durable expenditure in the control group is measured as USD 157.40 PPP per month (p. 49). We multiply this value by 12 to put it in annual terms, converted to nominal USD, and divided by the average household size.
- 195
New Incentives’ monitoring data is available here. In 2023, New Incentives estimated that retention rates varied between 75% and 96%, depending on the specific vaccine. These rates were similar to those found in the RCT.
- 196
The World Bank reports estimates in 2022 that Nigeria’s GDP per capita was $2,184 and Kenya’s was $2,099 (estimates available here).
- 197
Our understanding is that there is some opposition to New Incentives’ program among some individuals in the Nigerian federal government and that concerns about sustainability and potential backlash effects are parts of this concern. See this section of our separate page on New Incentives’ program for more details. New Incentives also reports hearing this concern from other partners.
“A concern . . . stakeholders (including UNICEF representatives) have shared with us is about incentives replacing intrinsic motivations to immunize infants in the absence of incentives. This was experienced by WHO when some women in Northern Nigeria started refusing vaccinations if they didn't get the in-kind donations that were previously being offered during Polio campaigns.” New Incentives, Responses to questions from GiveWell, September 23, 2020 (unpublished) - 198
New Incentives field officers identify incidents of low supply (e.g. due to stockouts or runouts of vaccines during immunization days), and report them to the relevant stakeholders responsible for ensuring vaccine supply. New Incentives also proactively requests additional vaccines and regularly engages with stakeholders to share information on and close supply gaps. In addition, New Incentives conducts awareness-raising activities, such as advertising the program at partner clinics, holding community meetings to talk about the benefits of vaccines, and running radio advertisements for the program. More on these aspects of its work here and here on our separate page about New Incentives' program.
- 199
- “A concern . . . stakeholders (including UNICEF representatives) have shared with us is about incentives replacing intrinsic motivations to immunize infants in the absence of incentives. This was experienced by WHO when some women in Northern Nigeria started refusing vaccinations if they didn't get the in-kind donations that were previously being offered during Polio campaigns.” New Incentives, Responses to questions from GiveWell, September 23, 2020 (unpublished).
- While we view these reports as concerning, we have not identified evidence in support of systematic negative effects from removal of the polio vaccine incentives. New Incentives also told us it believes incentives play a different role in its program than they did in the polio vaccination campaign, since campaigns provide vaccinations door-to-door (and thus create limited costs for caregivers), while New Incentives incentivizes vaccinations at clinics (which have higher time and transport costs for caregivers).
- “Note: we have received conflicting reports and opinions regarding in-kind incentives during Polio campaigns. CCTs for Routine immunization are different from offering in-kind incentives or ‘pluses’ during Polio campaigns where caretakers do not bear any cost to vaccinate their children with an oral vaccine at their home. We take concerns around intrinsic motivation and perverse incentives very seriously. We do not think these are unique to the application of CCTs to immunizations as similar concerns exist for application of CCTs to other health and non-health behaviors. We have incorporated messaging in various components of the program to help caretakers understand that vaccinations are important to protect their children against deadly diseases.” New Incentives, Responses to questions from GiveWell, September 23, 2020 (unpublished).
- We would guess that the incentives in the polio vaccination campaign were more likely to crowd out intrinsic motivation or generate distrust in the healthcare system than the incentives offered by New Incentives' program.
- We think it’s plausible that incentives viewed more as external rewards would be more likely to crowd out intrinsic motivation. In New Incentives’ context, caregivers bring their children in to clinics to receive their vaccinations. We think the incentives offset some of the time and transportation costs, and thus may support caregivers’ desires to bring their children in for vaccinations. In contrast, because the polio vaccine was provided in a more convenient way (door-to-door), the incentives may have been seen as an external reward that focused attention away from caregivers’ intrinsic motivation to vaccinate their child.
- 200
“Demand-Side Incentives (DSIs) have primarily been used to address inter-generational poverty (including through incentivizing well-child and education programs) but have also shown promising results in increasing demand and coverage of specific health services, including vaccination. Conditional Cash Transfers (CCTs) and Conditional Non-Cash Transfers (CTs) are DSI approaches which provide beneficiaries with money or valuable goods for accomplishing a task or meeting specified requirements. In the context of immunization programs, CCT’s and CT’s can be applied by granting caregivers financial or non- financial incentives for immunizing their children.” Gavi, "Request for proposal (RFP) Demand-Side Incentives to Address Immunization Challenges", 2023, p. 5.
- 201
Onwujekwe et al. 2020 and Ezenwaka et al. 2021 were non-randomized studies that found mixed effects post-program (a persistent increase in public health facility use roughly 2 years after withdrawal with some evidence of decreased trust in the healthcare system).
- Onwujekwe et al. found that in the group which received CCTs, public health facility use remained higher 2 years after the withdrawal of the program, indicating a durable effect of cash incentives. There did not appear to be a persistent effect in the group which received the SURE-P program but not CCTs.
- “A second issue concerns the extent to which the large up-front cost can be considered not only as a way of encouraging current use of skilled delivery services but as an investment that generates a longer term impact on health seeking behavior going well-beyond the end of the programme. The timing of the study allows us to examine what happened after the ending of funding for the intervention. Information on use of services 2 years beyond the end of the programme suggest that the effect of the intervention may have continued well-beyond the period of funding. The investment in the supply side into equipment and the facility was not immediately lost when the programme closed so potentially explaining the continued effect. It is notable, however, that the persistent effect is largely evident in the CCT areas and not the SP areas which also received the supply side investment.” Onwujekwe et al 2020.
- “This finding is supported by a community survey undertaken as part of the wider realistic evaluation of the SURE-P programme: 70% of women living in CCT areas said that their trust in public services increased as a result of the introduction of CCTs compared to 49% in SURE-P only areas (15). Following withdrawal of CCTs, the majority of those women in those areas (62%) reported continued high levels of trust. This is reinforced by patterns of delivery which suggested that there was no statistical difference in the proportion of women reporting using a public facility during and after the CCT programme (69 ± 6.4% before compared to 64 ± 7.8% after).” Onwujekwe et al 2020.
- Ezenwaka et al. also reported qualitative evidence of reduced trust in the healthcare system.
- “Results: The CCTs contributed to increasing facility attendance and utilization of MCH services by reducing the financial barrier to accessing healthcare among pregnant women. However, there were unintended consequences of CCT which included a reduction in birth spacing intervals, and a reduction of trust in the health system when the CCT was suddenly withdrawn by the government.” Ezenwaka et al. 2021, abstract.
- Onwujekwe et al. found that in the group which received CCTs, public health facility use remained higher 2 years after the withdrawal of the program, indicating a durable effect of cash incentives. There did not appear to be a persistent effect in the group which received the SURE-P program but not CCTs.
- 202
Studies of cash incentives for non-vaccination health behaviors in low- and middle-income countries found no evidence of negative post-program effects, or evidence of positive health behaviors persisting after incentives were taken away. Studies we’ve reviewed:
- McCoy et al. 2017, an RCT of ~800 participants estimating the effect of CCTs and food transfers incentivizing antiretroviral therapy adherence in Tanzania. The primary outcome was the percentage of participants who possessed antiretrovirals for over 95% of the time they were tested (medication possession ratio (MPR) ≥95%). It found that the program had a ~22 percentage point effect at the end of the intervention and roughly 20 percentage points six months after that.
- "At three clinics, 805 participants were randomized to three groups in a 3:3:1 ratio, stratified by site: nutrition assessment and counseling (NAC) plus cash transfers (~$11/month, n=347), NAC plus food baskets (n=345), and NAC-only (comparison group, n=113, clinicaltrials.gov NCT01957917)" (abstract)
- "Cash or food was provided for 6 or less consecutive months, conditional on visit attendance. The primary outcome was medication possession ratio (MPR ≥ 95%) at 6 months." (abstract)
- "The primary intent-to-treat analysis included 800 participants. Achievement of MPR≥95% at 6 months was higher in the NAC+cash group compared to NAC-only (85.0% vs. 63.4%), a 21.6 percentage point difference (95% confidence interval (CI): 9.8, 33.4, p<0.01). MPR≥95% was also significantly higher in the NAC+food group versus NAC-only (difference=15.8, 95% CI: 3.8, 27.9, p<0.01). When directly compared, MPR≥5% was similar in the NAC+cash and NAC+food groups (difference=5.7, 95% CI: −1.2, 12.7, p=0.15). Compared to NAC-only, appointment attendance and LTFU were significantly higher in both the NAC+cash and NAC+food groups at 6 months. At 12 months, the effect of NAC+cash, but not NAC+food, on MPR≥95% and retention was sustained.” (abstract)
- "At 12 months, MPR≥95% was significantly greater among those in the NAC+cash group than the NAC-only group (74.9% vs. 55.4%, adjusted difference=20.3, 95% CI: 8.4, 32.2, p<0.01) in both ITT and adjusted analyses." (p. 7)
- 74.9% - 55.4% = roughly a 20 percentage point increase in MPR≥95% for the NAC+cash group compared to the NAC-only group.
- de Walque, Dow, and Nathan 2014, an RCT including ~2400 participants, estimating the effect of CCTs incentivizing safe sexual practices in Tanzania. It found a 25% decrease in sexually transmitted infections for a $20 transfer after 12 months. A follow-up at 24 months found a decrease of approximately 20%, although this was not statistically significant.
- “The Rewarding Sexually Transmitted Infection Prevention and Control in Tanzania (RESPECT) study is a randomized controlled trial testing the hypothesis that a system of rapid feedback and positive reinforcement that uses cash as the primary incentive can be used to reduce risky sexual activity among young people, male and female, who are at high risk of HIV infection. The study enrolled 2,399 participants in 10 villages in rural southwest Tanzania.” (abstract)
- "The intervention arm was further divided into two subgroups, one receiving a high value payment of up to $60 over the course of the study ($20 payments every four months)" (abstract)
- "at month 12 (column 3) the high value CCT arm corresponds to a 25% risk reduction compared to the control group (relative risk of 0.749 statistically lower than 1)" (p. 13)
- See Table 3, p.28: “Month 12 combined prevalence of 4 STIs tested at every round: 0.749** and Table 3, p.28: “Month 24 combined prevalence of 4 STIs tested at every round:0.798” (pg. 28).
- "*** p<0.01, ** p<0.05, * p<0.1 denote a Relative Risk significantly different from 1." Table 3, pg. 28.
- Fahey et al. 2021, a follow-up to a trial of cash or food transfers for monthly healthcare appointments for adults starting HIV treatment in Tanzania. The study found no statistically significant differences in retention in care between groups 24 and 36 months after the program ended, and a non-significant trend in favor of the intervention group after 36 months, indicating no evidence of crowding out.
- “We traced former participants in a 2013–2016 trial, which randomised 800 food-insecure adults starting HIV treatment at three clinics to receive either usual care (control) or up to 6 months of cash or food transfers (~US$11/month) contingent on timely attendance at monthly clinic appointments. The primary intention-to-treat analysis estimated 24-month and 36-month marginal risk differences (RD) between incentive and control groups for retention in care and all-cause mortality, using multiple imputation for a minority of missing outcomes. We also estimated mortality HRs from time-stratified Cox regression." (abstract)
- "From 3 March 2018 to 19 September 2019, we determined 36-month retention and mortality statuses for 737 (92%) and 700 (88%) participants, respectively. Overall, approximately 660 (83%) participants were in care at 36 months while 43 (5%) had died. There were no differences between groups in retention at 24 months (86.5% intervention vs 84.4% control, RD 2.1, 95% CI −5.2 to 9.3) or 36 months (83.3% vs 77.8%, RD 5.6, –2.7 to 13.8), nor in mortality at either time point. The intervention group had a lower rate of death during the first 18 months (HR 0.27, 95% CI 0.10 to 0.74); mortality was similar thereafter (HR 1.13, 95% CI 0.33 to 3.79).” (abstract).
- Czaicki et al. 2018, a trial comparing food and cash incentives for healthcare appointment visits for HIV-positive adults in Tanzania against standard of care. The study found no difference in intrinsic motivation between groups (as measured by the Treatment Self-Regulation Questionnaire (TSRQ)) at baseline, endline, and approximately six months after the program ended.
- “We analyzed data from 469 individuals randomized to one of three study arms: standard of care, short-term cash transfers, or short-term food assistance. Eligible participants were: 1) ≥18 years old; 2) HIV-infected; 3) food insecure; and 4) initiated antiretroviral therapy (ART) ≤90 days before the study. Food or cash transfers, valued at ~$11 per month and conditional on attending clinic visits, were provided for ≤6 months. Intrinsic motivation was measured at baseline, 6, and 12 months using the autonomous motivation section of the Treatment Self-Regulation Questionnaire (TSRQ). We compared the change in TSRQ score from baseline to 6 and 12 months and the change within study arms." (abstract)
- The mean intrinsic motivation score was 2.79 at baseline (range: 1–3), 2.91 at 6 months (range: 1–3), and 2.95 at 12 months (range: 2–3), which was 6 months after the incentives had ended. Among all patients, the intrinsic motivation score increased by 0.13 points at 6 months (95% CI (0.09, 0.17), Cohen’s d = 0.29) and 0.19 points at 12 months (95% CI (0.14, 0.24), Cohen’s d = 0.49). Intrinsic motivation also increased within each study group at 6 months: 0.15 points in the food arm (95% CI (0.09, 0.21), Cohen’s d = 0.37), 0.11 points in the cash arm (95% CI (0.05, 0.18), Cohen’s d = 0.25), and 0.08 points in the comparison arm (95% CI (-0.03, 0.19), Cohen’s d = 0.21); findings were similar at 12 months. Increases in motivation were statistically similar between arms at 6 and 12 months.” (abstract)
- McCoy et al. 2017, an RCT of ~800 participants estimating the effect of CCTs and food transfers incentivizing antiretroviral therapy adherence in Tanzania. The primary outcome was the percentage of participants who possessed antiretrovirals for over 95% of the time they were tested (medication possession ratio (MPR) ≥95%). It found that the program had a ~22 percentage point effect at the end of the intervention and roughly 20 percentage points six months after that.
- 203
“The M-SIMU study was a cluster-randomized controlled trial conducted in Gem and Rarieda sub-counties, Siaya County, Kenya in 2013-2015. The M-SIMU study evaluated the impact SMS reminders alone or coupled with KES 75 (~US$0.88 in August 2015) or KES 200 (~US $2.35 in August 2015) mobile phone-delivered incentives on vaccination coverage and timeliness. The M-SIMU study enrolled caregivers and infants aged 0-4 weeks from 152 within the Kenya Medical Research Institute (KEMRI) Health and Demographic Surveillance System (HDSS).27 Kagucia 2018 (p. 296)
- 204
“For the three intervention groups, SMS reminders were sent three days and the day before scheduled immunisation visits at ages 6 weeks, 10 weeks, and 14 weeks for the three doses of pentavalent vaccine and age 9 months for measles vaccine using the free and open-source. RapidSMS platform.” Gibson et al. 2017, p. e430
- 205
“In addition to receiving SMS reminders, caregivers were sent either 75 KES (group 3) or 200 KES (group 4) to
their mobile phone for each timely dose of pentavalent and measles vaccine received, defined as vaccination
within 2 weeks of the Expanded Programme on Immunisations (EPI) scheduled date (ie, pentavalent1 at 6 weeks, pentavalent2 and pentavalent3 4 weeks after the previous pentavalent dose, and measles at 9 months).26
Incentives were sent to participant’s mobile phones using a mobile-money programme22 and through their
preferred mobile network (eg, Safaricom, Airtel). Gibson et al. 2017, p. e430 - 206
Gibson et al. 2017, Table 3.
SMS plus 75 KES results for timely measles completion: RR: 1.37 (1.19–1.59)
SMS plus 200 KES results for timely measles completion: RR: 1.42 (1.23–1.63) - 207
"Post-trial follow-up visits were conducted between August 4, 2018 and November 30, 2018. CIs visited 1,467 of 1,599 M-SIMU households (91.7%)." Kagucia 2018 (p. 318)
- 208
“132 M-SIMU households were not visited as funding for the study ended before the households could be visited. Of the households visited, 218 (14.9%) follow-up visits were completed. Follow-up visits were not conducted for the remaining households either because they did not meet MSBC eligibility criteria (n= 1,000; 68.2%) or were lost to follow-up (n= 249; 17.0%). Of 1,000 caregivers not meeting MSBC eligibility criteria, 711 (71.1%) did not have a child born after M-SIMU, 203 (20.3%) had a SC younger than age 10 months, 62 (6.2%) had a SC but were enrolled in the M-SIMI study and 24 (2.4%) did not have an MCH booklet for the SC. " Kagucia 2018 (p. 318)
In total 914 (711 + 203) out of the original 1,599 households were excluded due to lack of an eligible sibling at the time of follow-up. 57% = 914/1,599
- 209
“The primary objective was to assess whether first dose measles containing vaccine (MCV1) timely coverage, i.e., the proportion of children vaccinated at or before age 9 months and 2 weeks (9m+2w) was significantly different among SC of SMS+200KES caregivers compared to SC of Control caregivers.” Kagucia 2018 (p. 289)
- 210
“This translated to 18.1% lower MCV1 timely coverage among SMS+200KES SC compared to Control SC that was not statistically significant (95% CI: -39.3%, 3.1%; p= 0.095)” Kagucia 2018 (p.322)
- 211
“However, in the period after the M-SIMU study, MCV1 timely coverage was significantly lower by 21.7% among children whose caregivers were previously enrolled in the M-SIMU SMS+75KES arm compared to those whose caregivers were in the M-SIMU Control arm (95% CI: -41.9%, -1.6%; p= 0.035).” Kagucia 2018 (p.322)
- 212
With a sample size of 1,278 households in the follow-up, the study estimates that it would have been powered to detect an absolute difference of ≥18% in MCV1 timely completion rates between the SMS+200KES and control group included. The follow-up ended up only including 218 households, so we expect that it was underpowered for even fairly large effect sizes above 18%. We have not vetted the original power calculations or calculated power calculations with the smaller sample size.
“We also estimated the effect size able to be detected with a sample size of 1,278. In the effect size estimation we assumed: a type 1 error (alpha) of 5%; power (1-beta) of 80%; 50.8% measles coverage among SC of M-SIMU Control arm caregivers at age 9m+2w (data from M-SIMU); at least 157 SC enrolled per M-SIMU caregiver study arm; 38 clusters (villages) per M-SIMU caregiver study arm; an average cluster size of four SC; and a coefficient of variation (CV) equal to 0.089 which was the CV observed in the M-SIMU study.6 Based on these assumptions and accounting for clustering, the study was powered to detect an absolute difference of ≥18% in the proportion of SC born to M-SIMU SMS+200KES arm caregivers receiving MCV1 by age 9m+2w (the primary objective’s time cutoff) compared to those of M-SIMU Control arm caregivers.” Kagucia 2018, p. 306. - 213
“Compared to Control SC, MCV1 overall coverage was 20.8% lower and 6.2% lower among SMS+200KES SC and SMS only SC, respectively, however these differences were not significant (SMS+200KES aRD 95% CI: -42.1%, 0.6%; p= 0.057 and SMS only aRD 95% CI: -22.2%, 9.8%: p= 0.451). MCV1 overall coverage was significantly lower by 18.4% among SMS+75KES SC compared to Control SC (aRD 95% CI: -36.2%, -0.5%; p= 0.044)” Kagucia 2018 (p.291)
- 214
"The total M-SIMU sub-sample included in the MSBC study represented 13.6% (218/1599) of the entire M-SIMU sample and 12.2% (44/360), 15.5% (60/388) 12.6% (56/445) and 14.3% (58/406) of households enrolled in the M-SIMU Control arm, SMS only arm, SMS+75KES arm and SMS+200KES arm, respectively" Kagucia 2018, p. 318.
- 215
During the original trial, the subset of control group households later included in the follow-up reported higher MCV1 coverage compared to the overall control group. "In addition, we observed that MCV1 timely coverage in the sub sample of M-SIMU Control children included in the MSBC study was substantially greater than coverage among all Control M-SIMU children” (Kagucia 2018, pp. 334-335)
- 216
"we observed that [...] MCV1 timely and overall coverage in the sub-sample of SMS+75KES M-SIMU children included in the MSBC study were substantially lower than among all SMS+75KES M-SIMU children.” (Kagucia 2018, pp. 334-335)
- 217
As far as we could tell, Kagucia 2018 does not run significance tests on the differences in vaccine-seeking behavior in the follow-up groups compared to the broader cohort in the original study.
- 218
“In comparing M-SIMU baseline characteristics across M-SIMU study arm of the sub-sample included in the MSBC study, there were no statistically significant differences in the distribution of M-SIMU child’s sex, location of delivery for the M-SIMU child, maternal education, maternal age, travel time to a health facility, region of residence or socioeconomic quintile. However, phone ownership at the start of the M-SIMU study was not equally distributed in this sub-sample; 52.3% (n= 23) of Control arm caregivers owned a phone at the beginning of the M-SIMU study compared to 45.0% (n= 27) of SMS only arm caregivers, 26.8% (n= 15) of SMS+75KES arm caregivers and 33.9% (n= 20) of SMS+200KES arm caregivers (p= 0.040; Table 5.5). Because of this imbalance, regression analyses were adjusted for mobile phone ownership status at the start of M-SIMU.” (Kagucia 2018, pp. 320-321)
- 219
“MCV1 timely coverage was 11.2% lower among children of SMS only caregivers after the MSIMU study compared to during the M-SIMU study, although this difference did not achieve statistical significance (adjusted DID -11.2%; 95% CI: -36.1%, 13.7%; p= 0.376). This decrease translated to a statistically insignificant difference of 11.5% in MCV1 timely coverage among SMS only SC compared to Control SC (95% CI: -32.8%, 9.8%; p= 0.290). Crude and adjusted RR and RD estimates did not differ markedly (Figure 5.4).” (Kagucia 2018, p. 323)
- 220
More on these aspects of New Incentives' work here and here on our separate page about New Incentives' program.
- 221
For example,
- New Incentives’ other program activities could mitigate negative effects by improving caregivers' knowledge of vaccinations, thus leading them to complete more vaccinations after the program ends.
- On the other hand, removing other services alongside CCTs could lead to larger negative effects by reducing caregivers’ ability to access vaccinations or acting as a signal that vaccination is less valuable.
- 222
We assigned a 15% overall weight to Kagucia 2018. (See these cells of our analysis.) Within this study, we put somewhat more weight on the 200KES arm (10% out of the 15%) because we think the higher incentive amount is more representative of New Incentives' program. Details below:
In February 2024, New Incentives estimated that the average naira:USD exchange rate it would receive in 2024 would be 1,250 naira per 1 USD. Source: New Incentives, Summary of Funding Gap Estimates (unpublished). This implies an incentive of $1.47 USD on average per caregiver visit (although note that in New Incentives' program, almost half of the total value of the incentives is provided for completion of all six vaccination visits).- 11,000 naira total incentive / 1,250 naira per USD = $8.80 USD.
- $8.80 USD / 6 visits = $1.47 USD incentive per visit, on average.
As of August 1st 2024, the KES:USD exchange rate is 157 KES per 1 USD. Source: this page. This implies an incentive of $1.27 per timely vaccine completed in the SMS+200KES arm and an incentive of $0.48 per timely vaccine completed in the SMS+75KES arm.
- 200 KES incentive per timely vaccine completed / 157 KES per USD = $1.27 USD.
- 75 KES incentive per timely vaccine completed / 157 KES per USD = $0.48 USD.
- 223
“Fourth, the incentive implementation mimicked that of a real program at scale: government health workers distributed the bracelets as part of routine immunization days at clinics, and the incentive was implemented at a large scale, reaching more than 35,000 children and for a prolonged time of two years.” Karing, Finetti, and Kuloszewski 2024 (p. 8)
- 224
“Karing (2024) tested the effects of social signaling incentives–in the form of color-coded bracelets–given to children when they came timely for immunization. A total of 120 government clinics were randomized into four groups. [...] The bracelets were implemented for two years from July 2016 to August 2018. Health workers were trained to give bracelets to children when they came to the clinic according to the design rules of each treatment.” Karing, Finetti, and Kuloszewski 2024 (pp. 7-8)
- 225
"All three treatment groups included an initiation bracelet given to children upon the first vaccine visit. Since 99.7% of parents in this context initiate vaccination, the first bracelet does not carry any signaling value and primarily functions as a small material reward.”
- ‘The first treatment consisted solely of the initiation bracelet: children received a bracelet of their chosen color between yellow and green at their first vaccination visit, replaced by a same identical bracelet at vaccines four and five. We refer to this treatment as the “Initiation Reward”.’
- ‘The second treatment included an additional incentive: the initiation bracelet set for all as the yellow bracelet was exchanged for a green one at the fourth vaccine if completed on time. While informative about one’s vaccine status, parents assign little importance to the fourth vaccine and do not gain social benefit from signaling its timely completion. Instead, its value comes from clinic staff potentially praising the parent and the novelty of receiving a different bracelet color. We refer to it as the “Double Reward”.’
- ‘The third treatment consisted in exchanging the yellow initiation bracelet for a green one at the last vaccine if all vaccines are completed on time. The green bracelet received at the fifth visit, perceived by parents as one of the most important vaccine, was a strong signal of parents’ intrinsic motivation to care for their child’s health. We refer to it as the “Signaling Reward”. If the child came late in either the Double or Signaling Reward treatments, the bracelet was replaced by the same identical yellow bracelet.”’
Karing, Finetti, and Kuloszewski 2024 (pp. 7-8)
- 226
"The third treatment consisted in exchanging the yellow initiation bracelet for a green one at the last vaccine if all vaccines are completed on time. The green bracelet received at the fifth visit, perceived by parents as one of the most important vaccine, was a strong signal of parents’ intrinsic motivation to care for their child’s health. We refer to it as the “Signaling Reward”. If the child came late in either the Double or Signaling Reward treatments, the bracelet was replaced by the same identical yellow bracelet.”
Karing, Finetti, and Kuloszewski 2024 (pp. 7-8) - 227
“Compared to the Control Group, signaling treatments combined lead to an increase in timely vaccination rates for four vaccines, from 74 to 80% (p=0.069), and for five vaccines, from 57 to 63% (p=0.082). The average effects mask substantial heterogeneity by treatment: Signal at 4 has a small, insignificant effect on the share of children receiving timely vaccinations for four vaccines (2 percentage points, p=0.58), and has no impact on the timely completion of five vaccines. In contrast, Signal at 5 has a large effect on the share of children receiving timely vaccinations for five vaccines (13.3 percentage points, p=0.001). This effect remains large and significant (10.5 percentage points, p=0.004) when comparing Signal at 5 to the Uninformative Bracelet, suggesting social signaling is the primary mechanism.“ Karing 2024, p. 4
We estimate the change in the number of timely vaccines received by calculating the average total number of additional timely vaccines completed in the Signal at 5 group / the average total number of timely vaccines completed in the control group. 0.0868 = 0.351 / 4.042
Karing 2024, Table IV, p. 43 - 228
“We conducted a follow-up survey in the 597 communities of the original study between December 2020 and August 2021. In this survey, we list all children born and living in these communities since the experiment ended… A total of 19,318 children were identified as eligible for inclusion in our study sample. Eligibility was defined by being born after December 1, 2017 and attending one of the 119 study clinics for immunizations.” Karing, Finetti, and Kuloszewski 2024 (p. 9)
- 229
“To assess the extent to which the incentives influence parents’ intrinsic motivation, we examine whether direct exposure to the incentives during the experiment affects parents’ vaccination decisions post-experiment, compared to parents who were only indirectly exposed to the incentives. As incentives were tied to timely vaccination, our primary outcome is the total number of vaccines completed on time.” Karing, Finetti, and Kuloszewski 2024 (p. 3)
“Timely vaccination is defined in the same way as in the paper Karing (2024). The timeliness cut-offs are informed by WHO guidelines stating that the DTP series should be completed by six months of age (WHO 2018). There is no strict guidelines for the measles vaccine, but we use the same definition allowing for a 2.5 months buffer window for each vaccine.” Karing, Finetti, and Kuloszewski 2024 (footnote 5 on p. 12) - 230
"parents who had a child during the experiment and were thus directly exposed to the bracelet incentives in the Initiation and Double Reward treatments complete 5% (p=0.05) and 11% (p<0.001) fewer vaccines on time, respectively, compared to parents in the Control group who had a child during the experiment. The Signaling Reward shows less pronounced and insignificant negative effects (-3%, p=0.29)." Karing, Finetti, and Kuloszewski 2024 (p. 12).
- 231
“Our analysis shows that direct exposure to extrinsic incentives diminishes parents’ motivation to vaccinate subsequent children on time. These effects are common across all three incentives treatment, but vary in magnitude and significance. Specifically, parents who had a child during the experiment and were therefore directly exposed to bracelet incentives in the Initiation and Double Reward treatments complete 5% (p=0.05) and 11% (p<0.001) fewer vaccines on time, respectively, compared to parents in the Control group who had a child during the experiment.” Karing, Finetti, and Kuloszewski 2024 (p. 12)
- 232
The authors hypothesize that these bracelets did not have any signaling value because parents do not get any social benefits from signaling completion of the incentivized visits. “All treatments included an initiation bracelet given to children at the first vaccination visit. Since 99.7% of parents in this context initiate vaccination, the first bracelet does not carry any signaling value and mainly functions as a small material reward. The first treatment consisted solely of the initiation bracelet and we refer to it as Initiation Reward. The second treatment included an additional incentive: the initiation bracelet was exchanged for a new color at the fourth vaccine if completed on time. While informative about one’s vaccine status, parents assign little importance to the fourth vaccine and do not gain social benefit from signaling its timely completion. Instead, its value comes from clinic staff potentially praising the parent and the novelty of receiving a different bracelet color. We refer to it as Double Reward.” Karing, Finetti, and Kuloszewski 2024 (p. 4).
- 233
“The Initiation and Double Reward treatments did not show positive effects during their implementation.” Karing, Finetti, and Kuloszewski 2024 (p. 4).
- 234
“The Signaling Reward shows less pronounced and insignificant negative effects (-3%, p=0.29).” Karing, Finetti, and Kuloszewski 2024 (p. 12)
- 235
“The third treatment consisted of the exchange of the initiation bracelet at the last vaccine if all vaccines were completed on time. Owning the second bracelet is considered a significant indicator of a parent’s care for their child’s health because parents regard the last visit as one of the most important ones. We refer to it as a Signaling Reward.” Karing, Finetti, and Kuloszewski 2024 (p. 3)
- 236
The authors hypothesize that the signaling bracelets focused caregiver attention on the intrinsic reasons for vaccinating their children because caregivers perceived the last visit as one of the most important. Thus, receiving an incentive tied to completion of the last visit may have emphasized their care for their child’s health. By contrast, the bracelets provided in the other arms may have focused attention on external reasons for vaccination and crowded out intrinsic motivation.
- “We hypothesize that in the Signaling Reward, parents’ attention was focused on showing their intrinsic motivation to others via the signal, which mitigated the crowd-out effect. This suggests that incentives that allow parents to focus on the reason they take the action may counteract the crowding-out of intrinsic motivation.” Karing, Finetti, and Kuloszewski 2024 (p. 13)
- 237
“Conversely, parents who were only indirectly exposed to the incentives do not show this decline, suggesting that the adverse effects are driven by the direct experience of receiving the incentive, rather than community-level factors such as changes in clinic staff’s behavior or shifts in community vaccination norms. Table IV (Panel B, column 1) displays the results for indirectly exposed parents, indicating minimal effects of incentive treatments on the total number of vaccines received on time: coefficients hover around zero (-0.14 to 0.002) and are insignificant (p=0.14-0.98).” Karing, Finetti, and Kuloszewski 2024 (pp. 12-13)
- 238
The study authors confirmed this in an email to GiveWell, September 6, 2024 (unpublished).
- 239
“We conducted a follow-up survey in the 597 communities of the original study between December 2020 and August 2021. In this survey, we list all children born and living in these communities since the experiment ended. Our methodology mirrored that of the original study. The survey included questions about each child’s vaccination history, ownership of a bracelet, awareness of the bracelet program, and exposure to other incen-tives for immunization. To confirm whether parents had previously been exposed to the program, we asked how long they had lived in the community and if they had a newborn between 2016 and 2018. A total of 19,318 children were identified as eligible for inclusion in our study sample. Eligibility was defined by being born after December 1, 2017 and attending one of the 119 study clinics for immunizations.3 Of these, 11,235 children were alive at the time of the survey, old enough to have completed all vaccinations, and their primary caregiver resided in one of the study communities, making it possible for us to collect their immunization data.” Karing, Finetti, and Kuloszewski 2024 (p. 9)
- 240
"Tables II and III detail socio-demographic characteristics of parents who were directly exposed to incentives and those who were not directly exposed, respectively. The former sample is well balanced across all indicators with the exception of a significant but small imbalance on the birth order of children. Double Reward parents have 5% (p0.08) and 2% (p=0.09) fewer children on average than those in the Control group and Signaling Reward, respectively." Karing, Finetti, and Kuloszewski 2024 (pp. 9-10)
- 241
“Tables I, II and III displays characteristics and attrition for our main analysis sample. Table I shows consistent survey success rates across control and treatment groups, ranging from 66.3 to 72.9% (F= 1.09, p=0.36). The primary reasons for attrition include that parents have moved (14%), the child is deceased (8%), and that parents were traveling at the time of the survey (7.9%). Notably, the attrition rates and their cause do not differ significantly between the control and incentive groups.” Karing, Finetti, and Kuloszewski 2024 (p. 9)
- 242
We think it’s likely that caregivers may misremember or forget their children’s vaccination status over time. In particular, caregivers who participated in an intervention aimed at improving vaccination coverage may be more likely to overreport completed vaccinations compared to control groups.
In unpublished slides shared with GiveWell, the researchers who conducted Karing, Finnetti, Kuloszewski 2024 reported that they verified vaccination status using “in-person survey using information from the child’s growth card when available (95%), and from the parent’s recall otherwise.” We think this largely eliminates concerns about recall bias because the majority of vaccine verification did not rely on participants' memory. - 243
We think the incentives provided by New Incentives increase vaccination uptake by offsetting the time and transportation costs required for caregivers to bring children in for immunizations. Caregivers may perceive the incentives as stipends which support their decision to vaccinate their children.
- 244
We put 25% weight on Karing, Finetti, and Kuloszewski 2024 overall. Within this study, we allocate slightly less weight (5% out of the 25%) to the arm where the bracelets appeared to have a social signaling value ("Signaling Reward"). We think the bracelets offered in the other two treatment arms are more similar to receiving a financial incentive, so we put 10% weight on each.
- 245
- Kagucia 2018 is a follow-up study of Gibson et al 2017, which incentivized timely completion of four vaccines:
- "In addition to receiving SMS reminders, caregivers were sent either 75 KES (group 3) or 200 KES (group 4) to their mobile phone for each timely dose of pentavalent and measles vaccine received, defined as vaccination within 2 weeks of the Expanded Programme on Immunisations (EPI) scheduled date"
- Karing, Finetti, and Kuloszewski 2024 followed up on Karing 2024, which incentivized timely completion of the fourth or fifth vaccine:
- "In each of the first two bracelet treatments—hereafter Signal at 4 and Signal at 5 - children receive a yellow bracelet upon their first vaccination. In the Signal at 4 treatment, the yellow bracelet is exchanged for a green bracelet once a child completes all of the first four vaccines in a timely manner. In clinics assigned to the Signal at 5 treatment, the nurse exchanges the yellow bracelet for a green bracelet once a child completes all five vaccinations in a timely manner." (pp. 3-4).
- Kagucia 2018 is a follow-up study of Gibson et al 2017, which incentivized timely completion of four vaccines:
- 246
In order to be eligible for enrollment into New Incentives’ program, infants need to be under 1 year old; so this means very delayed vaccinations would not be incentivized in practice. For more details on the eligibility criteria New Incentives uses for disbursing CCTs, see this section of our report on New Incentives' program.
- 247
“Compared to Control SC, MCV1 overall coverage was 20.8% lower and 6.2% lower among SMS+200KES SC and SMS only SC, respectively, however these differences were not significant (SMS+200KES aRD 95% CI: -42.1%, 0.6%; p= 0.057 and SMS only aRD 95% CI: -22.2%, 9.8%: p= 0.451). MCV1 overall coverage was significantly lower by 18.4% among SMS+75KES SC compared to Control SC (aRD 95% CI: -36.2%, -0.5%; p= 0.044)” Kagucia 2018 (p.291)
- 248
Kagucia 2018 found large reductions in MCV1 coverage at 12 months similar in direction and magnitude to the primary results on timely completion.
- “The absolute decrease in MCV1 overall coverage among SMS+200KES arm SC compared to Control SC was 20.8% and was not statistically significant (aRD 95% CI: -42.1%, 0.6%; p= 0.057).”
- “But SMS+75KES SC had significantly lower MCV1 overall coverage than Control SC in the period after the M-SIMU study (aRD 18.4%, 95% CI: -36.2%, -0.5%, p= 0.044).”
(Kagucia 2018, pp. 324-325)
Karing, Finetti, and Kuloszewski 2024 found no statistically significant reductions in completion at 15 months in any treatment arm, in contrast to the significant reduction they found in the Initiation and Double Rewards groups. “We then examine the completion of all vaccines by 15 months, which is the due date for the second measles dose and the next milestone in the immunization schedule. Panel A of Table V reveals that direct exposure to incentives does not have a pronounced effect on the completion of vaccinations by 15 months. The coefficients on the total number of vaccines received in the Initiation and Double Reward treatments are negative but insignificant at -0.12 (p=0.22) and -0.075 (p=0.55).” Karing, Finetti, and Kuloszewski 2024 (pp. 13-14)
- 249
“Compared to Control SC, MCV1 overall coverage was 20.8% lower and 6.2% lower among SMS+200KES SC and SMS only SC, respectively, however these differences were not significant (SMS+200KES aRD 95% CI: -42.1%, 0.6%; p= 0.057 and SMS only aRD 95% CI: -22.2%, 9.8%: p= 0.451). MCV1 overall coverage was significantly lower by 18.4% among SMS+75KES SC compared to Control SC (aRD 95% CI: -36.2%, -0.5%; p= 0.044)” Kagucia 2018 (p.291)
- 250
The study authors confirmed this in an email to GiveWell, September 6, 2024 (unpublished).
- 251
In the original M-SIMU trial, control group coverage for all vaccines included in the study (BCG, 3 doses of the polio vaccine, 3 doses of the pentavalent vaccine) except measles was at least 97% at 12 months. “With the exception of MCV, vaccination coverage in the control arm for most vaccines at age 12 months was high, ranging from 97% (Polio3) to 98% (Penta3). MCV1 coverage at age 12 months was 84%.” (Kagucia 2018, p. 58)
In the original bracelets study (Karing 2024), control group coverage for all vaccines except measles was at least 90% at 12 months. “Almost all children in the Control Group receive the first three vaccines by 12 months, with completion rates at 99.3, 98.4 and 95.9%. Despite this, a substantial drop-off remains for the fourth and fifth vaccines, with only 91.7% and 68.6% of children, respectively, receiving these vaccines by one year of age.” (Karing 2024, p. 23)
In states where New Incentives operates at the time of writing, we estimate that vaccination coverage excluding the measles vaccine ranges between 14% to 72%, with an average Penta3 completion rate of 33% at baseline. See these cells in our CEA.
- 252
“The context of childhood immunization in Sierra Leone offers a relevant policy application to the question of motivation crowd-out. With vaccination rates nearing the levels necessary to reach herd immunity, policy makers face the challenge of increasing take-up among the “last mile” parents without undermining the majority who are already vaccinating. Further, in this setting, routine vaccination is a well-known health behavior for which individuals have established beliefs about its costs and benefits.” Karing, Finetti, and Kuloszewski 2024 (pp. 2-3).
- 253
Email from New Incentives, August 16, 2024 (unpublished).
Our understanding is that Joint State Stakeholder Meetings are roundtables with health officials and other stakeholders in the states where New Incentives operates. See this section of our separate report on New Incentives' program. - 254
To calculate the hypothetical exit year, we estimate the year that the marginal program cost-effectiveness will fall below 8x (our current bar for funding top charities). For our calculations, see here.
Our approach:- We start with baseline coverage during the midpoint of the current grant period and project forward counterfactual coverage using our assumption that non-vaccination rates fall by 5% each year. For more on this, see this section of the report.
- We estimate that New Incentives’ program causes a 29% reduction in the unvaccinated rate each year. For more on this, see this section of the report.
- We assume the program receives a hypothetical $1 million grant each year and that cost per child enrolled remains the same over time (roughly $18 per child). We discount the value of the program per counterfactually vaccinated child by .5% in each subsequent year. These are simplifying assumptions.
- Over time, we expect cost per child will decrease somewhat based on historical declines (see this row of our analysis of New Incentives' cost per infant enrolled), but we are unsure whether and how much it will continue to decline.
- We apply a 0.5% discount rate for the future value of the program, consistent with the approach used elsewhere in this report to estimate the value of vaccination on future mortality risk.This potentially understates the actual decline in benefits over time for children who are counterfactually vaccinated by the program, e.g., because of other general health improvements which could reduce the spread and deadliness of vaccine-preventable diseases, and thus the benefits of vaccination.
- We assume the overestimated cost per child and underestimated decline in program benefits over time roughly cancel each other out, but this could mean we are over or underestimating the future cost-effectiveness of the program.
- We estimate cost-effectiveness each year until the value falls below 8x.
- 255
We assume that caregivers will have 5 children in total on average based on the total fertility rate in Nigeria estimated by the World Bank for 2022 (5.1 total births per woman).
- We expect the total fertility rate will decline somewhat over time, and that fertility rates are slightly higher in northern Nigeria. We think these two effects roughly cancel each other out, so we have not made any adjustments to the fertility rate for future periods in northern Nigeria.
- 256
We estimate that only caregivers of children enrolled in the last 5 years of the program will have at least one additional child who needs to be vaccinated after the program ends. In simple terms, this is because we think children enrolled earlier during the program implementation period are less likely to have younger siblings who need to be vaccinated after the program ends.
- We assume that caregivers will have roughly 5 children in total based on the World Bank's estimated fertility rate of (5.1) for Nigeria in 2022.
- As a simplification, we assume caregivers are reached by New Incentives halfway through their childbearing years and will have 2 additional children after the first child enrolled.
- Furthermore, we assume that children will be born ~2.5 years apart based on median birth intervals reported in DHS18 data, and do not adjust for potential changes in birth spacing over time. In expectation, this means that:
- The fourth (second to last) child will be born 2.5 years after the child enrolled in New Incentives' program.
- The fifth (last) child will be born 5 years after the child enrolled in New Incentives' program.
- Therefore, only children enrolled in the last 2.5 years of the program are likely to have at least 2 additional siblings who need to be vaccinated post-program; and only children enrolled in the last 5 years of the program are likely to have at least 1 additional sibling who needs to be vaccinated post-program.
We also assume that some of the children in New Incentives’ program are younger siblings of previously enrolled children. The post-program siblings of these children would be double-counted, so we make rough adjustments to estimate the number of caregivers represented.
- For children enrolled in the last 5 years of the program, we roughly guess that 20% of them are siblings of other children enrolled in the same period. We use a slightly smaller value for children enrolled in the last 3 years of the program (10%) because we expect the share of siblings to decrease as program duration shortens.
- For children enrolled in the last 2.5 years of the program, we roughly guess that 10% of them are siblings of other children enrolled in the same period.
In Niger, for example, where we estimate that the program would be implemented for three years with roughly 165,000children enrolled over that period of time, we expect:
- (3/3) * (100-10)% = ~90% of children enrolled during the program implementation period to have at least one sibling who needs to be vaccinated post-program. This is equal to roughly 148,000 siblings .
- (2.5/3) * (100-10)% = ~75% of children enrolled during the program implementation period to have at least two siblings who need to be vaccinated post-program. This is equal to roughly 124,000 siblings.
- 257
“Conversely, parents who were only indirectly exposed to the incentives do not show this decline, suggesting that the adverse effects are driven by the direct experience of receiving the incentive, rather than community-level factors such as changes in clinic staff’s behavior or shifts in community vaccination norms. Table IV (Panel B, column 1) displays the results for indirectly exposed parents, indicating minimal effects of incentive treatments on the total number of vaccines received on time: coefficients hover around zero (-0.14 to 0.002) and are insignificant (p=0.14-0.98).” Karing, Finetti, and Kuloszewski 2024 (pp. 12-13)
- 258
We estimate the counterfactual vaccination rate for siblings using the counterfactual vaccination rate estimated in the hypothetical exit year (see this row of our analysis). This may underestimate the vaccination rate for siblings who are born further out from the program withdrawal year because we expect counterfactual vaccination rates to increase over time. For example, if we expect the program to exit in 2027, we would expect siblings who are born in 2029 to have somewhat higher counterfactual vaccination rates.
- 259
We estimate the number of children harmed by multiplying the number of siblings * their counterfactual vaccination rate * the expected decrease in vaccination coverage.
- 260
- Kagucia 2018 specified M-SIMU caregivers were eligible to be included in the follow-up only if they had an immediate younger sibling aged at least 10 months: “M-SIMU caregivers were eligible to enroll in the MSBC study if: the vaccination status of the child enrolled in the M-SIMU (M-SIMU child) study was verified using the maternal and child health (MCH) booklet at age 12 months; the M-SIMU child had an immediate younger sibling (i.e., subsequent born child) aged at least 10 months old; and the vaccination status of the subsequent child (SC) could be verified via MCH booklet.” Kagucia 2018 (p. 297)
- We are less sure in the case of Karing, Finetti, and Kuloszewski 2024, but we think it’s likely that the follow-up predominantly included only the next subsequent sibling because the follow-up was conducted relatively soon after the program ended (1-3 years), and subsequent children in the follow-up study were only included if they were at least 12 months of age. We think it’s very unlikely that many caregivers will have had more than one additional child in this time frame.
- “The bracelets were implemented for two years from July 2016 to August 2018.” Karing, Finetti, and Kuloszewski 2024 (p. 8)
- In the follow-up: “We include children born after May 1, 2019, who were at least 12 months old by the time last observed.” Table IV (p. 26) Karing, Finetti, and Kuloszewski 2024
- 261
See this row of our analysis.
- 262
We estimate a -30% adjustment in Taraba state. Prior to applying an adjustment, our estimate of cost-effectiveness in Taraba was around 8.5x.
- To see the program’s cost-effectiveness prior to post-program effects, set the adjustment in this cell to zero.
We think the adjustment is especially high for two reasons:
- Baseline vaccination rates in Taraba (we estimate 74%) are high relative to the other locations we modeled (63% in Yobe, and 61% in Niger), so we expect fewer children to benefit each year the program is running.
- We expect the program would only run for two years prior to falling below our cost-effectiveness bar (8x), so fewer total children benefit over the duration of the program,
- 263
I.e. (-15% + -32% + -11%) / 3. We don’t include Niger - cohort 32 in our average because Niger state is already captured in the average.
- 264
In general, we expect the adjustment would be somewhat larger in areas where vaccination rates are higher at the start of the program, and thus, where the program would likely operate for a shorter period of time.
- If an area has higher vaccination rates at the start of a program, we expect to fund the program for fewer years. This is because cost-effectiveness is generally lower in areas where the vaccination rates are high at the start of the program, and we expect cost-effectiveness to decline over time as counterfactual vaccination rates generally improve.#
- A shorter program duration means fewer children are vaccinated during the program relative to the number who don't get vaccinated after the program (assuming that a longer program duration does not meaningfully increase the size of the negative post-program effects). This would result in a larger negative adjustment.
However, in locations where vaccination rates are higher, it is possible that post-program effects would differ for other reasons. For example, there may be stronger social norms around vaccinations, which could mitigate negative effects.
- 265
As of August 2024, this is Bauchi, Gombe, Jigawa, Kaduna - cohort 17, Kano, Katsina, Kebbi, Sokoto, and Zamfara.
- 266
We estimate the total hypothetical implementation duration using a similar approach to what is outlined above for Niger. See this worksheet for our calculations.
- 267
We estimate the impact of post-program effects over the total hypothetical implementation duration using a similar approach to what is outlined above for Niger (i.e. we estimate when the program would fall below 8x, and calculate the relative number of children vaccinated because of the program during and after). We estimate that the post-program effects adjustment would be roughly -3% to -14% in these areas if the program operated for the full hypothetical program duration.
- As a simplification, we use 2024 as the starting year of the program. We expect this to overestimate the adjustment in locations where New Incentives started operating prior to 2024 because the adjustment does not capture the children counterfactually vaccinated by the program in the earlier years.
If the program were to withdraw sooner, we would expect the post-program effects adjustment to be larger. For example, in Bauchi, we estimate that for every 100 children counterfactually vaccinated by the program over 16 years, 6 children would not be vaccinated after the program. If, however, the program only operated from 3 years (assuming the program started in 2024), we expect 15 children to be counterfactually not vaccinated after the program (set this value to 3).
- 268
To estimate the adjustment with 10 additional operating years, set the hypothetical program duration in this row to 10.
- 269
This is because we think they would be challenging to model effectively or their likely effect is small enough that we do not expect explicit modeling to be worth the time investment required.
- 270
See this row of our cost-effectiveness analysis.
- 271
In our cost-effectiveness analysis, this appears as (mortality and morbidity effects). We have grouped them here for simplicity. Because of rounding, these sum to 4% (3.6% + 0.7%).
- 272
We add each percentage adjustment together to obtain our total adjustment.
- 273
Step one: Estimate the likely size of each effect (a rough subjective best guess).
- Step two: Evaluate each effect using three criteria, each assigned a score of up to 3:
- Can it be objectively justified (i.e., is there direct evidence for the effect)? (Where 0 is little evidence and 3 is strong direct evidence).
- How easy would it be to model? (Where 0 is impossible and 3 is simple).
- Consistency - is this effect included in our cost-effectiveness analysis for other programs? (Where 1 is no, 2 is partially, and 3 is yes).
- Step three: Convert the total three criteria score out of 9 into a percentage (e.g., a total score of 5 converts to a percentage of 50%).
- Step four: Weight our estimate of each effect by this percentage to produce our overall adjustment (e.g., an effect size guess of 15% multiplied by a three criteria score of 60% = an adjustment of 9% (15% * 60% = 9%)).
We use the method described for all supplemental intervention-level adjustments in our cost-effectiveness analysis for this program, with the exception of our estimate of costs saved from averted malaria. We account for these savings using an explicit model, discussed in more detail here.
- Step two: Evaluate each effect using three criteria, each assigned a score of up to 3:
- 274
See this spreadsheet for more details on our reasoning for each adjustment.
- 275
"Vaccination confers both direct and indirect effects. The direct effect implies protection against disease in vaccinated individuals. Indirect protection is when susceptible individuals avoid infection because the people who surround them are immunized. The magnitude of indirect effects is a function of transmissibility of the infectious agent, population mixing patterns, distribution of vaccine, and distribution of immunity in the population. 'Herd immunity' refers to population-scale immunity." Nymark et al. 2017.
- 276
“Herd immunity is usually achieved by interrupting the transmission of the organism by preventing infections in immunized individuals. Thus, there is less opportunity for the unimmunized individual to be exposed to the organism.” Pollard et al. 2015.
- 277
We believe the excluded morbidity effects are likely to be small (no more than 5% of the total DALY burden). This is based on the finding that only a small percent of DALYs is due to years lost to disability (YLDs) for children under 5 (less than 2% of DALYs across all diseases; see here). Excluding these morbidity effects seems consistent with our decision to exclude morbidity from our cost-effectiveness analyses of other interventions primarily aimed at reducing mortality. See here for our DALY analysis.
Definitions:- DALY stands for “disability-adjusted life year.” The Global Burden of Disease Project defines it as: “a universal metric that allows researchers and policymakers to compare very different populations and health conditions across time. DALYs equal the sum of years of life lost (YLLs) and years lived with disability (YLDs). One DALY equals one lost year of healthy life.”
- YLDs (years lived with disability) are years lived in less than ideal health. YLLs are measured by multiplying the prevalence of a health condition by the “disability weight” (how bad it is) of that condition. We use YLDs as a measure of morbidity.
- YLLs (years of life lost) are years lost due to premature mortality. For example, if the longest life expectancy for men in a given country is 75, but a man dies of cancer at 65, this would be 10 years of life lost due to cancer. We use YLLs as a measure of mortality.
Definitions are from the Institute for Health Metrics and Evaluation, "Global Burden of Disease (GBD)".
- 278
Note: in our cost-effectiveness analysis this appears as two rows: (1) mortality (+4%), (2) morbidity (+1%). Because of rounding, together these sum to 4% (3.6% + 0.7%). See here. We have grouped them here for simplicity.
- 279
Yellow fever and acute hepatitis B have a much lower DALY burden for children under five (53 and 69 per 100,000, respectively), relative to other diseases prevented by vaccines (see this column of our supplementary spreadsheet).
For polio, meningitis A, mumps, rubella, and varicella, our impression is that the number of cases are low, but we haven’t attempted to quantify the burden. In our cost-effectiveness analysis, we include a rough guess for additional benefits from effects on these diseases. - 280
As of September 2024, these are the Against Malaria Foundation (AMF), Malaria Consortium, Helen Keller International, and New Incentives. See our "Top charities" page here.
- 281
Our model estimates a 14% upward adjustment for long-lasting insecticidal nets (here), a 20% upward adjustment for seasonal malaria chemoprevention (here) and a 21% upward adjustment for vitamin A supplementation (here). We did not model these benefits for New Incentives, and so the New Incentives figure is benchmarked to the other three programs.
- 282
The RCT found that New Incentives’ program increased the timeliness of the measles vaccine, also increased the timeliness of the Penta 1 vaccine (on some but not all measures), and led to a decrease in timeliness for the BCG vaccine, although this was small and not statistically significant. See IDinsight, Impact evaluation of New Incentives, final report, 2020, Table 8, pg. 30.
“The incentive had the largest impact on the timeliness of the Measles 1 vaccine. Children in the treatment group who received the Measles 1 vaccine were 33 percentage points (95% CI: 28, 38; p-value < 0.001) more likely to have received the vaccination within one month of the recommended age (9 months) compared to those who received the Measles1 vaccine in the control group. Measles 1 vaccinations were also more likely to be timely in the treatment group than in the control group when using a cutoff of within 2 weeks of the recommended age." IDinsight, Impact evaluation of New Incentives, final report, 2020, pg. 30.
- 283
The measles vaccine is recommended at 9 months in high-transmission settings to balance higher efficacy with age (which suggests vaccinating later) with high risk of measles for those unvaccinated (which suggests vaccinating sooner).
“The age at vaccination is one of the most important determinants of the immune response to MCV, with older infants usually showing better responses than younger infants (Figure 4). The optimal age for measles vaccination is determined by consideration of the age-dependent increase in seroconversion rates following measles vaccination and the average age of infection. In regions of intense MV transmission, the average age of infection is low and the optimal strategy is to vaccinate against measles at as young an age as possible (usually 9 months of age, Figure 4). By contrast, in settings where MV transmission has been reduced, the age of administration of the first dose of MCV can be increased to 12 months or older. Antibody responses to MCV increase with age up to around 15 months because of the declining levels of inhibitory maternal antibodies and decreasing immaturity of the immune system. This immaturity of the immune system in neonates and very young infants includes a limited B-cell repertoire and inefficient mechanisms of antigen presentation and T-lymphocyte help. The recommended age at vaccination must balance the risk of primary vaccine failure, which decreases with age, against the risk of MV infection prior to vaccination, which increases with age.” World Health Organization, Immunological basis for immunization series, measles, 2020, pg.13.
As a result, vaccinating too soon may risk lowering vaccine efficacy while vaccinating too late may risk measles infection. We have not sought to vet this claim or quantify this effect, and we include a small adjustment for improved timeliness in our cost-effectiveness analysis.
- 284
See this spreadsheet, "Investment of income increases" rows for each intervention, for details on the specific values used for each program. Note that we have not recently updated these adjustments, and so the variation in values between programs may no longer be accurate. We have not prioritized updating this because it makes a very small difference to our cost-effectiveness estimates.
- 285
- “Most studies indicate that the degree of mucosal immunity in the intestine is significantly less than that provided by OPV, although this difference may be less pronounced in the pharyngeal mucosal lining.” World Health Organization, Standards and specifications, "Poliomyelitis".
- “While IPV elicits a much weaker mucosal immune response than OPV,5 and is thus less effective at averting transmission, it is very protective against disease.” Alfaro-Murillo et al. 2020. Note that we have not reviewed the evidence for this in detail.
- 286
- “In very rare cases, the administration of OPV results in vaccine-associated paralysis associated with a reversion of the vaccine strains to the more neurovirulent profile of wild poliovirus.” World Health Organization, Standards and specifications, "Poliomyelitis".
- A write up on this issue is available here.
- New Incentives may offset this risk through its effect on inactivated polio vaccine (IPV), which may lower risk of outbreak from oral polio vaccines: "Circulating VDPVs occur when routine or supplementary immunization activities (SIAs) are poorly conducted and a population is left susceptible to poliovirus, whether from vaccine-derived or wild poliovirus. Hence, the problem is not with the vaccine itself, but low vaccination coverage. If a population is fully immunized, they will be protected against both vaccine-derived and wild polioviruses." WHO, Poliomyelitis: Vaccine derived polio, 2017.
- 287
“Vaccine-associated paralytic poliomyelitis (VAPP) is a rare adverse event associated with oral poliovirus vaccine (OPV). This review summarizes the epidemiology and provides a global burden estimate… Using all risk estimates, VAPP risk was 4.7 cases per million births (range, 2.4–9.7), leading to a global annual burden estimate of 498 cases (range, 255–1018). If the analysis is limited to estimates from countries that currently use OPV, the VAPP risk is 3.8 cases per million births (range, 2.9–4.7) and a burden of 399 cases (range, 306–490).” Platt et al. 2014. Note that we have not reviewed this evidence in detail.
- 288
"Vaccination with the protein-polysaccharide conjugate vaccine, PCV7, has significantly reduced the burden of pneumococcal disease in populations where it is in widespread use and has had an important public health benefit. This vaccine targets only 7 of the more than 92 pneumococcal serotypes, and there have been concerns that the non-vaccine serotypes (NVTs) could increase in prevalence and reduce the benefits of vaccination." Weinberger, Malley, and Lipsitch 2011, pg. 1.
- 289
- "We currently employ over 2,000 FOs." New Incentives, responses to GiveWell questions, July 5, 2024 (unpublished)
- We discussed qualifications for the Field Officer position on a recent call with New Incentives. New Incentives, conversation with GiveWell, July 9, 2024 (unpublished)
- 290
- New Incentives informed us that as of June 2024, base pay for the Field Officer position was 40% higher than the minimum wage in Nigeria, and that most Field Officers earned more than the base salary through bonuses, employer contributions, and expense buffers. New Incentives, responses to GiveWell questions, July 5, 2024 (unpublished)
- New Incentives does not seem to have difficulty finding applicants for the Field Officer position. "From June 2023 to June 2024, we received approximately 20,000 external applications for the Field Officer position and recruited about 1,300 FOs in all states of operations during that same time period." New Incentives, responses to GiveWell questions, July 5, 2024 (unpublished)
- Note that we have not reviewed New Incentives' compensation policy in detail and do not feel well-placed to judge whether the Field Officer salary is reasonable for the role. Our assumption that the Field Officer role is a decent job opportunity is based largely on the high number of applicants to the role and our assumption that unemployment among this population is fairly high.
- 291
See IDinsight, Impact evaluation of New Incentives, final report, 2020, Table 13, pg. 36: "Outcome: Ever visited clinic… Adjusted OLS results: 0.05 ([95% CI] 0.03, 0.08)"
- 292
We also received feedback from Dr. Jessica Cohen in her review of our report that this could cause us to underestimate impact: “Not including potential benefits of clinic visits for young children (where health concerns can be addressed in addition to the receipt of vaccinations) could cause you to underestimate impact.” Dr. Jessica Cohen, Bruce A. Beal, Robert L. Beal and Alexander S. Beal Associate Professor of Global Health, Comments on GiveWell’s draft New Incentives Report, November 2023 (unpublished).
- 293
"Children who are HIV-infected when vaccinated with BCG at birth are at increased risk of developing disseminated BCG disease. However, if HIV-infected individuals, including children, are receiving ART, are clinically well and immunologically stable (CD4% >25% for children aged <5 years or CD4 count ≥200 if aged >5 years) they should be vaccinated with BCG. In general, populations with high prevalence of HIV infection also have the greatest burden of TB; in such populations the benefits of potentially preventing severe TB through vaccination at birth are outweighed by the risks associated with the use of BCG vaccine. Therefore, it is recommended that in such populations:
- Neonates born to women of unknown HIV status should be vaccinated as the benefits of BCG vaccination outweigh the risks.
- Neonates of unknown HIV status born to HIV infected women should be vaccinated if they have no clinical evidence suggestive of HIV infection, regardless of whether the mother is receiving ART.
- Although evidence is limited, for neonates with HIV infection confirmed by early virological testing, BCG vaccination should be delayed until ART has been started and the infant confirmed to be immunologically stable (CD4 >25%)."
World Health Organization, BCG vaccines: WHO position paper – February 2018, p. 95.
Adverse events linked to BCG vaccination range from mild, localized complications to more serious, systemic or disseminated BCG disease in which M. bovis BCG is confirmed in one or more anatomical sites far from both the site of injection and regional lymph nodes. Disseminated BCG disease is associated with a case-fatality rate of >70% in infants. By comparison, the background mortality rate among South African HIV-infected infants is 12.2 per 100 person-years (95% CI: 8.2–17.4).
Systemic or disseminated BCG disease may be clinically indistinguishable from tuberculosis and can only be confirmed through positive mycobacterial culture species identification, preferably by polymerase chain reaction (PCR) for the RD1 genetic region that is lost during attenuation of BCG" Hesseling et al. 2009.
"Disseminated BCG disease is associated with a case-fatality rate of >70% in infants. . . . [The risk of disseminated BCG disease] has been shown to be 1100 to 4170 per 1 million in HIV-infected infants routinely vaccinated at birth." Hesseling et al. 2009. - 294
"Children who are HIV-infected when vaccinated with BCG at birth are at increased risk of developing disseminated BCG disease. However, if HIV-infected individuals, including children, are receiving ART, are clinically well and immunologically stable (CD4% >25% for children aged <5 years or CD4 count ≥200 if aged >5 years) they should be vaccinated with BCG. In general, populations with high prevalence of HIV infection also have the greatest burden of TB; in such populations the benefits of potentially preventing severe TB through vaccination at birth are outweighed by the risks associated with the use of BCG vaccine. Therefore, it is recommended that in such populations:
- Neonates born to women of unknown HIV status should be vaccinated as the benefits of BCG vaccination outweigh the risks.
- Neonates of unknown HIV status born to HIV infected women should be vaccinated if they have no clinical evidence suggestive of HIV infection, regardless of whether the mother is receiving ART.
- Although evidence is limited, for neonates with HIV infection confirmed by early virological testing, BCG vaccination should be delayed until ART has been started and the infant confirmed to be immunologically stable (CD4 >25%)."
World Health Organization, BCG vaccines: WHO position paper – February 2018, p. 95.
- 295
"HIV PREVALENCE AMONG PERSONS AGE 15-64 YEARS: Zamfara 0.4%, Jigawa 0.3%, Katsina 0.3%" National Agency for the Control of AIDS, "Nigeria Prevalence Rate," 2019.
- 296
"The risk of a reaction at the injection site following certain injected vaccines, such as DTaP (diphtheria, tetanus, and pertussis) or pneumococcal vaccine, increases if the doses are not separated by the recommended amounts of time. In these cases, it is the spacing of the doses, not the number of doses, that creates the risk. These reactions can be unpleasant, but they are not life-threatening." Centers for Disease Control, "Ask CDC - Vaccines & Immunizations".
"We searched VAERS for US reports where an excess dose of vaccine was administered to a person received from 1/1/2007 through 1/26/2018. . . .
More than three-fourths of reports of an excess dose of vaccine did not describe an AHE [adverse health effect]. Among reports where an AHE event was reported, we did not observe any unexpected conditions or clustering of AEs [adverse events]." Moro et al. 2019, abstract. - 297
As of October 2020, New Incentives considered 20% of their partner clinics’ catchment areas to be "high risk." This means one or more cases in which armed violence resulting in death has been recorded near the clinic, but New Incentives judged it to be safe to travel in the area during the day. The assessment was made by New Incentives Security Manager on the basis of information collected from a variety of sources, including field officer (FO) reports. New Incentives, Clinic and settlement security assessments (unpublished)
- 298
"As of 17-June-2020, there have been 23 incidents in total. The cases include those related to minor theft (e.g. phone and sometimes cash), minor injuries (e.g. bruises and scorpion bites), and encounters with bandits." GiveWell, Questions for New Incentives about potential negative and offsetting effects, 2020, p. 1.
- 299
New Incentives, Security Procedures and Status (unpublished), "Incidents Involving Staff" sheet:
Incidents resulting in death:- "Year: 2017; Week: 47; A field staff in [redacted] . . . was involved in a road traffic accident (RTA) as he was traveling on a non-work day from [redacted] after visiting his relative in a hospital there. On his way back from the hospital, his vehicle got into an accident with a lorry, which put him in a critical condition. He was rushed to the hospital but unfortunately he passed away on 22-Nov."
- "Year: 2018; Week: 36. On Tuesday 4/9/18 at about 1:00am armed bandit attacked [redacted], killed two people and kidnapped three people including two children of the district head. Reportedly, the bandit was specifically asking for [routine immunization (RI)] incharge of the clinic, saying that they were informed that the RI incharge and our staff (FV) [Field Volunteer] goes around some of their settlement and sometime in the clinic disbursing cash to some women."
Incidents resulting in injuries:
- "Year: 2018; Week: 29. One of our FVs . . . was involved in a motor accident on his way back from the outreach session. The tyre of the vehicle he boarded bursted and the driver lost control consequently hitting a roadside tree. [The FV] sustained an injury to the shoulder. He is stable presently and will seek further medical attention."
- "Year: 2019; Week: 35. At [redacted], about 4 men armed with dangerous weapons attempted to burgle and rob an NI/ABAE staff residence in [redacted]. The armed youths took about 30 minutes attempting to break the barriers (doors and windows) and attacked neighbours who had responded to the distress calls of the residents of the apartment inflicting various degrees of injuries on the first responders. Upon arrival of security forces, the attackers withdrew from the residence and proceeded to raid at least two nearby houses where they robbed residents of cash and personal effects. Subsequently, members of the community mobilized in their numbers, confronted the robbers causing them to withdraw from the location."
- "Year: 2019; Week: 46. Two of our FOs including the clinic staff assigned (VCHEW) had an accident today on their way back from the outreach session and sustained slight bruises, and in the process [name redacted] broke his phone and right now he is unable to send his data and do the end process for today."
- "Year: 2020; Week: 4. Staff reported; 'On their way back from [redacted], they were involved in an accident. He said on their way back they were involved in an accident together with the RI staff, falling on a stone and sustaining injuries and a crack to his phone screen; though phone still remains functional."
- "Year: 2020; Week: 25. FO was involved in a RTA. Someone with a car hit FO on a commercial bike and as a result FO's office phone got lost. FO sustained a minor injury on his right leg and was treated in a hospital. The person responsible for the accident has gone ahead to replace FOs phone."
- 300
We last asked New Incentives for detailed information on its procedures in 2020. New Incentives has also shared a log of security monitoring activities, communications of security findings to staff, and security training for staff. GiveWelly lightly reviewed weeks 17-21 of 2021 and found that security processes were reported to have taken place as expected. We have not conducted a more detailed review since that time. See this section of our New Incentives monitoring analysis.
- 301
- Collecting information about potential security threats and communicating with staff about threats. Information about security incidents is sourced on an ongoing basis by field officers (FOs), as well as by New Incentives' Security Manager and Security Focal Point. New Incentives has shared a list of these incidents with us. The list included an average of 40 reports per month from June 2019 (when this logging system was introduced) to October 2020 (the date of our review); it was up to date at the time of our review. We spot-checked records for 50 incidents: for all of them, it was indicated whether further steps should be taken to mitigate the risk and, if so, what action had been taken. When an ongoing and urgent threat is identified, the Security Manager directly contacts relevant FOs. To communicate less-urgent security information, the Security Manager compiles weekly summaries, which are circulated to managers, who share them with FOs. At times, New Incentives designates high-risk areas as "no go" and prevents FOs from creating work plans or submitting expenses for these areas in the app used for this purpose. We have seen the Security Manager's weekly reports for five weeks in 2020; these reports describe the process used to identify threats and designate areas as "no go."
- Training staff to avoid security threats where possible and address them where necessary. The onboarding process for New Incentives staff members includes a UN safety training course and a training course on New Incentives' internal security procedures. Ongoing monthly training is also provided, covering topics including road safety and abduction and kidnapping. We have seen the Security Manager's weekly reports on onboarding training for five weeks in 2020.
Sources:
- FOs collect information on a rolling basis through drivers (while traveling to the clinic), town criers, and community members (during outreach sessions). When a clinic is marked as "high risk," FOs reach out to clinic staff and community members (for outreach sessions) the day before an immunization day to collect information about security threats. If the FO determines there is reason for concern, they have the option of not joining the outreach session. Svetha Janumpalli, Founder and CEO, and Pratyush Agarwal, Co-founder and COO, New Incentives, conversations with GiveWell, March 25-27, 2020 (unpublished).
- The Security Manager collects information from security industry networks and media on a rolling basis. The Security Focal Point makes calls to local government authorities every two weeks to collect information about security threats. Svetha Janumpalli, Founder and CEO, and Pratyush Agarwal, Co-founder and COO, New Incentives, conversations with GiveWell, March 25-27, 2020 (unpublished).
- "SM and SFP: Verifies all security reports received through myDay to ensure that these are true incident.Verifications entails - Reach out to our key sources of information (community stakeholders, security forces, security networks, staff, sister NGO security units) - Triangulation of information from more than one source - Consideration of the authenticity of each source." New Incentives, Security Procedures and Status (unpublished), "Security Procedures and Status" sheet, cell C26
- "The security incidents are compiled into reports sent internally every week" New Incentives, Overview of NI-ABAE Anti-Bribery and Security Policies, p. 2.
- "SFP: To collate and send out all security notifications to NC, SRD, SFMs, SM, COO, and external members" New Incentives, Security Procedures and Status (unpublished), "Security Procedures and Status" sheet, cell C14.
- "SM: Reviews the Security Incident Review sheet to see if himself, FMs, SFMs or NC has taken action for cases where an action is required. This is a follow up of his responsibility to call the attention of the Manager concerned to a recommended action." New Incentives, Security Procedures and Status (unpublished), "Security Procedures and Status" sheet, cell C11.
- "FM: Will discuss each FOs travel to the clinics or settlements based on highlighted Risk Rating for Disbursement Day or Field Activity, and submit this as part of the FM Check-in. FOs should be able to report if they are uncomfortable to travel based on the Security Assessment and Recommendations and recommend for activities to be cancelled." New Incentives, Security Procedures and Status (unpublished), "Security Procedures and Status" sheet, cell C13.
- System: Displays Travel Safety Measures from Clinic and Settlement Security Assessments. Will not allow expenses or in-person activities to get logged against No Go clinics and settlements." New Incentives, Security Procedures and Status (unpublished), "Security Procedures and Status" sheet, cell C18.
- "All Staff:1. Completion of UN B-SAFE and certificates in Zoho 2. Signed CSP + Quiz + Statement 3. Companion Card Received." New Incentives, Security Procedures and Status (unpublished), "Security Procedures and Status" sheet, cell C19.
- New Incentives training includes (among other topics):
- UN BSafe training: how to prepare for travel, emergency communications, and how to respond to violence
- Training on the Country Security Plan, including standard operating procedures on road safety/travel, cash management, abduction, political, ethnic and religious instability, bad governance, and health risks.
- Road safety training, including control measures to prevent life-threatening accidents, such as using seatbelts and enforcing speed limits.
- Abduction and kidnapping, including procedures to follow in cases of suspected abduction.
Svetha Janumpalli, Founder and CEO, and Pratyush Agarwal, Co-founder and COO, New Incentives, conversations with GiveWell, March 25-27, 2020 (unpublished).
- 302
The number of security incidents reported involving New Incentives staff was 0.4 per 100 disbursement days in March - December 2020, 0.2 in 2021, 0.1 in 2022, and 0.1 in 2023. See this row of our monitoring analysis.
- 303
New Incentives also operates in an environment where corruption is a general concern. In 2023 Nigeria scored 25/100 on Transparency International's Corruption Perceptions Index.
- 304
Those controls include, but are not limited to, requiring photographic documentation of worksites throughout the day, checking that GPS data matches the expected work location, extensive data submission requirements, minimum activity durations, and setting caps on allowable expenses levels. If those requirements are not met, the expenses for the associated workday may be revised or rejected. For example, if a Field Officer were to give out cash to friends or family but record it as incentives disbursed during vaccination visits, those expenses would in theory be rejected for lack of corroborating data.
- 305
"We made over 240 terminations in 2023 due to poor performance, negligence, and/or expense falsification. Though difficult, these terminations have been extremely helpful. We have learned that other approaches such as issuing other forms of Disciplinary Action or asking for falsified expenses to be reimbursed are insufficient. We have seen a shift in diligence and increased honesty since making these terminations. We have learned that what staff value most are long-term jobs with reliable pay and health benefits in a mission-oriented organization; terminations serve as an important fraud deterrent." New Incentives, Program Updates, January 5, 2024 (unpublished)
- 306
- Further details on expense approvals: In February 2023, New Incentives introduced a policy of providing each Field Officer 10,000 naira per month to cover accidental errors in expense submissions that may lead to some submitted expenses not being reimbursed. In May 2024, 30% of Field Officers had expense revisions or rejections that exceeded the 10,000 naira buffer. For the majority of Field Officers (>60%) those extra costs were less than 10,000 naira. New Incentives reports that, from January to June 2024, 4% of total expense submissions were revised or rejected." New Incentives, responses to GiveWell questions, July 8, 2024 (unpublished)
- On staff complaints: New Incentives has informed us that many current and former staff have complained about expense rejections and requested wage increases. New Incentives often shares this type of staff feedback in its monthly written program updates, most recently in its March 2024 program update. New Incentives, Program Updates, March 8, 2024 (unpublished)
- New Incentives has told us that it has a ticketing system in place for staff to raise complaints and dispute unreimbursed expenses, and that it makes corrections for valid disputes.
- 307
- On recruitment: "From June 2023 to June 2024, we received approximately 20,000 external applications for the Field Officer position and recruited about 1,300 FOs in all states of operations during that same time period." New Incentives, responses to GiveWell questions, July 5, 2024 (unpublished)
- On staff retention:
- "About 220 FOs resigned in 2023 and 96 in 2024 YTD (this includes staff members under active investigation for misrepresenting funds). We currently employ over 2,000 FOs." New Incentives, responses to GiveWell questions, July 5, 2024 (unpublished)
- 220 / (2,000 + 220) = 9.9%. Note that this is intended to be a rough estimation of staff turnover, as we did not ask for the exact number of terminations/resignations or the exact number of employed Field Officers.
- 308
Days on which clinics provide routine immunizations are called “immunization days”. See this section of our report on New Incentives’ program for more details.
- 309
See this row in our summary of New Incentives’ monitoring.
- 310
New Incentives, Incidents involving staff (unpublished):
- "Year: 2017, Week: 49. On 10-Oct, staff reported the following: According to him . . . he carried motorcyclist to convey him to [redacted], about 3 km from colony then the motorcyclist said he want to ease himself, [he] agreed and the man stopped, immediately he stopped 2 men came out from the farm one with cutlass and the other with pistol, they asked him to take a small foot path which he . . . complied, as they went in they met two other guys each with cutlass and axe, he . . . saw the motorcyclist parked his own bike and joined them, they asked for money and handset which he . . . gave them, they searched all compartments of his back bag they could not find any thing because all the money is in his waist bag except transport money."
- "Year: 2018, Week: 28. On 10-July, staff reported that 'Thieves broke into his home and Stole cash amounting to N71000 and his big Npower tab phone with 2 chargers and power bank. Staff also reported incident to the police."
- "Year: 2019; Week: 6. This evening at about 8 pm I received a call from my FV . . . reporting that his room was buggled at [redacted] and all his valuable was stolen including the organization's phone."
- "Year: 2019; Week: 20. On Sunday 12/05/19, at about 9:30 pm, FM got a call from [FO] who called and narrated how his phone was stolen as he went for evening prayers after breaking his fast. He mentioned that he had dropped his work phone inside his room to charge it, as the battery of the phone was very low. But when he returned from the mosque, he noticed that the phone has been stolen."
- "Year: 2019; Week: 23. It was reported that today 06/06/19 at around 1:00 pm, armed bandit attacked 2 of our staff on their way back home from the . . . clinic. According to the staffs the attack took place at [redacted] immediately after crossing the river they met 2 bandits with 2 AK 47 rifles waiting for their arrival. After several questions from the bandit they said they are suspecting the bike men are informants, so they are going to hurt them, but finally they collected 1 office smartphone, 1 personal phone, N62,000 for Disbursement, and N13,000 for Transport from [redacted], and they collected N69,000 for Disbursement N13,000 only for the Transport, from [redacted], the incident took place about 4km to . . . clinic."
- "Year: 2020; Week: 10. On 10-Mar along [redacted] road, it was reported that someone stole FOs phone on his way from [redacted] to [redacted] in public car. FO reported that he had the phone conveniently placed in his pocket during the trip only to discover when he alighted from the vehicle that the phone was no longer there. Despite making several efforts in retrieving the phone by going to the park to lodge same complain, it proved abortive."
- "Year: 2020; Week: 16. Staff reported that: At [redacted], at night before sleeping, he plugged his phone to charge around 12:30 am as he always do, only to wake up in the morning around 6:43 am and could not find the phone. It is evident the phone must have been stolen because the door was not properly locked. Amongst the items stolen are; 1 NI/ABAE Phone and 2 other phones , belonging to his mother and brother."
- "Year: 2020; Week: 20. At [redacted], staff reported that her home was burgled around 0300hrs on 14-May and valuables including her personal phone, generator set and twenty five thousand naira (25,000) belonging to NI/ABAE was stolen. She further reported that the thieves attempted to make away with her car when they were awoken by the car alarm. At the instance of the alarm, the thieves allegedly withdrew from the scene."
- "Year: 2020; Week: 20. At [redacted], Staff went to the Bank to request for a Bank statement as requested by HR during one of his non-clinic operational days. Upon coming out from the bank, he realized his bike has been stolen. In a secret compartment of the bike is a pass issued to the staff to allow access during COVID-19 lockdown."
- 311
New Incentives told us: "We believe that this is infrequent since the bandits rely on the community for support. Also, it is unlikely that bandits would target female caregivers traveling to the clinic who are receiving small amounts like N500 and N2,000. While we ask questions regarding caregivers losing part of their cash transfers due to bribes or 'dashes' during each disbursement, we do not specifically ask whether caregivers have experienced theft by third parties." GiveWell, Questions for New Incentives about potential negative and offsetting effects, 2020, pg. 1.
- 312
As of 2020, New Incentives reports that there are cases in which this might have occurred: "While we don't have data, below are the cases where we anticipate that supply-side efforts could have led to shortages at other clinics in the state:
Sometimes if there is a stockout at the LGA store, our clinic might request vaccines from a nearby clinic. These requests can be refused if the neighboring clinic does not think they have adequate additional stock to spare, we have seen many cases of refusals from nearby clinics. There are at least 87 cases recorded where we attempted to borrow vaccines from a nearby clinic (these cases can be found by searching for 'borrow' in the Clinic level Case Log).
The consumption increase due to our clinics could cause a short-term shortage in the LGA (we have records of this happening in one of the LGAs in Zamfara with 5 of our partner clinics)." GiveWell, Questions for New Incentives about potential negative and offsetting effects, 2020, pg. 1. - 313
“Vaccines are allocated through a calculation made based on factors such as estimated population and consumption. Each LGA is allocated a consignment per quarter in which maximum and minimum stock levels are indicated. SCCOs can authorize LGAs to conduct vaccine ‘mopping’ in which LGAs can request stock from neighboring LGAs with an excess stock, but we do not expect the SCCO to authorize such a request if it would compromise those minimum levels. In general, LGAs are hesitant to participate in vaccine mopping to preserve adequate stock for their clinics and because they have no incentive to share their stock. NI promotes vaccine supply in all LGAs through transportation support to pull supplies (typically from the State’s Cold Chain storage) in both NI- and non-NI LGAs when needed. We are cognizant of the possibility that LGAs where we operate might get prioritized and try to take measures to avoid this.” New Incentives, email to GiveWell, October 24, 2022 (unpublished).
“NI works with LCCOs and SCCOs to resolve stockout concerns in both operating and non-operating locations. In 2023, our team launched the Monthly RI Vaccine Round Table, a virtual meeting attended by ZCCOs and SCCOs from all states in NW and NE Zones. The goal of this meeting is to foster relationships amongst key partners, gain insight into the vaccine supply space, and proffer targeted solutions to supply challenges. NI also doesn’t limit its financial support for vaccine distribution to NI-operating states and LGAs. For example, in Q1 2023 we provided support to all the LGAs in Katsina for Measles antigen to be distributed to all the LGAs in the state, not only those where we operate.” New Incentives, Vaccine Supply-Side Dynamics: Follow-up, March 2023 (unpublished).
- 314
See this row in our cost-effectiveness analysis. Note, we also consider other grantee-level factors in our analysis that we do not discuss in this report:
- Risk of wastage:
- Double treatment (children not benefitting from the program because they have already received it elsewhere). We account for children receiving more than one of the same vaccination separately in our analysis of program costs (here).
- Ineffective goods (whether the program might use goods that are out of date, poorly made, or otherwise ineffective). We account for this separately in our adjustment for lower vaccine efficacy in Nigeria (here).
- Goods purchased and left in storage until they expire. We exclude this factor because New Incentives does not itself distribute vaccines. More detail in this cell note.
- Factors affecting our confidence in funds being used for their intended purposes:
- Change of priorities (i.e., New Incentives uses funds designated for the core program for something else). We do not believe that this is a meaningful risk with New Incentives, which runs a single program.
- Within-org fungibility (i.e., our funding frees up funding for New Incentives to use on another program). We do not believe that this is a meaningful risk with New Incentives, which runs a single program.
We do not discuss these factors in this report because we assign a 0% downward adjustment in each case. See this section of our cost-effectiveness analysis for more details on our reasoning.
- Risk of wastage:
- 315
See this section in our cost-effectiveness analysis.
- 316
For information about the various audits for compliance and fraud that New Incentives conducts, see this section of our New Incentives report.
- 317
"The Central Bank of Nigeria (CBN) recently announced that they will be replacing ₦200, ₦500, and ₦1,000 bills. They plan on starting this on December 15, 2022 while allowing time until January 31, 2023 to replace all the old bills. We expect that this could result in a temporary shortage of bills that can be used to disburse CCTs to caregivers and could result in a temporary increase in the number of infants not served." New Incentives, Program Updates, November 2022 (unpublished)
- 318
See this row of our cost-effectiveness analysis.
- 319
See this row in our cost-effectiveness analysis.
- 320
See this section of our cost-effectiveness analysis.
- 321
For details of how we estimate this, see this section.
- 322
- We estimate that each dollar spent by the Nigerian government generates 0.005 units of value if used for other activities, and each dollar spent by Gavi generates 0.007 units of value.
- In total, we think these actors spend ~$640,000 on vaccines per $1 million spent by New Incentives (~$350,000 for the Nigerian government, ~$291,000 for Gavi).
- This implies that shifting these resources away from other activities results in -3,802 units of value being lost. (~350,000 x 0.005) + (~291,000 x 0.007) = -3,802.
See this row in our cost-effectiveness analysis.
- 323
See these rows in our cost-effectiveness analysis.
- 324
3,422/77,387 = ~4%.
- 325
See this row in our cost-effectiveness analysis.
- 326
We estimate that the Nigerian government’s spending on other activities generates 0.005 of value per $, compared to 0.077 for New Incentives’ program in Bauchi. 0.005 / 0.077 = ~6%. See this section for how we generate these estimates.
- 327
See this row in our cost-effectiveness analysis.
- 328
7,233 / 77,387 = ~9%.
- 329
See this row of our cost-effectiveness analysis.
- 330
See these rows of our cost-effectiveness analysis.
- 331
See this section of our cost-effectiveness analysis.
- 332
See this section of our cost-effectiveness analysis.
- 333
See this section of our separate report on New Incentives’ program for more details.
- 334
Nigeria Strategy for Immunisation and PHC System Strengthening (NSIPSS), 2018.
- 335
See Nigeria Strategy for Immunisation and PHC System Strengthening (NSIPSS), 2018, section 6.3, pgs 34 - 40.
- 336
We learned about this program in 2019, but have not deeply investigated what has happened since then. As of 2020, our understanding was that in the three states where New Incentives worked at the time:
- Katsina chose an education-focused condition for this program over a health-focused condition in part because it judged the health sector to already be better served than the education sector; knowledge of New Incentives' program may have affected that assessment.
- Jigawa has chosen health-focused conditions for the transfers.
- Zamfara had not selected a condition as of June 2020.
Dr. Obinna Ebirim, National Coordinator, New Incentives, email to GiveWell, June 12, 2019 (unpublished):
"Comment 1: In 2019-2023, the World Bank CCT program is being operated as an experiment and is only expected to reach a small portion of the population (<1% of the population for the conditional transfer; plus Katsina State is not including immunization in its conditions and we don't yet know whether Zamfara State will)
Response to Comment 1: The World Bank CCT program is being operated as a program. The reason why the proportion of the entire population of the State that is benefiting is small (<1%) is because the target of the program is not the entire population but the poorest of the poor that are in the National Social Register."
“Jigawa State chose health as their conditionality for the top up conditional cash transfer and got above average in the supply-side evaluation and re-evaluation.”
“We are unsure to what extent our program has influenced the choice of Katsina State. Our last discussion with the Social Safety Net Office in Katsina State on this matter revealed that Katsina State prioritizes various sector including health and education but feels that health, unlike education, has been receiving lots of interventions by both Government and NGOs. The government official we spoke to gave examples of the government's Saving One Million Lives Program for Result (SOML-PforR) which cuts across Maternal, Newborn and Child Health (MNCH), the New Incentives CCTs for Routine Immunizations program, and Save the Children's nutrition program. An example of Katsina State government's investments in health is the State Emergency Routine Immunization Coordination Centre (SERICC); Katsina State is one of the 18 States in Nigeria that have the equivalent state setup of the National Emergency Routine Immunization Coordination Centre (NERICC). The purpose of these coordination centres is to utilize a war-room like approach of allocating more resources to closely monitor trends, identify issues and solutions, and implement them to improve routine immunization coverage."
"Katsina State has been implementing the base unconditional cash transfer and has recently selected girl-child education as their conditionality. . . . Zamfara State is yet to choose a conditionality."
"Based on our latest understanding, Zamfara is still at the base phase and yet to get to the top-up phase where the conditionality is chosen by the state." GiveWell, Questions for New Incentives about potential negative and offsetting effects, p. 2. - 337
See this row of our analysis.
- 338
See this row of our cost-effectiveness analysis.
- 339
0.005 / 0.077 = ~6%.
- 340
See this cell in our supplementary analysis.
- 341
Health
- We use data from the Uganda National Health Expenditure Accounts in 2013-2014 (available here) as a proxy for how domestic governments in low-income countries allocate their health spending. In that year, approximately 30% of the health spending was allocated to HIV/AIDS, 20% to malaria, and the rest to other programs (see this column in our accompanying spreadsheet).
- We roughly guess the dollar value required to save a life for eight of the largest categories of spending (e.g., we guess $30,000 of spending on HIV/AIDS programs is required to save one life (here), compared to $10,000 for malaria (here). As a simplifying assumption, we divide each category of spending into spending intended to save adult lives (e.g., HIV/AIDS), or spending intended to save under-five lives (e.g., malaria) (see this column in our accompanying spreadsheet). This allows us to calculate the weighted average cost required to save one child’s life ($12,254) and one adult life ($30,000).
- Finally, we translate these figures into standardized units of value using GiveWell’s moral weights for the value of averting a child death (116 units) and adult death (73 units). We also use our estimates of the proportion of spending allocated to programs intended to save adult lives (55%) and under-five lives (45%). This results in an overall weighted average of 0.0056 units of value per US dollar spent on health programs by domestic governments. See this section of our supplementary analysis for our calculations.
Education
- As with health, we use data from Uganda as a proxy for how domestic governments in low-income countries allocate their education spending. Specifically, we rely on World Bank 2014 data that 7% of Uganda’s GDP in 2014 went towards primary education, 3% went towards secondary education and 2% went towards tertiary education (here). We then rescale these figures, resulting in estimates that 59% of education spending in Uganda goes towards primary education, 25% towards secondary education and 16% towards tertiary education (here).
- As a simplifying assumption, we assume that the primary benefit of education spending is that it increases long-run income and consumption. We benchmark our estimates to our estimates of the impact of GiveDirectly’s unconditional cash transfer program (which we think also increases income and consumption). Specifically, we roughly guess that primary education spending is 100% as valuable as GiveDirectly’s program, secondary education is 70% as valuable and tertiary education is 50% as valuable (here).
- We take a weighted average of these values, using the % of government spending on each category of education as weights. This results in an overall estimate of 0.0028 units of value per $ spent on education programs by domestic governments. See this section of our supplementary analysis for our calculations.
Social security
We use a similar approach to estimating the value of social security spending as education spending. Specifically:
- We use data from Uganda as a proxy for how domestic governments in low-income countries allocate their social security spending. We use World Bank 2014 estimates that social security spending accounted for 0.62% of Uganda’s GDP (here). Within this, 0.29% of GDP is in-kind spending, 0.1% is social pension spending, 0.1% is conditional cash transfers, and 0.05% is other cash transfers (here).
- We roughly guess the value generated by each of these four largest categories of social security spending, excluding the smaller categories. As with education spending, we use the simplifying assumption that the primary benefit of social security spending is that it increases income and consumption. Benchmarking to GiveDirectly’s cash transfer program, we guess that cash transfers generate 100% of the value of GiveDirectly’s program and in-kind and social pension spending each generate 70% of the value (here).
- We take a weighted average of these values, using the % of government spending on each category of social security spending as the weights (re-scaled to ignore smaller categories). This results in an overall estimate of 0.0026 units of value per $ spent on social security programs by domestic governments. See this section of our supplementary analysis for our calculations.
- 342
See here in our cost-effectiveness analysis.
- 343
See this row of our cost-effectiveness analysis.
- 344
0.007 / 0.077 = ~9%.
- 345
For example, pledges to Gavi in 2020 (for the 2021-2025 period) exceeded its replenishment ask: “US$8.8 billion worth of new commitments were pledged by public and private sector donors towards Gavi’s replenishment, well exceeding the target set in support of Gavi’s investment opportunity for the next 5 years. These pledges will add to the US$1.7 billion previously secured by Gavi, bringing its resources for 2021-2025 to more than US$10.5 billion. Gavi is now well positioned to accelerate the roll out of current vaccines, reach 300 million more children in developing countries by 2025, and in so doing contribute to saving 7 to 8 million lives.” Global Vaccine Summit London 2020.
- 346
The rate of stockouts of any vaccine rose from ~8 per 100 disbursement days during the RCT to ~45 per 100 disbursement days in 2023. While we see this as concerning, we do not currently see it as a significant threat to the program because the increase in stockouts is concentrated heavily in indirectly incentivized vaccines, particularly the rotavirus vaccine (which was only introduced in the Nigerian immunization schedule in August 2022, see Gavi, "Dealing with diarrhoea: Nigeria introduces rotavirus vaccine into its immunisation plan," August 30, 2022). These form a relatively small share of the overall benefits of the program. More here and in this row of our summary of New Incentives' monitoring data.
- 347
"New Incentives will group local government areas (LGAs) it expands to within a given state at a given point in time into ‘expansion groups’. New Incentives will then collect coverage data in these expansion groups once before the start of operations to establish baseline coverage rates." IDinsight, Coverage monitoring analysis plan, 2021, pg. 1.
For the dates of the surveys we have received from New Incentives, see here. - 348
Some of the estimates we use in our main analysis of vaccine effects rely in part on meta-analyses that include some observational studies. See the footnotes in this section for more details.
- 349
King et al. 2020: Each percentage point increase in PCV coverage was associated with a 1-2% decrease in non-traumatic infant mortality:
- Results from Study 1: "Adjusted negative binomial regression of monthly mortality against three-dose coverage found every 1 percentage point increase in coverage was associated with a 2.0% (95% CI: 1.5 to 2.4; p value<0.001) decrease in mortality"
- Results from Study 2: “Across 354 geographical clusters, three-dose PCV13 coverage ranged from 58% to 100% and mortality ranged from 0 to 87/1000 live births. Cluster-level impact analysis, using negative binomial regression adjusted for RV1 coverage, found that every 1% absolute increase in three-dose coverage by geographical cluster was associated with a 1.3% reduction in non-traumatic infant mortality (95% CI: 0.3% to 2.4%; p value=0.02).”
Bar-Zeev et al. 2018: Each percentage point increase in vaccine coverage was associated with a 1.1% decrease in diarrhea-related mortality. “Two-dose vaccine coverage ranged from 63·6% to 100% across clusters; each percentage point increase in vaccine coverage was associated with a 1·6% (95% CI 0·8–2·5) lower diarrhoea-associated mortality rate (appendix). Adjusting for sociodemographic covariates, the reduction was 1·1% (95% CI 0·9–1·3).”
Sifuna et al. 2023: A coverage increase from 0-75% was associated with a 44% reduction in all-cause child mortality. “Following its introduction in late 2014, the span of rotavirus vaccine coverage for children increased to 75% by 2017. Receiving the rotavirus vaccine was associated with a 44% reduction in all-cause child mortality (95% confidence interval = 28-68%, p < 0.0001), but not diarrhea-specific mortality (p = 0.401).” - 350
See GiveWell’s grant page to IRD Global for more details.
- 351
“US$8.8 billion worth of new commitments were pledged by public and private sector donors towards Gavi’s replenishment, well exceeding the target set in support of Gavi’s investment opportunity for the next 5 years. These pledges will add to the US$1.7 billion previously secured by Gavi, bringing its resources for 2021-2025 to more than US$10.5 billion. Gavi is now well positioned to accelerate the roll out of current vaccines, reach 300 million more children in developing countries by 2025, and in so doing contribute to saving 7 to 8 million lives.” Global Vaccine Summit London 2020
“Over US$7.5 billion was pledged by 31 public and private sector donors, which means that Gavi, the Vaccine Alliance is well positioned to achieve these milestones, expand vaccine coverage, strengthen health systems and accelerate the introduction of new vaccines. The pledges announced today will be combined with US$2 billion in resources already committed for the 2016-2020 period to enable Gavi to meet the US$9.5 billion cost of funding vaccine programmes in developing countries over the next five year period.” Gavi, Reach Every Child: Gavi Pledging Conference, 2015
- 352
“Respondents who had either never vaccinated their children or had missed one or more vaccinations (89.8% of the sample), were asked the question 'Why have they not received these vaccinations?'. Responses were categorized by enumerators into one of 18 possible categories”. IDinsight, New Incentives evaluation baseline report, 2019, p. 48.
- 353
IDinsight, New Incentives evaluation baseline report, 2019, figure 14, p. 49.
- 354 For example, LiST does not include BCG vaccination at all in their model.
- 355
We received feedback in 2022, in a submission to GiveWell’s “Change our Mind” contest, that we should use an epidemiological model rather than a static model: “Our first critique is the core modelling approach taken for this cost-effectiveness model. We understand the model developed by GiveWell to be a static model; the gold standard of models for vaccination cost effectiveness are dynamic models (1). Models such as Susceptible-Infected-Recovered (SIR) models may be especially suited. However, we understand from the literature that it is not straightforward to estimate the extent to which these types of models provide differing estimates to static models.” Naik and Field 2022, p. 1.
- 356
"The World Health Organization (WHO) has recommended a new vaccine, R21/Matrix-M, for the prevention of malaria in children. . . . The R21 vaccine is the second malaria vaccine recommended by WHO, following the RTS,S/AS01 vaccine, which received a WHO recommendation in 2021." World Health Organizatgion, "WHO recommends R21/Matrix-M vaccine for malaria prevention in updated advice on immunization," 2023.
- 357
We estimate that each dollar donated to GiveDirectly’s direct cash transfer program generates 0.003 units of value. 0.005 / 0.00335 = ~1.5.
- 358
We estimate that each dollar donated to GiveDirectly’s direct cash transfer program generates 0.003 units of value. 0.007 / 0.00335 = ~2.