We have published a more recent review of this organization. See our most recent report on the SCI Foundation, formerly known as the Schistosomiasis Control Initiative.
More information: What is our evaluation process?
Published: November 2014
Summary
What do they do? SCI works with governments in sub-Saharan Africa to create or scale up deworming programs. SCI's role has primarily been to identify country recipients, provide funding to governments for government-implemented programs, provide advisory support, and conduct research on the process and outcomes of the programs. Despite SCI sharing a number of spending reports with us, we do not feel we have a clear and complete picture of how SCI and the governments it supports have spent funds in the past. (More)
Does it work? We believe that there is relatively strong evidence for the positive impact of deworming. SCI has conducted several studies to determine whether its programs have reached a large proportion of children targeted. These studies provide some evidence that SCI has successfully implemented its programs but also have some significant limitations. (More)
What do you get for your dollar? We estimate that children are dewormed for a total of around $1.23 per child. This figure relies on several difficult-to-estimate inputs including (a) how to account for donated drugs and (b) the portion of costs paid for by the governments with which SCI works.The number of lives significantly improved is a function of a number of difficult-to-estimate factors, which we discuss in detail in a separate report. (More)
Is there room for more funds? It is difficult to predict how much additional funding SCI will be able to use productively in the next year. Overall, we believe that SCI will likely have opportunities to spend or commit at least $3.8 million in the next year, and that it is possible, but less likely, that up to an additional $4.5 million (total $8.3 million) would enable SCI to undertake work that it would otherwise not be able to due to funding constraints. SCI holds about $1 million in uncommitted funds. (More)
SCI is recommended because of its:
- Focus on a program with a strong track record and excellent cost-effectiveness. (More)
- Track record – SCI has repeatedly demonstrated success at starting and expanding national deworming programs.
- Room for more funding – we believe SCI will use be able to use additional funds to deliver additional treatments. (More)
Major unresolved issues include:
- We have a limited understanding of SCI's work at a detailed level because we have limited and perhaps unreliable data on how SCI has spent funds in the past.
- We know fairly little about how successful SCI has been at reaching those it has targeted for treatment.
Table of Contents
- Summary
- Our review process
- What do they do?
- Does it work?
- What do you get for your dollar?
- Room for more funding?
- SCI as an organization
- Sources
Our review process
We began reviewing SCI in 2009. Our review has consisted of:
- Reviewing published studies on SCI's programs.
- Extensive communications with SCI Director Alan Fenwick and Deputy Director Wendy Harrison to discuss SCI's methods and funding needs.
- Requesting and reviewing SCI internal financial and organizational documents.
- Visiting a national schistosomiasis control program meeting and demonstration mass drug administration in Malawi in October 2011 (notes and photos from this visit)
- Following SCI's progress and plans for funds raised as a result of GiveWell's recommendation (see our updates on SCI's progress).
- Meetings with eight SCI staff members at SCI's London headquarters in October 2014, including leadership, program managers, and monitoring and evaluation and finance staff.
All content on the Schistosomiasis Control Initiative, including past reviews, updates, blog posts and conversation notes, is available here.
What do they do?
SCI works with governments in sub-Saharan Africa to create or scale up mass drug administration programs (MDAs) for neglected tropical diseases (NTDs), particularly schistosomiasis and soil-transmitted helminths (STHs), in school-aged children and other groups determined to be at high risk.1 SCI's role has primarily been to solicit grants from large funders, identify country recipients, provide funding to governments for government-implemented programs, provide advisory support, and conduct research on the process and outcomes of the programs.
We feel that we have a limited understanding of SCI's work at a detailed level. SCI's model involves both (a) supporting staff for program management and technical assistance (capacity building) and (b) funding governments to carry out mapping and treatment programs. We have a reasonable understanding of the role SCI's staff plays, but have struggled to get a clear and complete picture of how SCI and the governments it supports have spent funds in the past. Clear spending data would allow us to have a better understanding of SCI's model, have more confidence in its financial management (including whether funds may be diverted for uses that don't support the program), and compare future plans to past spending to understand whether future funds are likely to achieve similar outcomes.
Major funding sources for SCI's work
SCI's work has been driven by a number of large grants, each with somewhat different program designs and geographic coverage:
- Initial Gates Foundation grant: SCI was founded in 2002 through a $32 million grant from the Bill and Melinda Gates Foundation.2 This grant was used to create national treatment programs for schistosomiasis and soil-transmitted helminths (STHs) in six countries.3
- Grants for integrated NTD control: In 2006, SCI received large grants from USAID and the Gates Foundation to support integrated NTD programs in eight countries for five years to treat lymphatic filariasis, onchocerciasis, and trachoma, in addition to schistosomiasis and STHs.4 It received a grant in 2007 to expand its advisory work to Rwanda and Burundi.5 All of these grants were due to be completed in 2011.6
- DFID grants: In 2010, SCI received £10.5 million7 (plus separate funding for drugs) from the UK's Department for International Development (DFID) for treating schistosomiasis and soil-transmitted helminths8 in eight countries over five years.9 Other NTDs are not covered by the grant, though DFID also provided funding to the Centre for Neglected Tropical Diseases (CNTD) to integrate treatment for lymphatic filariasis with SCI-funded schistosomiasis and STH programs in six countries.10 In 2014, DFID awarded SCI an additional £16.6 million over four and a half years (June 2014 to December 2018) to extend the program and expand it to an additional two countries.11
Since 2011, SCI has also received about $10 million in unrestricted funds, over half of which we can confidently attribute to GiveWell's recommendation. We discuss what we know about how SCI has used unrestricted funds below.
SCI’s role in mass drug administration programs
SCI's role in mass drug administrations (MDAs) in general is to:12
- Advocate for the benefits of mass drug distributions to government officials.
- Assist with planning and budgeting.
- Deliver funding and drugs to governments.
- Provide financial management and technical support.
- Develop procedures for monitoring and evaluation, analyze data, and write reports.
We spoke with four of SCI's program managers to better understand SCI's role in four countries. These conversations were mostly consistent with our general understanding of SCI's work. We selected Côte d'Ivoire, Ethiopia, and Mozambique because SCI has spent significant unrestricted funds, the type of funding GiveWell has recommended, in these countries (more below). SCI selected Uganda as the fourth case study. Summaries follow.
Côte d'Ivoire
- History: There was no large-scale schistosomiasis treatment program in the country prior to SCI's involvement.13 SCI began working in Côte d'Ivoire in 2010, but mapping and treatments did not begin until 2012 due to political turmoil. It has funded mapping and treatment for all qualifying districts.14 SCI expects to fund about 4.9 million treatments over the course of 2014.15 SCI previously told us that it spent a small amount of unrestricted funding in the country prior to 2011; we do not know what this funding was for.16
- Funding: SCI has used DFID funding (about $280,000 in the fiscal year covering 2013-14 and $320,000 in 2014-15), a grant from the company Vitol ($160,000) and unrestricted funding (about $525,000, mostly in 2014) in Côte d'Ivoire.17
- Impact of unrestricted funds: SCI believes that availability of unrestricted funds has allowed the program to scale up faster than it otherwise could have.18
- Partners: In the early stages of the program, SCI primarily worked with the Ministry of Health and, for mapping, the Université Félix Houphouët-Boigny. Starting in 2014, schistosomiasis treatment will be integrated with other mass treatment programs and SCI expects to cost-share with other partners for the integrated program.19
- Role of SCI staff: SCI's Program Manager for Côte d'Ivoire described her role as providing technical expertise, helping create budgets, monitoring training and MDAs, responding to problems (for example, she plans to survey health workers to understand low coverage of non-enrolled children, and she advised on how to proceed with the program during a security threat), refining the protocol for the coverage survey, and coordinating with partners for integrated MDAs.20 From November 2013 through November 2014, she traveled to Côte d'Ivoire five times and spent almost four months there in total to assist with and monitor mapping, sentinel site and coverage survey data collection, three MDAs, and budgeting.21 She also noted the role of other SCI staff in the program: the finance team checks receipts against expense reports,22 and the Biostatistician analyzes monitoring data and advises government staff on data issues.23
Ethiopia
- History: There was no sustained, large-scale schistosomiasis treatment program in the country prior to SCI's involvement, only one-off, sub-national treatment.24 SCI began conversations with the government of Ethiopia about starting a national schistosomiasis treatment program in 2012. In 2013, it funded planning for the program. It funded mapping between November 2013 and April 2014, and a first round of treatment in 2013.25 SCI expects to fund about 3.6 million treatments between November 2014 and March 2015.26
- Funding: SCI used about $1.5 million in unrestricted funds for planning, mapping, and the first round of treatment.27 The END Fund and DFID have now allocated restricted funds for treatment in the country.28
- Impact of unrestricted funds: SCI believes that availability of mapping data significantly improved the chances of securing funding from the END Fund and DFID, and that, at a minimum, the availability of unrestricted funds accelerated the program by a few years.29 Ethiopia's Neglected Tropical Diseases Program Manager told us that the government had not dedicated funding to schistosomiasis and that without SCI's involvement the program would likely not have gone forward. Ethiopia was not aware of any other potential partners for this work when it began working with SCI.30
- Partners: SCI is funding the Federal Ministry of Health (FMOH) to carry out treatments. It partnered with the Ethiopian Public Health Institute, the technical arm of the FMOH, and the Partnership for Child Development (PCD) on mapping. PCD funded mapping in part of the country and delivered treatments in a pilot program. Deworm the World Initiative is providing technical assistance to the government.31
- Role of SCI staff: SCI's Program Manager for Ethiopia described his role to date as assisting with initial program set up and funder agreements, drafting detailed plans for the next 12 months and general plans for the next 5 years, and providing technical assistance for mapping and some guidance on MDA implementation. He lives in the country32 and works in the same office as the government NTD team.33
Mozambique
- History: There was no large-scale schistosomiasis treatment program in the country prior to SCI/CNTD's involvement. SCI had previously funded a small-scale treatment program in Mozambique with unrestricted funding.34 SCI's grant from DFID, which started in 2010, includes funding for a sub-grant to CNTD to run schistosomiasis treatment programs in three countries, one of which is Mozambique.35 SCI and CNTD decided on this arrangement because SCI believed it would increase the chances of DFID awarding the grant.36 SCI plans to fund a total of 7 million treatments in Mozambique in April 2014 to March 2015.37
- Funding: SCI has used DFID (about $1 million in the fiscal year covering 2013-14 and $240,000 in 2014-15) and unrestricted funding (about $2 million, mostly in 2014) to fund the treatment program.38 It also has funding from the SCORE project for research on "gaining and sustaining control of schistosomiasis" in one province.39
- Impact of unrestricted funds: SCI told us that unrestricted funds have helped the program scale, but perhaps not as much as it might appear, since SCI has shifted DFID funding to other countries with the expectation of using unrestricted funds in the country.40
- Partners: The Ministry of Health implements the program. SCI/CNTD also collaborate with RTI International, which is working on trachoma in Mozambique and has staff in-country. RTI helps to keep SCI/CNTD informed about program progress.41
- Role of SCI staff: CNTD manages the program day-to-day. SCI has provided some assistance with monitoring and evaluation. We do not have more detail on SCI/CNTD's role in the country.42
Uganda
- History: SCI has worked in Uganda since 2003 and has received funding for this work from each of its large grants: Gates Foundation, USAID, and DFID. There was a gap in SCI's work between the USAID and DFID funding.43 SCI plans to fund a total of 400,000 treatments in Uganda in April 2014 to March 2015.44
- Funding: In recent years, SCI has primarily used DFID funding in Uganda (about $220,000 in the fiscal year covering 2013-14 and $95,000 in 2014-15).45 SCI allocated a small amount of unrestricted funding to Uganda to increase the number of sentinel sites for operational research purposes.46
- Partners: RTI International, funded by USAID, works in Uganda on an integrated mass NTD treatment program. SCI provides schistosomiasis treatment in those areas where RTI does not.47
- Role of SCI staff: SCI told us that, due to strong in-country capacity, SCI provides only limited technical assistance for MDA. Instead, SCI's technical assistance in the country is focused on operational research on how best to move toward elimination of schistosomiasis.48 SCI's program manager for Uganda describes her role as assisting with budgets and plans, talking to the government regularly (largely through email) leading up to an MDA to make sure all the components are prepared, traveling to the country to oversee collection of prevalence and intensity data prior to an MDA, following up with the government after an MDA to get the data needed for reporting to DFID, and participating in activity reviews after each stage of the program (for example, after an MDA and after monitoring and evaluation activities).49
Breakdown of SCI’s spending
We have not seen complete information on how SCI has spent funds in the past. SCI does not report a comprehensive budget of all of its expenditures. It reports spending for each of its "accounts." It has accounts for each of the grants it has received, as well as accounts for unrestricted donations. We have seen some spending details for a portion of these accounts.
We have not seen a spending breakdown from SCI that covers all costs in a particular period. We believe that the information that we have seen on spending from the DFID grant, unrestricted funds, and other small grants provides a reasonably comprehensive picture of SCI's past spending. However, we have concerns about the quality of the information we have seen on unrestricted spending, fundraising, and current balances, and so we have relatively low confidence in the details of how unrestricted funding (which GiveWell has recommended) has affected SCI's work. Details follow.
We detail spending breakdowns for SCI's earlier work in an older version of this review.
DFID grant spending breakdown
The grant from DFID comprised the majority of SCI's current funding between the start of the project in 2010 and mid-2014.50
Under the DFID grant through March 2013 (the most recent data we have on what we believe to be a reliable breakdown51 ), SCI has spent about 48% on salaries and travel expenses for management and technical staff employed by SCI and CNTD52 and 52% to augment national government budgets for MDA programs (this excludes the cost of drugs, which are funded under a separate DFID grant).53 To further break down national government expenses, SCI provided detailed spending breakdowns for four countries: Niger, Tanzania, Uganda and Malawi over about two years, mid-2011 to mid-2013 (actual periods vary by country).54 SCI told us that these are the only four countries for which it has completed this type of spending analysis.55 We do not know why these particular countries were selected, but note that they are countries that are funded by DFID and have received little or no unrestricted funds.56 SCI has a long history of involvement in Niger, Tanzania, and Uganda, so we would guess that these programs are at a more advanced stage of development than many of the countries where SCI has begun working more recently.
In-country spending extrapolated from four countries57
| Spent by | Budget item | % of spending | Description | Range across four countries |
|---|---|---|---|---|
| SCI/CNTD | Technical personnel and travel | 36% | UK-based Technical Director, country program managers, health economist, biostatistician, data manager; Ugandan-based capacity building advisor; consultancy fees for technical assistance expertise. | N/A |
| SCI/CNTD | Management personnel and travel | 12% | UK-based SCI and CNTD personnel undertaking project operational and financial management; project administration. | N/A |
| National governments | Mass drug administration | 19% | Largely unspecified transfers to districts, individuals, or other organizations; per diem payments for health workers and supervisors; production of dose poles and treatment registers. | 9% to 30% |
| National governments | Central management (country-level) | 10% | Salaries for government staff; fuel and transport; utilities; office supplies and equipment; taxes; bank charges | 5% to 24% |
| National governments | Monitoring and evaluation (baseline and follow up surveys of prevalence and intensity; coverage surveys) | 5% | Per diem payments for attendance at review meeting; per diem payments for surveyors; fuel and transport; equipment | 1% to 12% |
| National governments | Mapping (surveys to determine disease prevalence in each district) | 5% | Per diem payments; fuel and transport; equipment; utilities | 8% to 11% |
| National governments | Social mobilization (building community awareness of the program) | 5% | Printing; radio and TV broadcasts; unspecified per diem payments | 2% to 14% |
| National governments | Strategic planning | 2% | Per diem payments; meeting venue and refreshments; fuel and transport; supplies | 1% to 4% |
| National governments | Drug supply chain | 2% | Custom fees; transport; per diem payments; lab materials; storage | 1% to 2% |
| National governments | Other | 3% | Includes uncategorized, training, supervision, and advocacy | 2% to 7% |
Programs funded with unrestricted funds
Prior to 2011, unrestricted funds accounted for a very small portion of SCI's total funding.58 SCI told us that this funding was primarily used to fund treatments in regions of Côte d'Ivoire and Mozambique.59
In part due to GiveWell's recommendation, since November 2011, SCI has received significantly more unrestricted funds: GiveWell has tracked about $5.3 million in donations to SCI due to our research,60 and the data we have seen on on spending, commitments, and uncommitted funds, suggests that SCI has raised roughly $4.7 million of unrestricted funds from other sources (we have not seen comprehensive data on revenue from SCI).61 SCI has provided data on how unrestricted funding has been spent over this period and how much unrestricted funding it holds in reserve. We have doubts about the accuracy of this information because:
- SCI is housed within Imperial College London. Because it is not a standalone charity, it does not publish annual financial statements or undergo annual organization-wide audits (as U.S. charities are required to do).
- It uses an accounting system created by Imperial College which seems ill-fitted to its needs and which breaks up its finances into many different "accounts" rather than giving an overall view of the organization's financial position.62
- Some unspent funds are held in accounts within the countries that SCI works in. These accounts are outside the Imperial College accounting system and so this adds to the complexity of tracking funds on hand.63
- SCI tracks some restricted grants in the same accounts as unrestricted funds and does not clearly distinguish between the two types of funding.64
- SCI had not had the staff capacity to manage its finances well.65
- Based on our experiences with SCI's financial reports, we believe that they are prone to containing errors. We detail the errors we have learned about in this footnote.66 Given our lack of visibility into SCI's finances and the unsystematic ways in which we've learned about these errors, we believe there is a strong chance that there are other errors that we have not found.
SCI reports that as of September 2014, it held about $3.1 million in accounts holding unrestricted funds (excluding known restricted funds).67 We are unclear what portion of this total is restricted.68 SCI has made future spending commitments with these funds, totalling $2.8 million, of which it expects to spend $1.9 million in 2015, $0.35 million in 2016, and $0.55 million in 2017-2018. Commitments for 2016-2018 are primarily funds set aside for SCI staff salaries.69 Adding a large gift of $0.54 million that SCI received in November 2014,70 and funds that GiveWell held as of November 2014 for granting to SCI,71 brings the estimated total of uncommitted funds to about $1 million as of November 2014.72
SCI has reported the following spending and commitments from unrestricted funds. As discussed above, we are not confident that this is a full accounting of expenditures, or that it fully excludes spending of restricted funds.73
| Country/purpose | Total spent (November 2011 to September 2014) | Total committed (as of September 2014) | % of total spending + commitments |
|---|---|---|---|
| Mozambique | $2,085,118 | $427,404 | 27.8% |
| Operating costs | $823,755 | $948,687 | 19.6% |
| Ethiopia | $1,495,818 | $40,946 | 17.0% |
| Côte d'Ivoire | $525,264 | $417,142 | 10.4% |
| Senegal | $234,492 | $258,605 | 5.5% |
| Sudan | $0 | $361,566 | 4.0% |
| Zimbabwe | $350,713 | $0 | 3.9% |
| Enhanced monitoring and evaluation | $236,344 | $17,427 | 2.8% |
| Malawi | $4,152 | $168,170 | 1.9% |
| Yemen | $162,686 | $0 | 1.8% |
| Other country programs | $288,052 | $186,221 | 5.3% |
| Total | $6,206,394 | $2,826,168 | 100.0% |
Other projects
In addition, SCI has received some smaller grants for a variety of projects, including:
- Research. SCI has received a number of smaller grants to carry out research related to NTD control.74
- NTD treatment programs funded by individuals and foundations. SCI has received restricted funds from individuals, foundations, and private companies to fund treatment in Uganda (on islands in Lake Victoria), Burundi, Rwanda, Côte d'Ivoire (mapping only), and Yemen.75
- Other NTD-related activities. SCI has also used funding from individuals for surgeries for hydrocele (a symptom of lymphatic filariasis) in Niger, and health education and water and sanitation programs in Burundi.76
Does it work?
SCI's mass drug administration programs are focused on delivering treatments that have been independently studied in rigorous trials and found to be effective.
SCI has conducted several studies to determine whether its programs have reached a large proportion of children targeted. The studies we have seen show fairly strong results from SCI's programs, but we have significant questions about them because of methodological limitations of the studies we have seen and concerns about how representative these studies are of SCI's work overall.
To determine SCI's track record at executing programs, we have considered:
- Panel studies in three of the countries SCI has worked in. These studies track prevalence and intensity of schistosomiasis and STHs. The studies show substantial improvements following SCI treatment programs. These studies have a number of limitations and represent a small portion of SCI's past work.
- Treatment coverage surveys from two of the countries SCI has worked in. These studies track what percentage of individuals who were targeted for treatment actually received treatment. The studies found mixed results and have a number of limitations.
- Other published papers that might reflect the treatment coverage achieved by SCI's programs by directly measuring deworming drug uptake or by measuring worm prevalence in countries where SCI has worked. The evidence is mixed, but makes a weak case for low coverage in the areas studied.
Details follow.
Independent evidence of program effectiveness
SCI's primary program is mass combination deworming, which we discuss extensively on another page. There is a very strong case that mass deworming is effective in reducing infections. The evidence on the connection to positive quality-of-life impacts is less clear, but there is a fairly strong possibility that deworming is highly beneficial.
Internal monitoring: Panel studies
SCI has conducted panel studies to track changes in schistosomiasis and STH prevalence and intensity rates following SCI-supported treatment programs. In general, prevalence and intensity of the parasites decreased over time in each of the countries studied. We note several methodological limitations of these studies below.
Which panel studies provide evidence of SCI's impact?
Below, we discuss results from panel studies of schistosomiasis and STH prevalence and intensity from three countries: Niger (2004-2006),77 Burundi (2007-2010),78 and Malawi (2012-2014).79
SCI also shared panel studies from Uganda80 and Burkina Faso,81 and we included results from these studies in our previous reviews of SCI. We learned in 2013 (and in follow up work in 2014) that participants in the studies in Uganda and Burkina Faso received separate, more intensive treatment than other children in those countries (discussed in blog posts in 2013 and 2014). Therefore, we believe that the results from Uganda and Burkina Faso do not reflect the quality of the national programs which were supported by SCI.
It is our understanding that, in the Niger, Burundi, and Malawi studies, study participants received treatment in the same manner as other children in the country, and thus that those studies reflect the performance of the national MDAs. However, we are not highly confident in this conclusion because we had difficulties communicating clearly with SCI about the methodology of these studies (discussed in more detail in the blog posts linked above).
SCI told us that it is currently conducting similar studies in Mozambique, Liberia, Côte d'Ivoire, Zambia and Uganda and that it plans to share the results of those studies when they are completed.82
Niger, Burundi, and Malawi panel studies
As discussed above, SCI has conducted panel studies to track changes in schistosomiasis and STH prevalence and intensity rates following SCI-supported treatment programs in Niger, Burundi, and Malawi. In each study, the same individuals were examined before the initial round of treatment and before each subsequent round of treatment. There is no control group for these studies.83
In general, prevalence and intensity for the two main types of schistosomiasis, S. haemotobium and S. mansoni, and for hookworm (more on the other two STHs below), decreased over time in each of the countries studied. Though it is possible that other factors besides the treatment program caused these changes (such as improved sanitation infrastructure), the pattern of decline in a short period following treatment strongly suggests that treatment caused or contributed to the declines.
| Schistosoma haematobium | Schistosoma mansoni | Hookworm | ||||
|---|---|---|---|---|---|---|
| Country | Changes in prevalence | Changes in intensity | Changes in prevalence | Changes in intensity | Changes in prevalence | Changes in intensity |
| Niger | 75.4% at baseline to 38% at one year85 | 21.8% prevalence of heavy-intensity infections at baseline to 4.6% at one year86 | Very low prevalence at baseline87 | N/A | Low prevalence at baseline88 | N/A |
| Burundi (pilot) | Not reported (SCI reports very low baseline prevalence89 ) | N/A | 12.7% at baseline to 1.7% at four years90 | 20 epg91 at baseline to 1 epg at three years92 | 17.8% at baseline to 2.7% at four years93 | 16 epg at baseline to 24 epg at three years94 |
| Burundi (other schools) | Not reported (SCI reports very low baseline prevalence95 ) | N/A | 6.2% at baseline to 0.7% at three years96 | 8 epg at baseline to 3 epg at one year97 | 15.1% at baseline to 5.4% at three years98 | 15 epg at baseline to 8 epg at one year99 |
| Malawi | 9% at baseline to 5% at one year100 | No participants heavily infected at baseline; 4 epg at baseline to 2 epg at one year101 | Prevalence <2%102 | No participants heavily infected at baseline103 | Prevalence <1%104 | No participants heavily infected at baseline105 |
For the other two prominent soil-transmitted helminths, ascaris and trichuris, prevalence was low in the Niger and Malawi studies.106 In Burundi, prevalence of ascaris and trichuris decreased somewhat (though in a few cases there were temporary increases). Data from Burundi are given in the footnote.107
The studies also report results for other indicators of disease such as anemia. We omit discussion of these other indicators because they are more likely to be influenced by external factors than are prevalence and intensity (see our previous review of SCI for discussion of these indicators).
Limitations of the panel study data include:
- Monitoring of selected locations. It appears that, in the Niger and Burundi pilot studies, locations included in the study were selectively chosen rather than selected to be a representative sample of treated areas.108
- Low follow-up rates. Follow up rates were low in two of the three countries (at the first year follow-up, 89% in Niger, 33%-50% in the pilot survey and 53%-80% in the other schools survey in Burundi, and 52% in Malawi).109 To be included in follow up surveys, children must be present in school when the surveys are done.110 If those who are present in school are less likely to be infected than those who are not present, this could lead to overstating the impact of the program. The connection between infection status and absenteeism could be a direct relationship (infection could cause absenteeism) or an indirect one (a third factor, such as poverty, could cause both higher levels of infection – perhaps through poor sanitation infrastructure – and absenteeism).
- Issues with data collection in Malawi. In Malawi, an error in data collection may have resulted in prevalence being underestimated.111 In addition, certain data was not recorded and was inferred during data analysis.112
Internal monitoring: Coverage surveys
SCI has conducted surveys in Côte d'Ivoire, Malawi, and Uganda to determine what proportion of people targeted for mass drug administration received treatment. Surveyors visited randomly-selected households and asked the people targeted whether they had received treatment.113 SCI shared details on the methodology and results from the Côte d'Ivoire and Malawi studies. Coverage rates were high (>75%) in three of four districts surveyed in Côte d'Ivoire. In Malawi, coverage was high in one district and fairly low in the other. Coverage rates were low in Uganda.
The Côte d'Ivoire results are reasonably representative of SCI's work in the country. Sixteen districts were targeted for treatment. These were divided into four groups and there was a team responsible for overseeing the treatment program in each group of districts. For each group of districts, one of the four districts was randomly selected for the coverage survey.114
SCI told us that the Malawi survey was intended as a pilot to better understand the process for coverage surveys,115 and it did not intend for the Malawi results to be representative of the country as a whole. The coverage survey in Malawi was done in two districts, both in the southern region of the country. The districts were selected so the survey could measure both school-based and community-based treatment coverage. Community-based treatment was being piloted in three districts, and the coverage survey was done in two of those districts.116
For context, the World Health Organization recommends that treatment programs aim for coverage rates above 75%.117
Mass drug administration coverage among school-aged children in Malawi and Côte d'Ivoire118
| Country | District | Praziquantel coverage | Albendazole coverage |
|---|---|---|---|
| Côte d'Ivoire | Bouake Sud | 88% | 89% |
| Niakara | 87% | 87% | |
| Tiassale | 67% | 68% | |
| Tiebissou | 77% | 77% | |
| Malawi | Mangochi119 | 64% | 33% |
| Mulanje | 90% | 85% |
SCI also recently completed a similar coverage survey in Uganda. It has not yet shared full details and methodology from this survey. SCI told us that the Uganda survey found about 40% overall coverage, and that SCI is working to understand why coverage was low.120
In Zanzibar, the government undertook its own coverage survey, finding 91.9% coverage in Unguja district and 82.6% coverage overall in Pemba district.121 The survey in Zanzibar does not appear to have used SCI's standard protocol for coverage surveys, and we have not seen the details of the methodology used.122
The studies generally found poor coverage among adults and for school-aged children not enrolled in school.123 SCI has noted this trend and is taking some steps to respond to it.124
The fact that the surveys identified low coverage in several cases increases our confidence in their reliability.
Limitations of the coverage study data include:
- The coverage surveys in Côte d'Ivoire and Malawi were carried out three months after the treatment programs.125 We do not know how long there was between the treatment program and the coverage surveys in other countries. Intuitively speaking, the more time that passes, the less likely children are to remember accurately.
- Participants were asked a number of questions about the treatment program, including what they thought of the pills (praziquantel is very large and tastes bitter) and how many pills they took.126 Answers to these questions were not recorded, so the data is not available as a way to check the accuracy of the overall coverage results.127 SCI notes that these questions were asked to get an understanding of whether the respondents knew which drugs were being referred to and that the lack of results on these questions does not affect the overall coverage results.128
- SCI told us, "It can be difficult to get clear, accurate answers from young children (5-6 years old). Children, especially younger ones, may be influenced by others who are around during the survey. This is especially so because surveyors often interview older children first, in front of younger siblings."129
- Important data were missing from some of the survey forms.130
- In both Côte d'Ivoire and Malawi, if children in a household were not available then their parents were interviewed about whether the children had received deworming drugs. For Côte d'Ivoire, coverage reported by parents was lower than coverage reported by children. In Malawi, coverage reported by parents was similar to coverage reported by children. In Côte d'Ivoire, parents' answers were excluded from the reported results and in Malawi they were included in reported results. We do not see a compelling methodological reason for excluding these results in Côte d'Ivoire but not Malawi and note that this increases the overall reported coverage rates.131 About 9% of the responses in Cote d'Ivoire were from parents.132
Are SCI's monitoring results representative of its work overall?
The results discussed above are from a small portion of the countries SCI has worked in and represent different periods of SCI's work (details in this footnote133 ), so they may not be representative of SCI's work overall or of its recent work. In particular:
- It is our understanding that SCI has conducted, or planned to conduct, panel surveys in each of the countries it has worked in (at least 16 countries134 ). We have seen panel surveys from Niger (2004-2006), Burundi (2007-2010), Malawi (2012-2014), Uganda (2003-2005135 ), and Burkina Faso (2004-2005136 ) (though we only present results from the first three for the reasons discussed above). We have also seen baseline data for future panel studies from Liberia, Côte d'Ivoire, Zambia, Uganda, and Zanzibar (more below).
- We have seen results from coverage surveys from Côte d'Ivoire, Malawi, Uganda, and Zanzibar, with details for Côte d'Ivoire and Malawi only. SCI has indicated that it will produce coverage surveys in Liberia (2014), Tanzania (2014), Zambia (2014), Niger (2014), Mozambique (2015), Ethiopia (2015), and DRC (2015) as well. We have not yet seen results from these countries.137
It is unclear to us whether activities funded with unrestricted funds (the type of funding GiveWell has recommended) are monitored as well as activities funded by restricted grants (where SCI may have made specific commitments to report results). For the three countries that have received the most unrestricted funding, Mozambique, Ethiopia, and Côte d'Ivoire, we have not seen monitoring results for two and have seen results for the third. For Mozambique, SCI told us that baseline prevalence and intensity data was collected incorrectly and that SCI expected there to be a coverage survey for an earlier round of treatment, but it wasn't carried out.138 In Ethiopia, the program is at an early stage and baseline data collection is expected in late 2014.139 We have seen detailed baseline prevalence and intensity data and a coverage survey from Côte d'Ivoire. We have seen no results from countries that have received unrestricted funding and no DFID funding, such as Senegal, Zimbabwe, and Yemen. (We have asked SCI to share as much monitoring information as it is able, but have not specifically asked for results from Senegal, Zimbabwe, or Yemen.)
SCI also told us that it is sometimes unable to share results because third parties (e.g. governments, WHO, funders) often need to give permission before data can be shared and because it can take some time for data, once collected, to reach SCI because in some countries it is cleaned and analyzed by country program staff before being shared with SCI.140
Additional academic evidence
To provide additional information on SCI's track record, we conducted a search for published papers on treatment coverage rates and schistosomiasis and STH prevalence and intensity in countries where SCI has worked.
We focused on papers by Melissa Parker and Tim Allen, who were funded by the Bill and Melinda Gates Foundation to provide an anthropological perspective on SCI's work,141 papers cited in papers by Melissa Parker and Tim Allen, and other papers we identified on this topic from a Google Scholar search.142
The papers we identified were all from Tanzania, Uganda, and Zanzibar, perhaps because these are places that Melissa Parker and Tim Allen's work has focused on.
This spreadsheet summarizes the papers we considered. We have not fully vetted these studies. The studies were generally designed for purposes other than to evaluate SCI's programs so in many cases there is uncertainty about SCI's role in the areas studied. In the discussion below, we have excluded studies that we do not believe were conducted soon after treatment programs in areas targeted by SCI-funded programs.
SCI staff and/or SCI funding were involved in many of the studies.143
It is difficult to draw any conclusions from these studies because of small sample sizes and lack of clarity on SCI's role in each location. In summary:144
- Tanzania (excluding Zanzibar): Two studies at the district level, Stothard et al. 2013 and Chaula and Tarimo 2014, show relatively low schistosomiasis prevalence after treatment (4% and 15% respectively; the latter claims that prevalence pre-MDA was 30%). SCI was working in Tanzania at the time of both studies, but it is not clear if SCI was working in the specific areas studied. Chaula and Tarimo 2014 also shows low treatment coverage (around 40%), though the researchers asked in 2013 about treatment provided in 2011 and 2012.
- Zanzibar: All studies were conducted on Unguja, "the largest and most populated island of Zanzibar."145 Two studies, Stothard et al. 2009 and Rudge et al. 2008, each in a single school, found high prevalence of schistosomiasis in areas that had received treatment (50% and 65% prevalence, respectively). The sample sizes were small, it was not clear why these particular schools were selected, and, while SCI was working in Zanzibar at the time of both studies, but it is not clear if SCI was working in the specific areas studied. Another study, Knopp et al. 2009, in two schools in an area that had received treatment (but perhaps not from SCI) found moderate prevalence of various STHs (21% prevalence for hookworm and low infection intensity). The schools were selected because they had been surveyed in 1994, when prevalence was found to be much higher.
- Uganda: We reviewed three studies of schistosomiasis prevalence: Muhumuza et al. 2013 was conducted in part of a district that seems to have received several rounds of treatment (but perhaps not from SCI). Brooker et al. 2005 was conducted across a district that had its first MDA the year before, which was funded by SCI. Standley et al. 2009 was conducted across six districts, one district that had never been treated (but from which only one school, which had low prevalence, was included in the analysis), two districts that seem to have been treated only once, and three districts that seem to have been treated for many years by SCI. Standley et al. 2009 explicitly aimed to "ambush" schools that might not have been reached by treatment programs. Each study found moderate to high prevalence of schistosomiasis (Muhumuza et al. 2013: 35%, Brooker et al. 2005: 26%, and Standley et al. 2009: 42%). Muhumuza et al. 2013 and Standley et al. 2009 found fairly high infection intensity (116 and 634 average eggs per gram respectively among positive cases; the WHO threshold for "high intensity" is 400 eggs per gram146 ). Muhumuza et al. 2013 found 28% coverage in the most recent round of treatment. The coverage survey in Muhumuza et al. 2013 seems to have been six months after treatment.
Possible negative and offsetting impact
- Concerns over whether treatment was sustained: We believe it is important that deworming programs are sustained over time, as re-infection is rapid and a one-time treatment may have little long-term effect.147
SCI told us that it "is hesitant to use one-off donations to fund programs that couldn't be continued over the long run,"148
and seems to have a reasonable record of maintaining national programs over time.149
However, it is not clear to us (a) how likely some of the programs funded by individual donors are to be sustained after the first few years; (b) the extent to which SCI-funded programs have succeeded in treating the same children multiple times, as opposed to simply treating the same areas multiple times (and thus treating different children once each).
We remain unsure about how many treatments are needed to impact health. SCI told us that its views on what groups should be treated and how often "is largely based WHO recommendations, but also on government wishes and on intuition and common sense, though it usually works and SCI collects sufficient data to know when it isn't working. In general, in high endemicity areas re-infection is a major issue; in lower endemicity areas, a single treatment can be sufficient."150 One example of the variation in treatment patterns is what SCI told us about its program in Yemen:
SCI distinguishes between high, medium and low prevalence areas. In high prevalence areas, SCI treats the whole population once, and children for five years. In medium prevalence areas, SCI treats the whole population once, and children every other year. In low prevalence areas, SCI treats children every other year.151
- Displacement of government funding for deworming: This could be a concern if, due to SCI's spending on national deworming programs, government funds that otherwise would have been spent on deworming are spent on other, less worthwhile budget items. In the past, SCI has largely supported programs that did not exist before its support.152 We have not seen data on government spending on NTDs before and after receiving SCI support. Ethiopia's Neglected Tropical Diseases Program Manager told us that the government had not dedicated funding to schistosomiasis and that without SCI's involvement the program would likely not have gone forward.153
- Diversion of skilled labor: Drug distribution occurs only once or twice per year and appears to be conducted by teachers, community drug distributors (who receive minimal training to fulfill this role), and health center staff.154 Given the limited time and skill demands of mass drug distribution, we are not highly concerned about distorted incentives for skilled professionals.
- Popular discontent: We have heard a couple accounts of discontent in response to SCI's mass drug administration campaigns, including one case that led to riots.155
What do you get for your dollar?
We estimate that on average SCI delivers a schistosomiasis treatment for $1.23. There is significant uncertainty around this number. As discussed above, we have not seen a comprehensive picture of SCI’s expenses and are not confident in the data we have seen. Similarly, we have not seen comprehensive treatment data. Given this, we make a number of assumptions and judgments in interpreting the data that we have seen and this could introduce errors (which could potentially overstate or understate the actual cost, though we generally try to conservatively err on the side of counting fewer treatments and more costs). For example, we now believe that our previous analysis understated the cost by about 20% due to misinterpreting treatment numbers.156
SCI notes that it estimates its cost per treatment at $0.80.157 We have not seen details of how it calculated this estimate.
We discuss how the cost per treatment figure relates to how much it costs to improve a child's health and development at our report on mass treatment programs for schistosomiasis and STHs.
The remainder of this section discusses our cost per treatment analysis. Our calculations and sources are shown in more detail in this spreadsheet. We also discuss the prevalence and intensity of disease in the places SCI works, which we use to adjust our estimate of SCI's cost-effectiveness compared to the cost-effectiveness of the best-studied deworming programs.
Our approach
Our general approach to calculating the cost per treatment is to identify comparable cost and treatment data and take the ratio. We prefer to have a broadly representative selection of treatments in order to mitigate possible distortions, such as using data from a new program, which may have very high costs from mapping before it has delivered any treatments.
It is our understanding that SCI intends to treat for STHs in all places where it treats for schistosomiasis, so the treatments SCI reports can generally be interpreted as combination schistosomiasis and STH treatments,158 though we are aware of one case in which schistosomiasis-only treatments were delivered because there were insufficient supplies of drugs for STHs.159
To get the total cost, we attempt to include all partners (not just SCI) such that our cost per treatment represents everything required to deliver the treatments.160 In particular, we include these categories:
- SCI’s funding to country programs (e.g. to fund drug delivery)
- SCI’s headquarter costs (e.g. for management and technical salaries)
- Cost of drugs. We include the full market cost of all praziquantel that is needed to deliver the treatments, regardless of whether SCI purchased it or used donated drugs.
- Costs incurred by the government implementing the program (e.g. for staff salaries when working on treatment programs).
SCI notes that cost per treatment calculations should include sensitivity analysis161 – analysis on the degree to which the cost per treatment varies when various assumptions vary. We have not yet completed such an analysis.
Our analysis
We analyzed several sources of data, which cover different time periods, and developed a few estimates.
- SCI’s recent programs: $1.23 per treatment. The ICOSA program (the name for SCI's DFID-funded work) covers nine programs and has been funded primarily by SCI’s first DFID grant, with additional funding from unrestricted sources. We have seen data that we think provide a relatively comprehensive picture of spending and treatments over the first few years of the program (October 2010 - March 2013). We have not included the cost of research programs (which are funded separately) in these countries. It is possible that some of this research funding contributed to the treatments we are counting. A more conservative estimate, including about $1.8 million of research expenses in the same countries, is $1.33 per treatment.
- SCI projections: $0.82 per treatment. SCI shared with us projections for the remainder of the ICOSA program. These projections imply the cost per treatment is 35% lower than our estimate from the recent programs. We don't know what factors cause SCI to estimate a lower cost per treatment for future programs.
- SCI’s early programs: $1.37 per treatment. SCI previously shared with us a summary of the treatments it delivered and the costs it incurred during its early programs (from about 2003-2009). There is some ambiguity in the treatment data that we have interpreted conservatively (in other words, this estimate may be too high, as described in the footnote).162
Note that these estimates are in nominal dollars – we have not adjusted for inflation.
Each of these estimates has various methodological issues. We believe that these estimates give some sense of the range of what SCI’s cost per treatment may be, rather than a precise estimate of cost per treatment at any given time. We do not have a good understanding of why the estimates differ from each other. Our best guess is that analysis of the recent programs is most accurate, because, as far as we know, all treatments that it includes were funded by SCI, we capture all significant spending that was required to deliver these treatments, and the programs are sufficiently broad (nine programs across three and a half years of data with programs that have been running for different time periods) that they are unlikely be biased by any specific, unusual context.
Shortcomings of our analysis
While we believe the estimate described above is reasonable, we want to highlight specific reasons to interpret it with caution.
We rely on reported treatment data. Our understanding is that these data can overstate treatments.
We rely on an estimate that 30% of overall program costs are attributable to the government. We derived this from an analysis of a single program in Niger (this footnote elaborates on the details and concerns).163
We do not have data that indicate what proportion of drugs are wasted. We expect that in some cases drugs are purchased or donated but expire before use. We do not know how common this is. In our analysis, we have assumed that 10% of drugs are wasted, which increases the cost per treatment by about $0.05.
We simply estimate an average cost across programs and do not account for variations in different contexts. SCI told us that costs can vary significantly, for example, due to increased transportation costs.164
Baseline infection status
SCI's current and future programs may be less cost-effective than past programs or than programs discussed in our report on deworming because of lower baseline infection rates in current and future programs.
In 2014, SCI shared baseline data from countries it has recently started work in. We compare these rates to rates observed in the best evidence for the effectiveness of deworming, in order to understand how similar SCI's impact is likely to be to that observed in the studies. Schistosomiasis and STH prevalence and intensity in these countries was generally fairly low compared to the studies providing the best evidence for the benefits of deworming (Bleakley 2007, Croke 2014, and Miguel and Kremer 2004) and compared to some of SCI’s earlier panel studies (from Burkina Faso, Uganda, Niger, and Burundi).165
Baseline data was collected in schools that had been selected for panel studies. The baseline reports use methodologies that seem similar to the other SCI panel studies discussed above. With the exception of the study discussed above from Malawi, we have not examined how representative these schools are of the full treatment area or fully vetted the methodology used.
In Malawi an error in data collection may have resulted in prevalence being underestimated.166 In Zanzibar, treatment has been ongoing,167 so the study does not reflect pre-treatment conditions.
| Miguel and Kremer 2004 | Bleakley 2007 | Croke 2014 | Summary of SCI data from previous programs | Liberia | Malawi | Côte d'Ivoire | Zambia | Uganda | Zanzibar | |
|---|---|---|---|---|---|---|---|---|---|---|
| S. haematobium | - | - | - | Very low in two countries, 59% and 75% in two others | 20% | 10% | 5% | 10% | - | 4.3% in Unguja and 8.9% in Pemba |
| S. mansoni | 22% | - | 0% | 3%, 6-13%, and 42% in three countries | 26% | 2% | 13% | 2% | 6% | - |
| Hookworm | 77% | 32% | 55% | 15-18% and 51% in two countries | 15% | 0% | 17% | 11% | 15% | - |
| Miguel and Kremer 2004 | Croke 2014 | Summary of SCI data from previous programs | Liberia | Malawi | Côte d'Ivoire | Zambia | Uganda | |
|---|---|---|---|---|---|---|---|---|
| S. haematobium (eggs/10ml) | - | - | Burkina Faso: 94 | 42 | 4 | 4 | 14 | - |
| S. mansoni (epg) | 91 | - | Burkina Faso: 5, Uganda: 220 | 16 | 2 | 26 | 6 | 3 |
| Hookworm (epg) | 426 | 378 | Uganda: 309 | 5 | <1 | 57 | 27 | 24 |
| Summary of SCI data from previous programs | Liberia | Malawi | Côte d'Ivoire | Zambia | Uganda | |
|---|---|---|---|---|---|---|
| S. haematobium | Burkina Faso: 22.8% | 9% | 0% | 1% | 3% | - |
| S. mansoni | - | 0% | 0% | 2% | 0% | 0% |
| Hookworm | - | 0% | 0% | 0% | 0% | 0% |
Room for more funding?
For reasons discussed in detail below, it is difficult to predict how much additional funding SCI will be able to use productively in the next budget year (April 2015 to March 2016).171 Overall, we believe that SCI will likely have opportunities to spend or commit at least $3.8 million in the next year, and that it is possible, but less likely, that up to an additional $4.5 million (total $8.3 million) would enable SCI to undertake work that it would otherwise not be able to due to funding constraints. SCI currently has about $1 million of uncommitted, unrestricted funding that it could allocate to the opportunities we discuss below (though as we discuss above, there is a high degree of uncertainty in this figure).
Based on conversations with SCI, it is our understanding that:
- There are a few opportunities that SCI is likely to fund, if it has additional funding. In total, these opportunities would require about $3.76 million, of which we expect that about $2.72 million would be spent in 2015 and about $1.04 million would be held in reserve for 2016 to help ensure that programs could be maintained in the following year.
- SCI may have a number of other opportunities to support programs, though the possibility of other constraints leads us to believe these vary in likelihood from possible to highly speculative. In the unlikely scenario that all of the opportunities we assess (see below) were available to SCI, it could use an additional $4.5 million, of which about $1.7 million would be held in reserve for the following year.
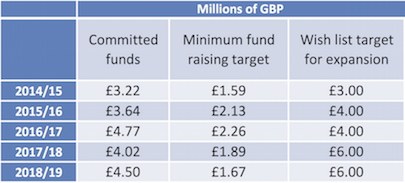
- SCI aims to raise at least $2.6 million and ideally $7.3 million by March 2015. It aims to raise at least $3.4 million and ideally $9.8 million in April 2015 to March 2016. We believe SCI's targets give a rough guideline for its overall room for more funding.
Below we explain the sources of uncertainty in these estimates and provide more detail on the specific opportunities SCI has described to us.
Sources of uncertainty
Overall, there is significant uncertainty in our expectations of how much additional funding SCI could use in the next year and how additional funding would be spent. We believe this is primarily due to SCI having limited ability to predict the opportunities it will have in the next year because of quickly changing circumstances in many countries. Country programs may face many different non-funding related constraints, and these seem hard to predict. For example, political unrest delayed the program in Côte d'Ivoire for 18 months,172 in 2014 SCI was not yet ready to allocate additional funds to Mozambique because of lack of confidence in the program's ability to scale further at that time,173 and the Ebola outbreak has delayed work in Liberia.174 Factors that can shift SCI’s planned uses of unrestricted funding include political unrest, expiring drug supplies, additional donated drugs becoming available, delays and budget changes due to coordination with other actors, results of disease mapping, and grants from other donors.175
Though we believe that quickly changing circumstances are the primary cause of uncertainty, challenges communicating with SCI on its room for more funding may also be contributing to our uncertainty. It appears that SCI does not have a clear, consistent process for making plans (and in particular, prioritizing between potential uses of funds) or for documenting plans. Because of this, our understanding is developed largely through conversations with SCI's leadership, supplemented with details from many other sources. Given the number of countries in which SCI works, it would be difficult for SCI's leadership to get all of these details accurate in this informal format. For example, SCI’s Director told us he expected a significant amount of additional unrestricted funding would be used in Côte d'Ivoire next year, while the program manager for Côte d'Ivoire noted that only a small portion of those treated in 2014 in Côte d'Ivoire will require treatment in 2015.176 Note that we do not have a strong view on whether SCI is making plans poorly; changing its planning process to make it easier for us to understand could be infeasible and might not lead to better decisions.
Comparing our conversations from last year to what happened since provides some context. In October 2014, SCI told us that if it had received an additional £1 million (about $1.6 million) at the beginning of 2014 it would have used the money to increase the size of each country's budget by 10-20%, which would have been used to make the programs more comfortable but would not have led to more treatments.177 In November 2013, SCI told us that it would likely use additional funding to fund two existing programs and to start two additional programs.178 SCI also told us that in one case it allocated £160,000 (about $250,000) to monitor another funder's treatment program at the urging of one of its program managers, a decision SCI leadership later acknowledged may have been a sub-optimal use of funds.179
Uses of additional funding
To better understand how SCI would use additional unrestricted funding, we had several conversations with SCI’s Director and program staff and also reviewed a variety of documents. Based on this, we list opportunities for SCI to use funding in the next year (including reserves it would likely hold for the following year) and categorize them by likelihood.
- Probable opportunities are those where it is likely that funding could be used productively because they are well understood and SCI believes they are less likely to be bottlenecked by other constraints. Generally, these are existing programs that are continuing at the same or a moderately increased scale.
- Possible opportunities are those where it is somewhat likely that there will be impediments to using additional funding. Generally, these are programs that are in an early stage of development and would have to develop quickly to make use of significant additional funding.
- Speculative opportunities are those which are unlikely to happen in the next year. In these cases, it is possible that having funding available could enable SCI to pursue them sooner than it would otherwise. Generally, these would be new SCI programs.
Note that the information in the below tables is drawn from a number of different sources and incorporates various guesses and assumptions. In particular, the total budget is often based off £0.15 in delivery costs per treatment, which SCI's Director suggested is a reasonable average but will vary by country, and the amount that SCI would choose to hold in reserve is assumed to be a fixed percentage (50%) of the amount spent in the next year,180 except in cases where we had more specific information. It is our understanding that the delivery cost per treatment does not include costs such as drugs (which are often donated or purchased through a separate fund), mapping/monitoring, or contributions by other partners. In addition to the opportunities explicitly discussed below, many programs could potentially scale up further (though are likely to encounter constraints to doing so); the most likely example of this is probably Ethiopia, which could use about $800,000 more than described below if the program expanded 1-2 years faster than currently planned. For more detail on sources and assumptions, see this spreadsheet.
| Country/Purpose | Available funding and expected treatments | Room for more funding | How additional funding would be used in 2015 |
|---|---|---|---|
| Strengthen already funded programs | N/A | $640,000 | Existing programs’ budgets are consistently squeezed, which may make the programs less effective or discourage workers who feel underpaid. SCI would like to provide some additional funding to make these programs more comfortable and sustainable. |
| Ethiopia | $682,019 to deliver 3.2 million treatments | $1,200,000 (of which $400,000 held in reserve) | Funding would be used to deliver an additional 3.8 million treatments (a significant scale-up from 2014). |
| Mozambique | $633,360 to deliver 3.1 million treatments | $1,200,000 (of which $400,000 held in reserve) | Funding would be used to deliver an additional 3.9 million treatments (to maintain the same scale as in 2014). |
| Malawi | $320,000 to deliver 5.6 million treatments | $720,000 (of which $240,000 held in reserve) | SCI believes Malawi needs additional funding to achieve its planned treatment numbers. It's not clear how many treatments Malawi would deliver without additional funding. |
| Total | $3,760,000 (of which, $1,040,000 held in reserve) | General strengthening of programs and delivering 7.7 million treatments in 2015 |
| Country/Purpose | Available funding and expected treatments | Room for more funding | How additional funding would be used in 2015 |
|---|---|---|---|
| DRC | $320,000 to deliver 1.3 million treatments | $480,000 (of which $160,000 held in reserve) | DRC expects to provide about 1.3 million treatments in 2014. SCI hopes to scale-up to 3-7 million per year within a few years. Here we've accounted for room for 1.5 million additional treatments. |
| Madagascar | No committed funding that we are aware of | $720,000 (of which $240,000 held in reserve) | This program is currently a pilot with plans to treat 1 million people by the end of 2014. In 2015, it will receive enough donated drugs to treat 3 million people. The budget here is to deliver all of the donated drugs. |
| Sudan | No committed funding that we are aware off | $1,120,000 (of which $560,000 held in reserve) | The country's first round of treatment is expected to reach 4.3 million people in early 2015 (this is already funded with existing unrestricted funds). It will receive enough donated drugs to treat 6 million in late 2015, and SCI believes it will be able to scale up to at least that size. This assumes that the government of Sudan matches funds that SCI provides, as it is doing for the early 2015 treatment round. |
| Tanzania | $208,000 to deliver 0.6 million treatments | $888,000 (of which $296,000 held in reserve) | Government capacity is currently limited, but it is possible that with more advocacy and training from SCI the program could scale up to deliver roughly 2.5 million additional treatments. |
| Total | $3,208,000 (of which, $1,256,000 held in reserve) | 13 million additional treatments in 2015 |
| Country/Purpose | Available funding and expected treatments | Room for more funding | How additional funding would be used in 2015 |
|---|---|---|---|
| Nigeria | None by SCI | $480,000 (of which $160,000 held in reserve) | With sufficient funding, SCI would consider starting discussions with Nigeria. In other countries where SCI has started new programs, it has allocated about $320,000 per year to start. This may be too low in Nigeria's case, given population size of the country. This funding would be used in part for mapping. We don't know how many treatments SCI might fund. |
| Senegal | None by SCI (except for monitoring and evaluation of a USAID-funded program) | $288,000 with about $96,000 held in reserve | Senegal has received a donation of drugs to treat about 0.8 million people. It is possible that SCI will be asked to provide funding to distribute these drugs. |
| Zimbabwe | None by SCI | $480,000 with about $160,000 held in reserve | Zimbabwe is interested in starting a program. It would be a challenging country for SCI to work with. In other countries where SCI has started new programs, it has allocated about $320,000 per year to start. We do not know how many treatments might be delivered with this funding. |
| Total | $1,248,000 (of which, $416,000 held in reserve) | Starting programs in Nigeria, Senegal, and Zimbabwe |
SCI funding targets
SCI shared its funding targets with us for 2014-2018 as of November 2014. It is aiming to raise at least an additional £1.6-2.3 million (about $2.6-3.7 million) per year. It would ideally like to raise £4.6 million in April 2014-March 2015 (about $7.4 million) and £6.1 million in April 2015-March 2016 (about $9.8 million).181
Note that in October 2014, SCI told us that with £4 million (about $6.3 million) it would probably start to save significant amounts as reserves for future years.182 We don't know what caused the change in its projections.
Possible sources of additional funding and drug donations
SCI appears to have had increased interest from large funders recently. The END Fund has recently made two grants to SCI, most notably, $1.9 million (USD) over three years for Ethiopia.183 A British fundraising organization and an oil company have both made moderate contributions (£100,000, or about $160,000, each) and could potentially contribute more. In the past, SCI has not actively fundraised from corporate or individual donors, but it is considering doing more by hiring someone to work on this or working with Imperial College's fundraising team.184 It is our understanding that SCI does not have major funding prospects for the next year, but that existing funders could make gifts that would reduce its room for more funding.
Merck KGaA has been increasing its donations of praziquantel (the drug used to treat schistosomiasis). It donated enough tablets to treat about 8 million people in 2011, raised this to 26 million in 2014, and plans to provide enough to treat 48 million in 2015 and 100 million in 2016.185
Global need for treatment
There appears to be a substantial unmet need for schistosomiasis treatment globally.
Globally, WHO estimates there are about 240 million people infected with schistosomiasis, with almost 90% of these in 20 countries (other than Yemen, these are all in Africa). SCI is involved in 14 of these countries, and there is at least some involvement from major funders (DFID, USAID, CIFF, and The END Fund) in each of the other six countries. The three largest burdens are in Nigeria, Ethiopia, and DRC (60, 22, and 18 million infections, respectively). It is estimated that in "2014/15" about 65 million treatments will be delivered in 12 of the 20 countries; data is missing for the other 8 countries, including Nigeria and Kenya, two of the largest.186 It is not clear to us what proportion of the total need this accounts for because the need is stated in terms of people infected, while treatments are delivered to all individuals in a targeted population which can include many non-infected individuals. However, the figures we have seem to indicate that only a small portion of those who require treatment are currently receiving it.
SCI as an organization
- Track record: SCI has consistently gotten national deworming programs to go through, as discussed above. We know fairly little about how effectively these programs have delivered treatments.
- Self-evaluation: SCI’s self-evaluation is strong compared to the vast majority of organizations we have considered. That said, this evidence is incomplete and has quite a few limitations. In addition, we differ strongly on the strength of the evidential case for deworming (see our 2012 post on deworming and the comments that follow it).
- Transparency: SCI has consistently been strong in its commitment to transparency. It has generally provided the information we’ve asked for and has never hesitated to share it publicly (unless it had what we felt was a good reason). It has allowed a lot of public dialogue that other charities may have been uncomfortable with.
- Communication: We don’t feel that SCI has ever purposefully been indirect with us, but we have often struggled to communicate effectively with SCI representatives, and we still are not as clear on some issues as we'd like to be.
More on how we think about evaluating organizations at our 2012 blog post.
Sources
- 1
"Objectives of SCI
- To encourage development of sustainable schistosomiasis and STH control programmes in sub-Saharan Africa.
- In the selected countries: to reach at least 75% of school-aged children (which in most countries would be from 6 to 15-year-old) and other high-risk groups with chemotherapy, namely PZQ and ALB; and thereby reducing prevalence and intensity of schistosomiasis and STH infections; as well as reducing schistosomiasis-related morbidity in high risk groups; and burdens due to STH infections in the targeted populations.
- To create a demand for sustained schistosomiasis and STH control.
- To promote access to anthelmintic drugs and good case management in the regular health system.
- To develop a rigorous monitoring and evaluation plan which will generate the information required to determine whether or not the objectives have been met."
Fenwick et al. 2009, Pg 3.
- 2
"The move towards national control programmes in sub-Saharan Africa was facilitated by an award from the Bill and Melinda Gates Foundation (BMGF; http://www.gatesfoundation.org) Global Health Program in 2002, to the SCI for the implementation and evaluation of control of schistosomiasis." Fenwick et al. 2009, Pg 2. Amount at Gates Foundation, Imperial College London (June 2002).
- 3
"Six countries were selected by October 2003 for full support: Burkina Faso, Mali, Niger, Uganda, Tanzania and Zambia. The countries each proposed a different implementation approach and management structure for their large-scale schistosomiasis control. This was readily accepted because the BMGF required SCI to test the ‘proof-of-principle’ of national scale, Ministry of Health (MoH)-led schistosomiasis control programmes. SCI is based in Imperial College London and operated with the principle that all programmes were country owned and run, with SCI staff offering technical and other assistance, but not as expatriates living in-country. Programmes were based in the MoH in the respective country, and SCI offered support to improve the national health system." Fenwick et al. 2009, Pg 2.
Between 2003 and 2008, SCI provided treatment for schistosomiasis and soil-transmitted helminths to the following number of people (Fenwick et al. 2009, Pg 3, Table 1).
Number treated by country (millions) Year Uganda Burkina Faso Niger Mali Tanzania Zambia 2003 0.43 - - - 0.10 - 2004 1.23 1.03 0.67 - 0.44 - 2005 2.99 2.30 2.01 2.60 2.95 - 2006 1.51 2.82 1.56 2.18 0.38 0.56 2007 1.81 0.75 2.07 0.65 2.65 0.25 2008 1.50 2.70 5.28 - 1.24 - - 4
"Current and future rounds of treatment in all six countries are being delivered in an integrated manner to include schistosomiasis, STH, lymphatic filariasis, onchocerciasis and trachoma." Fenwick et al. 2009, Pg 10. The "six countries" refers to the six countries funded by SCI's first Gates Foundation grant.
Countries and dates from SCI Board management accounts (April 2010) - 5
SCI Burundi: Impact
SCI Rwanda: Strategy
SCI Board management accounts (April 2010) - 6
- 7
- 8
"A team from Imperial College London has been awarded 25 million funding from the UK Government to continue its fight against neglected tropical diseases, it was announced this week. The money will enable the Schistosomiasis Control Initiative (SCI) to provide 75 million treatments to protect some of the world’s poorest children against schistosomiasis – an illness caused by parasitic worms – and soil-transmitted helminths (STH). £15 million of the funding will be spent directly on procuring drug treatments, through an organisation called Crown Agents. The rest will be administered by SCI." SCI Imperial initiative to protect children from tropical disease awarded ₤25m government backing.
- 9
”DFID has allocated 50 million GBP for control of neglected tropical diseases, of which 25 million is going through SCI for schistosomiasis control in 8 countries (including Malawi) over five years.” GiveWell's notes from visit to Malawi on October 17-19, 2011.
- 10
"SCI will be assisted in their drug delivery by the Centre for Neglected Tropical Diseases at Liverpool School of Tropical Medicine via a subcontract through LATH (Liverpool Associates in Tropical Health). In six countries, this will lead to treatment for lymphatic filariasis – another worm disease – becoming integrated with schistosomiasis and STH treatment." SCI Imperial initiative to protect children from tropical disease awarded ₤25m government backing.
- 11
- 12
- GiveWell's non-verbatim summary of a conversation with Alan Fenwick, SCI Director, June 17, 2010.
- SCI Summary sheet of treatments instigated and overseen by SCI.
- SCI Proposal by SCI, Imperial College to manage the Program for Integrated Control of Neglected Tropical Diseases in Côte d'Ivoire.
- Conversations with four program managers, discussed below.
- 13
"Prior to SCI’s work in Côte d'Ivoire, there were no large-scale schistosomiasis (SCH) treatment programs." GiveWell's non-verbatim summary of a conversation with Sarah Nogaro, October 16, 2014.
- 14
"SCI first contacted the government and started to discuss a SCH/STH program in 2010. A civil war delayed progress because there was political turmoil, a weakened health system, and dangerous conditions. In 2012 conditions improved, and the contracts between SCI and the Ministry of Health were set up. [...]
Treatments started in December 2012:- In 2012: 649,859 school-aged children (SAC) received treatments in 12 districts, some of which had been mapped prior to SCI’s involvement.
- In November 2013: 853,708 SAC received treatments in the areas that SCI mapped first, with the help of the Ministry of Health.
- In May 2014: 1,425,461 SAC received treatment in the remaining areas of the first phase of mapping.
- In November 2014: 3.5 million SAC are targeted for the next treatment, which would correspond to the second phase of mapping.
The aim is that by the end of 2014, all SAC in the SCH-endemic districts will have been treated at least once. Some areas that were treated in 2012 were also treated again in May." GiveWell's non-verbatim summary of a conversation with Sarah Nogaro, October 16, 2014.
- 15
"In May 2014: 1,425,461 SAC received treatment in the remaining areas of the first phase of mapping. In November 2014: 3.5 million SAC are targeted for the next treatment, which would correspond to the second phase of mapping." GiveWell's non-verbatim summary of a conversation with Sarah Nogaro, October 16, 2014.
- 16
"For the smaller donor, we have two or three projects, which we have been supporting and which will hopefully lead to pilot projects in their respective countries.
- In Côte d'Ivoire, we now have funding from the U.K. Department for International Development (DFID). There will eventually be a national program.
- In Mozambique, we have a doctor running a practice for 70,000 people. We have been funding her to test people, do surveys and give drugs to treat people. Up until now, that has taken all the individual funding that comes in."
Alan Fenwick, SCI Director, phone conversation with GiveWell, February 16, 2011.
- 17
- Vitol: Côte d'Ivoire mapping; £102,152; grant period: 01/10/2012 to 31/12/2013. (Pg 3). SCI advisory board financial report (June 2014).
- DFID ICOSA £177,000 in 2013-14. SCI advisory board financial report (June 2013).
- DFID ICOSA: £200,000 in year 5 of the grant (Pg 9). (The grant is "A six year contract from October 2010 to March 2016," (Pg 7) and DFID's fiscal year is from April 1 to March (DFID glossary), so year 5 is April 2014 to March 2015.) SCI advisory board financial report (June 2014).
- SCI has reported $525,264 in spending in Côte d'Ivoire from unrestricted funds between November 2011 and September 2014. GiveWell summary of SCI finances (October 2014), Sheet Combined with previous updates.
As of November 4, 2014, Google states that £1 is worth $1.6.
- 18
"If the 2014 targets are met, it will be an impressive achievement to have treated all SCH-endemic areas at least once since 2012. With just the funding allocated by DFID, the program could not have scaled up as quickly. In this scenario, it probably would have completed the mapping but delivered fewer treatments." GiveWell's non-verbatim summary of a conversation with Sarah Nogaro, October 16, 2014.
- 19
"SCI conducted national mapping since late 2012, finishing in March 2014. In total, all 82 districts in Côte d'Ivoire were mapped. This was done in two phases because of limited funding. The first phase was done by the Ministry of Health with support from SCI. The second phase was led by Professor Eliézer N’Goran from the Université Félix Houphouët-Boigny with both technical and financial support from SCI. […]
The country will start an integrated treatment program for several diseases in November 2014 […]
Other neglected tropical disease (NTD) organizations have benefitted from the work SCI has done to build a SCH program. SCI has provided cars and developed staff capacity. Organizations have worked to coordinate when sharing these resources and operating an integrated program should make that easier." GiveWell's non-verbatim summary of a conversation with Sarah Nogaro, October 16, 2014. - 20
GiveWell's non-verbatim summary of a conversation with Sarah Nogaro, October 16, 2014.
- 21
"Dr. Nogaro has visited Côte d'Ivoire several times over the last year, often dealing with multiple activities on each trip:
- One month last November to oversee the sentinel sites activity and obtain baseline information for both prevalence and intensity of infection, help with the MDA, and oversee the start of the second phase of mapping,
- One month in January to work on the coverage survey, work on financial reporting, oversee mapping, and help with drafting the annual work plan and budget (alongside the Ministry of Health),
- Three weeks in May for another MDA,
- One week in June to work with WHO and other partners for the integrated MDA plan and budget work, and
- Three weeks this month to follow up with CHWs in low coverage areas, oversee the sentinel sites activity, and oversee the first integrated MDA and training."
GiveWell's non-verbatim summary of a conversation with Sarah Nogaro, October 16, 2014.
- 22
"Program staff in each country create annual budgets in collaboration with SCI. The budget ensures money is being spent well and on activities defined in the annual work plan, which is submitted by the country to SCI. Generally, receipts are used to document expenses. In some cases, it takes a long time to get the receipts or receipts are not available at all. SCI hired an accountant and an auditor to better monitor finances." GiveWell's non-verbatim summary of a conversation with Sarah Nogaro, October 16, 2014.
- 23
"Data is entered at the country level. For example, data from mapping and sentinel sites can be handled by students at a local university. The data is double entered to ensure accuracy. The original forms stay in the country and the database is sent to SCI, which can then run analyses. SCI is planning to expand its data analysis team. In the spring, SCI’s biostatistician will teach a data cleaning session to program staff in Côte d'Ivoire. In the future, SCI will consider doing more advanced data analysis training in all the countries it supports." GiveWell's non-verbatim summary of a conversation with Sarah Nogaro, October 16, 2014.
- 24
"In 2007, prior to SCI’s involvement, Save the Children ran a one-time treatment for about 1 million children for schistosomiasis (SCH) and soil-transmitted helminths (STH)." GiveWell's non-verbatim summary of a conversation with Michael French, October 15, 2014.
- 25
"In mid-2012, the University of Gondar invited SCI to an international symposium on SCH, which served as an introduction for SCI to Ethiopia. After this, Dr. Fenwick, Director of SCI, and other senior SCI staff established a relationship with senior Federal Ministry of Health (FMOH) officials.
In 2013, SCI moved into more serious conversations with the Ministry of Health. In July 2013 SCI provided support for the launch of the FMOH’s National NTD Master Plan at an international symposium in Addis Ababa. Around the same time, SCI collaborated with the Ethiopian Health and Nutrition Research Institute (EHNRI; now renamed as the Ethiopian Public Health Institute), the technical arm of the FMOH, to plan and fund nationwide mapping. […]
Last year (2013) SCI funded 1.4 million combined SCH/STH treatments. […]
The mapping took longer than planned. Teams were trained in November 2013, and the mapping was completed in April 2014." GiveWell's non-verbatim summary of a conversation with Michael French, October 15, 2014. - 26
"An overview of the historic and planned treatments:
- Last year (2013) SCI funded 1.4 million combined SCH/STH treatments.
- This year (2014) there have not been any SCH treatments. The END Fund has funded the FMOH to provide STH treatment in areas where there is no SCH infection. The final treatment numbers have yet to be released, but Dr. French believes around 6-7 million children will be treated. First, two regions(Amhara, Oromia) were treated in June. In October or November, one further region (SNNPR) will receive treatment. SCI is not directly involved, but the program is using the mapping data EPHI collected (in partnership with SCI)to decide where to treat.
- Between now and the end of March, there will be 3.6 million combined SCH/STH
- In the following year, 7 million combined SCH/STH treatments are planned.
- Beyond that, plans include 10 million treatments in the following year and then, for the 2 following years, 15 million treatments, which would be approximately full scale for SCH. A full-scale program for STH probably requires about 30 million treatments."
GiveWell's non-verbatim summary of a conversation with Michael French, October 15, 2014.
- 27
GiveWell summary of SCI finances (October 2014), Sheet Combined with previous updates. We discuss SCI's work in Ethiopia in our November 2012, October 2013, and June 2014 updates on SCI.
- 28
This is based on our understanding of the timeline of events in Ethiopia (see footnote for 'History' bullet in this section) and understanding that restricted funding from END Fund and DFID did not become available until 2014:
- "Getting sufficient funding from SCI this year was straightforward because it was primarily restricted funding from the END Fund. The first year of this 3-year grant ends in February 2015." GiveWell's non-verbatim summary of a conversation with Michael French, October 15, 2014.
- We note in our June 2014 update on SCI that, as of April 2014, SCI was in the final stages of negotiating the grant from DFID that includes funding for Ethiopia.
- 29
"He does not know if The END Fund/DFID would have gotten involved without the mapping data. At a minimum, the mapping effort significantly increased the probability of attracting external funding and accelerated the program by a few years." GiveWell's non-verbatim summary of a conversation with Michael French, October 15, 2014.
- 30
"FMOH [Federal Ministry of Health] began working with SCI about 2.5 years ago. Mr. Shafi's predecessor began speaking to SCI about the possibility of working together on a schistosomiasis program. SCI was the only organization that the government spoke to about this, as it wasn't aware of any other organizations working on schistosomiasis. [...]
Without SCI's involvement, the program would likely not have gone forward. With the exception of filling small funding gaps on an ad hoc basis, the government has not been able to allocate funding to NTDs. It was interested in doing disease mapping but did not have the funding to do so, and it likely would not have received drug donations without the mapping data." GiveWell's non-verbatim summary of a conversation with Oumer Shafi, November 4, 2014. - 31
"In July 2013 SCI provided support for the launch of the FMOH’s National NTD Master Plan at an international symposium in Addis Ababa. Around the same time, SCI collaborated with the Ethiopian Health and Nutrition Research Institute (EHNRI; now renamed as the Ethiopian Public Health Institute), the technical arm of the FMOH, to plan and fund nationwide mapping. […]
The Deworm the World Initiative (DtWI) will be providing technical advice to Ethiopia, based on its experience in Kenya. […]
With funding from Dubai Cares, the Partnership for Child Development (PCD) implemented a small pilot program in 30 schools in the southern region (SNNPR) to look at feasibility of a comprehensive school health and nutrition program, which includes deworming, nutrition, and WASH [water, sanitation, and hygiene] interventions and home-grown school-feeding. Related to this, the grant included funding for a region-wide situational analysis, covering an area with about 17 million people. Therefore, the decision for this to be included in the broader national mapping and to include the distribution of SCH, STH, WASH facilities, and school-feeding needs. SCI and PCD partnered on the design, implementation, and analysis of this national mapping. Overall, PCD provided both technical assistance and about 20%-25% of the funding for the national mapping." GiveWell's non-verbatim summary of a conversation with Michael French, October 15, 2014. - 32
"Examples of Dr. French's work to assist the Ethiopia program:
- Initial program setup activities: creating processes and scheduling meetings to lay groundwork for future activities; developing and finalizing contracts between funders, Imperial Collage [sic] and implementers (the contracts are more complicated than normal because there are 2 funders and 2 implementing agencies).
- SCH/STH action plan: This will provide a detailed plan for next 12 months and more general plan for 5 years. The FMOH have tasked Dr. French and SCI to drive this this forward, e.g providing an outline that can be adapted by the country.
- Mapping plan: Dr. French was the main technical advisor from SCI. He worked very closely with people from EHNRI to a) write the research protocol, b) advise on the recruitment of trainers, and c) train technicians, d) supervise activities, e) help with data collection and analysis.
- Last year’s mass drug administration (MDA): Dr. French was less involved with the MDA than with the mapping but was involved in developing the plans. The Ministry of Health was responsible for running the program and delegating work to regional governments. It had experience from other mass distribution programs. For technical training, it worked with health workers who already had extensive general experience and then provided NTD expertise largely from WHO guidelines, though SCI provided some technical guidance.
Dr. French has been living in Ethiopia, which has helped him build relationships, enabled him to hear more activity details, and allowed him to provide timely advice. For example, he has stronger relationships with the officials in Ethiopia and a clearer sense of whom to go to for various requests. Also, by being close to the activities, some problems with data flowing back to central level have been clearer, which makes it easier for him to help develop solutions." GiveWell's non-verbatim summary of a conversation with Michael French, October 15, 2014.
- 33
"Mike French, SCI's program manager for Ethiopia, works in the same office as the government NTD program." GiveWell's non-verbatim summary of a conversation with Oumer Shafi, November 4, 2014.
- 34
"Prior to SCI’s involvement in 2010, there was a mapping project in 2008. Dr. Blair does not think there were any schistosomiasis (SCH) treatment programs (other than a small program funded by SCI). If there were, they would have been small-scale." GiveWell's non-verbatim summary of a conversation with Lynsey Blair, October 16, 2014.
- 35
"The SCH program in Mozambique is run by the Center for Neglected Tropical Diseases (CNTD). Funding for the program is provided to SCI by DFID, and SCI funds CNTD as part of its agreement with DFID." GiveWell's non-verbatim summary of a conversation with Lynsey Blair, October 16, 2014.
- 36
“When we bid for the DFID grant, I was advised that DFID favored grants that involved partnerships. CNTD does a lot of the work on lymphatic filariasis. DFID was providing 20 million pounds for lymphatic filariasis and 20 million for schistosomiasis. Working with CNTD demonstrated a degree of integration. CNTD does both lymphatic filariasis and schistosomiasis in Mozambique." Alan Fenwick, SCI Director, conversation with GiveWell, October 14, 2014.
- 37
SCI report to GiveWell (September 2014), Annex 1.
- 38
- DFID ICOSA £649,514 in 2013-14. SCI advisory board financial report (June 2013), Pg 7, “Overseas country budgets - FY4.”
- DFID ICOSA: £150,000 in year 5 of the grant (Pg 9). (The grant is "A six year contract from October 2010 to March 2016," (Pg 7) and DFID's fiscal year is from April 1 to March, so year 5 is April 2014 to March 2015.) SCI advisory board financial report (June 2014), Pg 9.
- SCI has reported $2,085,118 in spending in Mozambique from unrestricted funds between November 2011 and September 2014. GiveWell summary of SCI finances (October 2014), Sheet Combined with previous updates.
As of November 4, 2014, Google states that £1 is worth $1.6.
- 39
"In January 2011, SCI were awarded three SCORE studies
TITLE: Studies of Gaining and Sustaining Control of Schistosomiasis- Study: Schistosoma haematobium: Gaining and Sustaining Control of Schistosomiasis in Capdelgado, Mozambique
- Study: Schistosoma haematobium: Gaining and Sustaining Control of Schistosomiasis in Kollo and Say Districts, Niger
- Study: Schistosoma Haematobium: Gaining and Sustaining Control of Schistosomiasis in Loga District, Niger."
SCI advisory board financial report (June 2014), Pg 16.
As of June 2014, SCI had spent £366,937 of the £368,030 by SCORE, and expected to receive an additional $368,229. SCI advisory board financial report (June 2014), Pgs 4-5. - 40
See our June 2014 update on SCI.
- 41
"SCI and CNTD are working closely with RTI International in Mozambique. This has been a great working relationship. RTI is funding some capacity development around drug logistics. It is working on trachoma; currently, this work is focused on mapping, but it will likely fund treatment when mapping is finished. RTI has staff in-country and reports to SCI and CNTD on issues, which can provide some verification that the program is progressing as expected. The organizations coordinate to ensure multiple sources of funding aren't allocated for the same purpose. For example, RTI emailed SCI and CNTD saying that the government had indicated that it was going to drop the SCH program; the staff from the organizations communicated quickly to sort out the confusion." GiveWell's non-verbatim summary of a conversation with Lynsey Blair, October 16, 2014.
- 42
"The SCH program in Mozambique is run by the Center for Neglected Tropical Diseases (CNTD). Funding for the program is provided to SCI by DFID, and SCI funds CNTD as part of its agreement with DFID. [...] CNTD will continue to run the mass drug administration (MDA), but SCI has become more directly involved with the M&E as it has the technical expertise to manage these activities." GiveWell's non-verbatim summary of a conversation with Lynsey Blair, October 16, 2014.
- 43
"SCI’s program in Uganda is fully funded by DFID (other than one use of unrestricted funding, discussed below). SCI had previously worked in Uganda with funding from the Bill & Melinda Gates Foundation. After this funding ended, USAID funded work by RTI International in Uganda. Around 2006, Uganda started an integrated NTD program in districts endemic with more than one NTD. Districts with only schistosomiasis (SCH) were not treated.
When SCI re-entered Uganda, it started SCH programs in the districts not receiving treatment." GiveWell's non-verbatim summary of a conversation with Yolisa Nalule, October 14, 2014. - 44
SCI report to GiveWell (September 2014), Annex 1.
- 45
- DFID ICOSA £138,386 in 2013-14. SCI advisory board financial report (June 2013), Pg 7.
- DFID ICOSA: £58,994 in year 5 of the grant (Pg 9). (The grant is "A six year contract from October 2010 to March 2016," (Pg 7) and DFID's fiscal year is from April 1 to March, so it's our under year 5 is April 2014 to March 2015.) SCI advisory board financial report (June 2014), Pg 9.
As of November 4, 2014, Google states that £1 is worth $1.6.
- 46
"SCI’s program in Uganda is fully funded by DFID (other than one use of unrestricted funding, discussed below)...
In deciding on the budget, there might be some disagreement around whether impact M&E (having sentinel sites) is worth the expense. The government might prefer to provide more treatments. Mrs. Nalule and other researchers argue for the value of M&E.
Last year, M&E funding was augmented by £23,000 from SCI unrestricted funding. Without this, there likely would have been cuts in the number of sentinel schools. This M&E is enabling research to compare different treatment strategies in areas where prevalence is low. DFID was not interested in funding this research." GiveWell's non-verbatim summary of a conversation with Yolisa Nalule, October 14, 2014.
Note that SCI has only reported $2,220 in unrestricted spending to us in financial reports. GiveWell summary of SCI finances (October 2014), Sheet Combined with previous updates. - 47
"When SCI re-entered Uganda, it started SCH programs in the districts not receiving treatment. Also, in about 30 districts, USAID stopped treating SCH because prevalence dropped below 20%, so SCI supported the continuation of these treatments with an aim towards elimination. […]
Also, SCI is taking over treatment from RTI in a 15 districts that have higher prevalence, and, in these districts, it will treat adults. Since prevalence is over 50%, WHO guidelines say to treat children and high risk adults (e.g. fisherman), though usually programs will just try to treat all adults." GiveWell's non-verbatim summary of a conversation with Yolisa Nalule, October 14, 2014. - 48
"In some cases (for example, Uganda and Niger), the government program manager understands SCH well and does not require a lot of technical guidance. [...] Uganda is an interesting example. The program had been relatively straightforward to manage. It is now focusing on elimination, which is unknown territory so will require much more guidance. There is a lot of research to do to determine guidelines for how often to treat." GiveWell's non-verbatim summary of a conversation with Lynsey Blair, October 16, 2014.
- 49
GiveWell's non-verbatim summary of a conversation with Yolisa Nalule, October 14, 2014.
- 50
- 51
SCI shared two other sources with similar information over different time periods:
- SCI shared monthly data on spending from its grant from DFID, broken down into Management Personnel, Technical Personnel, Management Travel, Technical Travel, Technical reimbursable, Programme Expenses, and two forms of VAT. It appears to us that the total spending in some months is calculated incorrectly: in some months, a pre-tax subtotal is summed along with the individual components, and in other months, it appears that one of the forms of VAT is excluded from the total. If we are correct about these errors, then we calculate the percent spent on salaries and travel expenses for management and technical staff as about 43% of total DFID grant spending over October 2010 to April 2014. We haven't used this estimate because we are unsure about our interpretation of this spreadsheet, but note that the overall estimate (43% vs 48%) is similar. We have assumed that 'salaries and travel expenses for management and technical staff' includes Management Personnel, Technical Personnel, Management Travel, Technical Travel, and Technical reimbursable. We're also unsure whether this source includes all spending in DFID-funded countries, or only costs funded by DFID. SCI board financial details (June 2014), Sheet All monthly invoices.
- Another source for the breakdown between management/technical and program expenses is a budget for SCI's DFID phase 2 grant (2014-2018). This budget is broken down into 'fees' (sum of management and technical fees = £6,061,766) and 'program expenses' (sum of travel & subsistence and technical reimbursable = £14,183,843), making 'fees' about 30% of the total. We don't know how to interpret this breakdown because our prior breakdown included travel in the total for management/technical and we would have guessed that 'technical reimbursable' would also be included in management/technical. In the source discussed in the paragraph above, 'technical reimbursable' accounted for less than 1% of the total, while in this source it accounts for about 66%, leading us to believe that it may be mislabeled in this source. SCI advisory board financial report (June 2014), Pg 11.
- 52
Under SCI's agreement with DFID, CNTD is a sub-grantee of SCI. CNTD uses these funds to manage combination lymphatic filariasis, schistosomiasis, and STH treatment programs in Mozambique, Zambia, and Liberia. GiveWell's non-verbatim summary of a conversation with Lynsey Blair, October 16, 2014.
- 53
SCI report to GiveWell (September 2013), Pgs 2-3.
- 54
Data from:- SCI Niger spending data (October 2011 to May 2013).
- SCI Tanzania spending data (March 2011 to July 2013).
- SCI Uganda spending data (September 2011 to August 2013).
- SCI Malawi spending data (November 2011 to August 2013).
Summarized in: GiveWell analysis of SCI spending under DFID grant.
- 55
Kieran Bird, SCI Finance Manager, conversation with GiveWell, October 16, 2014.
- 56
SCI report to GiveWell (September 2014), Annex 1.
GiveWell summary of SCI finances (October 2014), Sheet Combined with previous updates. - 57
Data from:
- Breakdown between SCI/CNTD spending and country budget spending from: SCI report to GiveWell (September 2013), Pgs 2-4.
- SCI Niger spending data (October 2011 to May 2013).
- SCI Tanzania spending data (March 2011 to July 2013).
- SCI Uganda spending data (September 2011 to August 2013).
- SCI Malawi spending data (November 2011 to August 2013).
Summarized in: GiveWell analysis of SCI spending under DFID grant.
- 58
As of July 2011, it had received about $580,000 in unrestricted funding (SCI IC Trust summary (September 2011)) and $108 million overall (SCI Gates Foundation final report (January 2011) Pg. 20).
- 59
"For the smaller donor, we have two or three projects, which we have been supporting and which will hopefully lead to pilot project in their respective countries.
- In Côte d'Ivoire, we now have funding from the U.K. Department for International Development (DFID). There will eventually be a national program.
- In Mozambique, we have a doctor running a practice for 70,000 people. We have been funding her to test people, do surveys and give drugs to treat people. Up until now, that has taken all the individual funding that comes in."
Alan Fenwick, SCI Director, phone conversation with GiveWell, February 16, 2011.
- 60
Donations due to GiveWell's research through 2013 are listed here. In February through August 2014, we tracked $619,000 to SCI, including funds that GiveWell allocated to SCI from its general regranting funds. In November 2014, we were informed by a donor who gave $540,000 to SCI that his or her gift was due to GiveWell. Summarized in GiveWell summary of SCI finances (October 2014), Sheet Due to GiveWell.
- 61
$6.2 million in funds spent + $2.8 million in funds committed + $1 million in uncommitted funds - $5.3 million tracked by GiveWell = $4.7 million in other revenue
- 62
Kieran Bird, SCI Finance Manager, conversation with GiveWell, October 16, 2014.
- 63
Kieran Bird, SCI Finance Manager, conversation with GiveWell, October 16, 2014.
- 64
"The report required an adjustment to the tab 3, page 6 of the narrative - total funds (including committed funds). The draw downs from the IC Trust reserves are not solely into the P10099 account but also include significant donation draw downs for specific country programmes e.g. [donor name] for Malawi, into other designated P accounts. Other private donations from [donors' names] have also been received into the IC Trust, as opposed to IC (the College) which direct funds to the L24009 account. As we have included these donations in the unrestricted funds total of the IC Trust, we need to capture their available balance too." Kieran Bird, SCI Finance Manager, email to GiveWell, November 4, 2014.
- 65
“SCI has recently hired a new staff member to address this.” Alan Fenwick, SCI Director, conversation with GiveWell, October 15, 2014.
- 66
- In our November 2012 update on SCI (see footnote 1 of that report), we noted inconsistencies in the spending data SCI shared with us. In one case, we asked SCI about a discrepancy we have noticed and SCI's reply was implausible.
- In our next update on SCI, in October 2013, we reported having a fuller view of how SCI had spent funds, though noted a discrepancy in funds held: "We reported (after checking this number with SCI) that as of October 2012, SCI held $2.65 million in unrestricted funds. As part of this update, we sought to understand SCI's use of unrestricted funds between October 2012 and August 2013. SCI told us that it had held $1.96 million in unrestricted funds as of October 1, 2012, about $660,000 less than we previously thought. We have assumed that we miscommunicated with SCI last year; one possibility is that the numbers we received included some restricted funds and we may not have fully excluded all restricted funds in our adjustment. We have used the more recent figure for this update."
- In October 2014, SCI shared reports of spending since our last update and balance of unrestricted funds at the end of the period. Combining these figures with our previously published figure for balance of unrestricted funds as of our last update implied negative revenue over the period. We asked SCI to explain the discrepancy. SCI first told us that the discrepancy was due to counting some restricted funds in the unrestricted balance. At the same time, SCI provided data on unrestricted revenue over the period, giving us a double check on these figures. There was a discrepancy between actual revenue and revenue implied by the starting and ending balances and spending over the period of about £528,000. When we asked SCI about this discrepancy, SCI told us that there was an additional expenditure of £595,420 that was missing from the report previous, as well as a small amount of additional income, which reduced the discrepancy to £11,651.
- 67
GiveWell summary of SCI finances (October 2014), Sheet Assets.
- 68
SCI provided a list of "draw downs" with available balances, some of which are restricted grants. We are unclear how to interpret this information because we do not know how these balances relate to the other financial information SCI has sent us, which of the funds SCI listed are restricted and which are unrestricted, and whether this list includes all restricted funds held in accounts with unrestricted funds.
- 69
Data from SCI report to GiveWell (September 2014). Analyzed in GiveWell summary of SCI finances (October 2014), Sheet Summary.
- 70
GiveWell's internal records. This was a gift that was influenced by GiveWell and the donor reported it to us.
- 71
As of November 2013, GiveWell had not yet granted funds received in the third quarter to SCI. We estimate that this grant will be at least $153,000. Additional funds may be allocated to SCI out of the about $115,000 that GiveWell received for regranting to top charities in the third quarter.
- 72
Calculation in GiveWell summary of SCI finances (October 2014), Sheet Summary.
- 73
GiveWell summary of SCI finances (October 2014), Sheet Combined with previous updates.
- 74
SCI's summary of active accounts as of June 2014 lists six research grants totaling £2.6 million, or about $4.1 million over 2010-2014. SCI advisory board financial report (June 2014), Pg 5.
- 75
"Once we have people that want to give at least $100,000, we talk to them directly. [...]
[Someone] was interested in Uganda. So, we identified islands there in Lake Victoria that are relatively accessible and provided treatments there."
Alan Fenwick, SCI Director, phone conversation with GiveWell, February 16, 2011.
SCI advisory board financial report (June 2014), Pg 3 notes programs in Burundi, Rwanda, Côte d'Ivoire, and Yemen have spent:- Schistosomiasis and STH in Burundi: £1,062,156, June 2011 to May 2013. Funded by a private donor.
- Rwanda Phase II programme: £579,297, March 2012 to February 2015. Funded by the END Fund.
- Côte d'Ivoire mapping: £102,152, October 2012 to December 2013. Funded by Vitol.
- Yemen: £91,673, March 2013 to May 2014. Funded by the END Fund.
- 76
"Once we have people that want to give at least $100,000, we talk to them directly. [...]
Someone wanted to do something special with his money, so we're doing hydrocele surgery in Niger. He gave us $200,000 and we told him we could do ~1000 hydrocele surgeries.Alan Fenwick, SCI Director, phone conversation with GiveWell, February 16, 2011.
Alan Fenwick, SCI Director, phone conversation with GiveWell, September 15, 2011. Note: "SCI generally doesn't do water and sanitation programs because of the expense. In Burundi they're doing water and sanitation programming because they have been successful there with running a program and treating schistosomiasis, but soil-transmitted helminth infections remain persistent." GiveWell's notes from visit to Malawi on October 17-19, 2011. - 77
Tohon et al. 2008. In 2014, SCI sent us a more recent report, SCI Niger panel study 2011. SCI Niger panel study 2011 is our only source of data on the second to fifth year followups. This analysis excludes three of the eight schools that were originally in the study as well as the 56% of participants lost to follow-up in the remaining five schools. Participants who were followed up for some years but lost to follow-up by the end of the study are completely excluded rather than being included in a separate analysis of the earlier follow-ups. The 3 schools were apparently dropped because they were not surveyed in some years:
- "Of these eight sentinel sites, five had data available in all six years of the study up to 2010." SCI Niger panel study 2011, Pg 19.
- "455 out of 1024 (44%) children recruited at baseline from November 2004 to April 2005 were successfully followed up for the full duration of the 6-year sentinel site monitoring." SCI Niger panel study 2011, Pg 25.
For this reason, we feel that the results from SCI Niger panel study 2011 are hard to interpret, and we don't present them here, relying instead on Tohon et al. 2008.
- 78
We have seen two reports on the Burundi study, Styles 2011 and Koukounari 2011, which use different methods of analysis and included different numbers of participants. Which individuals they included in their analyses is not always clear, however the fact they report similar results for prevalence provides some evidence that the results are not highly dependent on these choices. (Both Dr. Koukounari and Dr. Styles are statisticians who formerly worked at SCI.)
- Pilot study: Styles 2011 and Koukounari 2011 have strengths and weaknesses in defining the sample for the pilot study. Styles 2011 includes a much larger number of individuals (Styles 2011, Pg 3, Figure 1b compared to 710 in Koukounari 2011, Pg 7, Figure 2). However, it is unclear whether the individuals in the follow-up were all in the original cohort or whether some were added to the sample later. The two reports indicate different numbers of students included in the study and retraced at each followup. We have seen two explanations for the differences:
(1) "Dr. Koukounari only included students who were in first grade during the first year of the study and who were successfully surveyed every year of the study. In addition to the children counted by Dr. Koukounari, Dr. Styles included students who entered first grade and were added into the study in subsequent years, as well as students who were missing data from some years. Each of these strategies for data analysis has benefits and drawbacks. SCI initially planned to do a cross-sectional evaluation of sixth grade students every year, because each year the current sixth grade class would have received more rounds of treatment over the course of elementary school than the previous year. SCI did not complete this plan, but Dr. Koukounari included the data from the sixth grade students in the baseline data. Dr. Styles did not include this data." GiveWell's non-verbatim summary of a conversation with Giuseppina Ortu on June 20, 2014.
(2) "In addition to the longitudinal studies at each follow-up newly recruited children were added to these surveys. At 1st follow-up (2008) 2288 newly recruited children were added to these surveys with range age: 6-21 years old and median age: 12 years old. Of these 2288, only 210 i.e. (9.18 %), were of age 6 and eligible to be included in the specific cross sectional data analysis. At 2nd follow-up (2009) 2311 newly recruited children were added to these surveys with range age: 5-20 years old and median age: 11 years old. Of these 2311, only 160 i.e. (6.92 %), were of age 6 and eligible to be included in this specific data analysis. Finally, at 3rd follow-up (2010) 2224 newly recruited children were added to these surveys with range age: 6-20 years old and median age: 12 years old. Of these 2224 only 189 i.e. (8.50 %) were of age 6 and eligible to be included in this specific data analysis." Koukounari 2011, Pg 6. Koukounari 2011 notes that it only includes the 20% of participants in the pilot study who were tracked through all follow-ups: "Finally at 3rd follow-up (2010) there were 713 children successfully followed-up (i.e. follow-up rate=19.71%). Longitudinal analyses for the 4 years are presented in the next pages for these 713 children."Koukounari 2011, Pg 6. - Other schools: Koukounari 2011 claims that 5,700 participants were recruited at baseline: "At baseline (2008) there were recruited 5700 children while the follow-up rate one year later was 53.42 % (3045/5700)." Koukounari 2011, Pg 16. Styles 2011 Pg 13, Table 8 claims there were 3,781 participants recruited at baseline. SCI later told us that this may be because Koukounari 2011 included data from a group of students who were surveyed for a concurrent cross-sectional study, which was not completed: "SCI initially planned to do a cross-sectional evaluation of sixth grade students every year, because each year the current sixth grade class would have received more rounds of treatment over the course of elementary school than the previous year. SCI did not complete this plan, but Dr. Koukounari included the data from the sixth grade students in the baseline data. Dr. Styles did not include this data." GiveWell's non-verbatim summary of a conversation with Giuseppina Ortu on June 20, 2014. Both studies include a similar number of participants at the first follow up: "At baseline (2008) there were recruited 5700 children while the follow-up rate one year later was 53.42 % (3045/5700)." Koukounari 2011, Pg 16; Styles 2011 Pg 13, Table 8 shows about 3030 students were included in the first year follow-up analysis.
- Pilot study: Styles 2011 and Koukounari 2011 have strengths and weaknesses in defining the sample for the pilot study. Styles 2011 includes a much larger number of individuals (Styles 2011, Pg 3, Figure 1b compared to 710 in Koukounari 2011, Pg 7, Figure 2). However, it is unclear whether the individuals in the follow-up were all in the original cohort or whether some were added to the sample later. The two reports indicate different numbers of students included in the study and retraced at each followup. We have seen two explanations for the differences:
- 79
"Baseline evaluation was carried out in March 2012 and lasted 5 weeks with the 1st follow up being done in March 2014 prior to the mass drug administration in April 2014." SCI Malawi panel study, Pg 3.
- 80
- 81
- 82
- Wendy Harrison, SCI Managing Director, email to GiveWell, March 4, 2014
- Going forward, SCI plans to switch to cross-sectional studies that will collect data from a new sample of children each year. Samples will be selected from the same grade levels each survey rather than following the same children as they age. Fiona Fleming, SCI Senior Monitoring & Evaluation Manager, conversation with GiveWell, October 14, 2014.
- 83
- Niger: “Praziquantel (using dose-pole corresponding to 40 mg/kg) and Albendazole (400 mg) were given to the target population regardless of infection status, during the mass drug administration campaign that took place 3–4 weeks after the surveys were conducted.” Tohon et al. 2008, Pg 3. “A total of 89% of the initial sample group were re-examined one year after baseline data collection and the first round of treatment with praziquantel and albendazole.” Tohon et al. 2008, Pg 4.
- Burundi pilot: “At baseline (2007) there were recruited 3616 children. At 2008 the 1st follow-up took place where 1188 children were retraced since baseline (i.e. follow-up rate=32.85 %). At 2nd follow-up (2009) there were 1004 children successfully followed up since baseline (i.e. follow-up rate=27.77%). Finally at 3rd follow-up (2010) there were 713 children successfully followed-up (i.e. follow-up rate=19.71%). Longitudinal analyses for the 4 years are presented in the next pages for these 713 children.” Koukounari 2011, Pg 6.
- Burundi other schools: “At baseline (2008) there were recruited 5700 children while the follow-up rate one year later was 53.42% (3045/5700).” Koukounari 2011, Pg 15.
- Malawi: “A longitudinal survey design requires baseline data collection from schools prior to the initiation of large-scale distribution of praziquantel and albendazole or mebendazole through the school-based platform. Follow up surveys will be conducted immediately prior to subsequent rounds of treatment for the life of the programme to monitor the impact of the health intervention.” SCI Malawi panel study, Pg 3. “During the baseline survey, cohorts of 125 children from Standards 1, 2 and 3 (aged approximately 6, 7 and 8 years) were randomly selected in each of the schools and enrolled into the study. [...] This group of selected children, now in standards 2, 3, and 4, as well as a new group of 40 Standard 1 children, were re-tested to measure the same indicators during the 1st follow-up.” SCI Malawi panel study, Pg 4.
- For all three studies, the methodology does not discuss a control group, and with context, it is sufficiently clear that there was not one.
- 84
Sources for the data in the tables:
- Niger: Tohon et al. 2008. SCI recently sent us a more recent study on the Niger program, SCI Niger panel study 2011. However, for reasons described elsewhere in this report, we continue to rely on Tohon et al. 2008.
- Uganda: Kabatereine et al. 2007.
- Burundi: Styles 2011, and Koukounari 2011. As we discuss elsewhere in this report, both analyses have methodological limitations, and it is not clear which is more reliable. The results are very similar for worm prevalence, and Styles 2011 reports an additional year of data, so we rely on the Styles 2011 data for worm prevalence. Styles 2011 does not report infection intensity, so we rely on Koukounari 2011 for that data.
- Malawi: SCI Malawi panel study, Pgs. 19-20, Tables 8.2 and 8.3, "Followed-up" column. The report also contains results from a cross-sectional sample of 1st graders, who had not yet received MDA. SCI views this sample as an indicator of spillover effects from deworming of older children: “For those pupils in standard 1 only (cross-sectional data), there was a non-significant 4% reduction in prevalence but a significant 58% reduction in infection intensity. Consequently there is some evidence that the program may be having effects in the wider community beyond that due to treatment of school-aged children.” Pg 19.
- 85“Before treatment, the overall prevalence of S. heamatobium infection was 75.4% of the 1,642 enrolled children...One year after a single-dose praziquantel treatment (administered using the WHO PZQ dose pole) co-administered with albendazole (400 mg single dose) for deworming, the prevalence of S. haematobium infection was 38%.”
Tohon et al. 2008, Abstract. - 86
- "Before treatment...21.8% of children excreted more than 50 eggs/10 ml urine." Tohon et al. 2008, Abstract.
- "The overall prevalence of S. haematobium infection was 38% and 4.6% of children had heavy-intensity infections; only three (4.6%) among the latter excreted more than 500 eggs/10 ml." Tohon et al. 2008, pg. 4.
- 87"S. mansoni infection was observed only in 2 schools: Sabon Birni (3%) and Sanguile ́ (1.1%)." Tohon et al. 2008, Pg 3
- 88"Hookworm infection was observed in 3 schools; Sabon Birni, where the prevalence was 18.8 and in 2 other villages were the prevalence was 0.6%. Hookworm infection was not observed in the schoolchildren of the 5 other villages." Tohon et al. 2008, Pg 3
- 89Alan Fenwick, phone conversation with GiveWell, November 28, 2011.
- 90Styles 2011, Table 2 pg 2. The same means seem to be presented in Figure 1, Pg 3.
- 91Eggs per gram. All epg data are the average over all participants, including those not infected.
- 92Koukounari 2011, Figure 6, Pg 10.
- 93Styles 2011, Table 3, Pg 4.
- 94Koukounari 2011, Figure 6, Pg 10.
- 95Alan Fenwick, phone conversation with GiveWell, November 28, 2011.
- 96Styles 2011, Table 9, Pg 15.
- 97Koukounari 2011, Figure 21, Pg 22.
- 98Styles 2011, Table 10, Pg 16.
- 99Koukounari 2011, Figure 21, Pg 22.
- 100SCI Malawi panel study, Pgs. 19-20, Table 8.2, "Followed-up" column.
- 101
- SCI Malawi panel study, Pg. 11, Table 7.1.
- SCI Malawi panel study, Pgs. 19-20, Table 8.2, "Followed-up" column.
- 1021.8% at baseline to 0.3% at one year. SCI Malawi panel study, Pg 20, Table 8.3, "Followed-up" column.
- 103SCI Malawi panel study, Pg 11, Table 7.1.
- 104SCI Malawi panel study, Pg 11, Tables 7.1 and 7.2.
- 105SCI Malawi panel study, Pg. 11, Table 7.1.
- 106
- Niger: "Very low prevalence (0.3 to 0.7%) of Ascaris lumbricoides infection was observed in 5 schools, while 3% of the schoolchildren were infected in 1 school (Sanguile) and no infection was observed in 2 schools (Kaou and Tabalak)." Tohon et al. 2008, Pg 3. “The very low prevalence of soil-transmitted helminth infection is in accordance with previous observations made in Niger [32] and in 2 other African countries, Mali and Chad [22,33], areas that are subjected to climatic conditions comparable to the most inhabited regions of Niger.” Tohon et al. 2008, Pg 5.
- Malawi: Prevalence of Ascaris was 0.1% at baseline, and otherwise there was no Ascaris or Trichuris infection reported. SCI Malawi panel study, Pg. 11, Tables 7.1 and 7.2.
- 107
Results from Styles 2011. We report "as measured" results for Burundi; SCI also reports model results.
Baseline Year 1 Year 2 Year 3 Year 4 Ascaris in Burundi (pilot) 14.9% 12.9% 20.1% 10.6% 10.1% Trichuris in Burundi (pilot) 3.2% 1.8% 3.9% 1.5% 2.4% Ascaris in Burundi (other schools) 21.6% 11.7% - 9.1% - Trichuris in Burundi (other schools) 10.4% 10.0% - 4.3% - - 108
- Niger:
- "Eight villages located in schistosomiasis endemic regions were randomly selected to represent the two main transmission patterns in Niger: six villages located near permanent (Tabalak, Kokorou) or semi-permanent (Kaou, Mozague, Rouafi, and Sabon Birni) ponds and two (Saga Fondo, Sanguile) located along the Niger River. The villages represented the south-western region (Tillabe´ry) and the central-northern region (Tahoua) of the country, with four villages from each region. One village is located in the Sudanian climatic zone and the seven others are in the Sahelian climatic zone." Tohon et al. 2008, Pg 2.
- SCI told us that these locations "are not representative of the treatment population as a whole. They were selected to indicate the impact of treatment in schools with varying prevalence and intensity of both [types of schistosomiasis]." Anna Phillips, SCI Country Program Manager for Burkina Faso and Niger, email to GiveWell, October 13, 2011.
- Burundi pilot survey: “More precisely, the 12 schools were chosen based on 3 zones-believed at the time that they would have the majority of NTDs. 4 schools were selected randomly so that they represent the ‘STHs +Schisto +oncho’ zone (these were Musenyi, Nyamibu, Munyika, Rukinga); then another 4 schools were selected randomly so that they represent the ‘STHs +oncho’ zone (Mirombero, Kizuga, Ruzibira, Mudende) and finally 4 schools were selected randomly so that they represent STHs only endemic areas (Gatwe, Ruko, Condi, Gitobo). Such decisions were based on available historic data. Thus, SCI Programme Manager advised not to stratify the statistical analysis by province and so such results (i.e. stratification by province) are not presented anywhere in this report.” Koukounari 2011 Pg 6.
- Burundi other schools: it appears that schools were selected to be representative, though this is not fully clear in the reports we have seen.
- Styles 2011 says, "The selection of schools was done randomly from the non-pilot provinces; taking into account 11 separate ecological zones." Pg 13.
- Koukounari 2011 says, “At baseline (2008) there were recruited 5700 children while the follow-up rate one year later was 53.42% (3045/5700). For these set of studies as they were designed to cover almost all of the country, it is worthwhile to also examine stratifications of analyses by district and such results are also presented in the following subsections. However, in most of the districts the children were coming only from 1 school (see relevant graphs for district whenever n<200; when this is the case then this is only 1 school per district and thus results should be treated there with caution and programmatic decisions to be taken with reservations). Whenever/wherever this is the case, results should be interpreted with caution as just 1 school would be quite ‘risky’ to represent inference/decisions for a whole district.” Pg 16.
- Malawi: The schools seem to have been selected in a way that makes them representative of districts with moderate to high prevalence, which are those districts that receive annual treatment (low prevalence districts receive more limited treatment). The schools were selected only from districts found to have moderate schistosomiasis prevalence in SCI's mapping: "Method of sentinel site selection: SCI’s protocol is to monitor only in those districts where prevalence of schistosomiasis is moderate or high i.e. SCI does not monitor in non-endemic or low prevalence districts where a full control program is not implemented. All districts except Mzuzu City surveyed in the mapping in February 2012 were determined to have moderate prevalence of S. haematobium, and consequently all districts except Mzuzu City were included in the selection of sites to be monitored for this species (see Table 1). S. mansoni infection was more focal and only present at moderate prevalence in Chiradzulu, Blantrye Rural, Lilongwe City and Lilongwe Rural East. Following district stratification by S. mansoni infection, such that the number of schools selected for S. mansoni monitoring, reflected the frequency of moderate risk areas in the monitoring areas, 22 schools were selected that would be monitor S. haematobium infection with a subset of 9 schools which also monitor S. mansoni infection. Due to the low prevalence of STH’s, STH infection was only monitored in those schools where the Kato-Katz slides were already prepared for S. mansoni." SCI Malawi panel study, Pg 4; SCI's senior biostatistician told us that the sampling method would produce a sample representative of the treated districts. Michelle Clements, SCI Senior Biostatistician, conversation with GiveWell, October 15, 2014.
- Niger:
- 109
- Niger: "A total of 89% of the initial sample group were re-examined one year after baseline data collection and the first round of treatment with praziquantel and albendazole." Tohon et al. 2008, Pg 4.
- Burundi:Pilot schools: 33%: “Without taking into consideration the parasitological exams, at baseline (2007) there were recruited 3616 children. At 2008 the 1st follow-up took place where 1188 children were retraced since baseline (i.e. follow-up rate=32.85 %).” Koukounari 2011. 50%: Styles 2011 Pg 1, Table 1. Other schools: 53%: “At baseline (2008) there were recruited 5700 children while the follow-up rate one year later was 53.42 % (3045/5700).” Koukounari 2011, Pg 16. 80%: Styles 2011 Pg 14, Table 8. The discrepancy between the populations included in Koukounari 2011 and Styles 2011 is described in more detail below.
- Malawi: "Overall, the drop-out rate was higher than expected for both species of schistosomiasis. 48% of those pupils monitored for S. haematobium dropped out the study between baseline and follow-up, and 64% of those pupils monitored for S. mansoni dropped out of the study." SCI Malawi panel study, Pg 17. Since the most meaningful results from Malawi were for Schistosoma haemotobium, we focus on the follow-up rate for that species.
- 110
Benjamin Styles, SCI Senior Biostatistician, phone conversation with GiveWell, August 12, 2011.
- 111
- A previous report indicates that there was an issue at baseline data collection: "In Malawi, urine volumes were not accurately recorded thus it is possible that data is indicating lower overall prevalence in sentinel sites. ICOSA will be undertaking further data analysis to quantify underestimates using mapping data from 2012 and baseline data in appropriate districts." SCI report to DFID (October 2013), Pg 15.
- The version of the study including the baseline data and one-year follow-up (SCI Malawi panel study) does not seem to mention this issue.
- 112
"The protocol was for S. haematobium detection was for the sample to be first assessed for blood in the urine using haemastix. There were some issues with data collection in the field where sometimes a field wasn’t filled in with a zero to indicate where a negative result should have been entered. For instance, if a child had no entry for haemastix, but had a negative entry for the urine filtration result, then it is likely that the child tested negative with haemastix but this was not recorded correctly. Consequently, we had to use some logic decisions when deciding on the likely S. haematobium infection status and infection intensity. The sequential rules we used to decide on infection status were:
1. If no information was recorded for haemastix or urine filtration then we did not assign an infection status and took the data to be truly missing.
2. If the number of eggs recorded in the urine filtration was zero then the infection status was taken to be negative. No reference was made to the haemastix result.
3. If the number of eggs recorded in the urine filtration was greater than zero then the infection status was taken to be positive. No reference was made to the haemastix result.
4. If the haemastix result was recorded (positive or negative) but the urine filtration result was missing we assumed that the urine filtration was negative but mistakenly was not recorded as such.
And the sequential rules we used to decide on infection intensity (ep10ml) were:
1. If infection status was missing then infection intensity was also missing
2. If infection status was negative (0) then infection intensity was 0.
3. If infection status was positive then infection intensity = 10 * number of eggs recorded/volume of urine recorded."
SCI Malawi panel study, Pgs 5-6. - 113
- Côte d'Ivoire: “15 individual houses to be surveyed were selected in the field (full details are in the the protocol, section “Sampling procedure”). Briefly, a survey of the entire village was conducted to determine the total number of houses in the village, and then houses were sampled at an equal interval throughout the village with the first house being randomly selected. [...] All the SAC resident in the selected HH were interviewed to determine whether or not they had
received PZQ and/or ALB in the MDA that happened in November 2013.” SCI Côte d'Ivoire coverage survey 2014, Pg 7. - Malawi: “All eligible individuals resident in the selected households were interviewed about whether they had received PZQ and/or ALB in the last treatment round. Eligible individuals included all school-age children (aged 5 to 14) children and all adult females not in the first trimester of pregnancy during the PCT, and all adult males living in the house at the time of the PCT. The ten interviewed households were randomly selected from the village register where possible, or if this was unavailable via a random walk / transect of the village.” SCI Malawi coverage survey 2012, Pg 8.
- Côte d'Ivoire: “15 individual houses to be surveyed were selected in the field (full details are in the the protocol, section “Sampling procedure”). Briefly, a survey of the entire village was conducted to determine the total number of houses in the village, and then houses were sampled at an equal interval throughout the village with the first house being randomly selected. [...] All the SAC resident in the selected HH were interviewed to determine whether or not they had
- 114
"During the MDA in November 2013, 16 districts were treated by the Ministry of Health. The training of the drug deliverers (nurses, teachers and CHWs) and supervision of the activity in these districts was shared across 4 different teams at the MoH, with each team lead by a senior member of staff and each team treating four districts. Although training materials were developed by the MoH in partnership with SCI, there was no harmonisation training that was given at the MoH. Therefore, each team leader might have had a different approach to training which might impact on the effectiveness of the campaign, and the number of children treated. Consequently, we stratified the selection of districts by the different MOH team leaders, and randomly selected one district per team leader from the list of all districts that each team leader was responsible for." SCI Côte d'Ivoire coverage survey 2014, Pg 5.
- 115
Alan Fenwick, SCI Director, email to GiveWell, November 24, 2014.
- 116
"Two districts Mulanje and Mangochi were chosen as areas to examine in greater detail their reported versus actual validated coverage. These districts were chosen as two of the three districts which had also piloted community treatment." SCI Malawi coverage survey 2012, Pg 6.
- 117
"We found significant differences between districts in validated coverage rates, with three out of the four districts surveyed having an overall validated coverage rate above the target of 75% set by the WHO." SCI Côte d'Ivoire coverage survey 2014, Pg 3.
- 118
Sources for the data in the table:
- Côte d'Ivoire: SCI Côte d'Ivoire coverage survey 2014, Pg 10, Table 7.2.2. Note that this table only includes responses from direct interviews of children, not proxy interviews of parents. We discuss this concern in more detail below.
- Malawi: SCI Malawi coverage survey 2012, Pg 10, Table 3.
- 119"The Mangochi District Health Officer (DHO) has since been removed from the responsibility of the SCH control programme due to the lack of interest and failing to cascade adequate training. Poor training in turn meant that the HSAs were not sensitising the communities, receiving drugs and therefore missing villages completely. Reports from interested partners reported that many villages around the Lake in Mangochi received no treatments at all during the 2012 campaign." SCI Malawi coverage survey 2012, Pg 21.
- 120
- "A coverage survey was recently completed in Uganda, which has not yet been compiled into a report. Overall coverage was about 40% compared to the target of above 75%. SCI is analyzing why this happened." GiveWell's non-verbatim summary of a conversation with Yolisa Nalule, October 14, 2014.
- We expect to see the full details from this study when the report is published (it was expected in October 2014). SCI impact and coverage survey plans.
- 121
- 122
"The Government of Zanzibar undertake their own coverage survey which currently does not disaggregate by gender or age. ICOSA is working with the MoH and SCORE partners to adapt the ICOSA coverage survey protocol for implementation after the next scheduled MDA in June 2014 which will provide the breakdown of coverage data by age and gender." SCI report to DFID (October 2013), Pg 5.
- 123
- Côte d'Ivoire: “Community-based treatment is more difficult, though less common, than school-based treatment. In one case, a community health worker (CHW) went to a village (which was targeted because it did not have a school) with the pills and dose pole, but no children came for treatment while Dr. Nogaro and the supervision team were there. The CHW stated that the SAC where either at school (in another village) or out in the fields and that he would go around each household later in the day and give treatment.”GiveWell's non-verbatim summary of a conversation with Sarah Nogaro, October 16, 2014, Pgs 3-4.
- Malawi: Coverage in school-aged children not attending school was only 22.2% for praziquantel (vs. 82% for children attending school), and 18% for albendazole (vs. 59%) SCI Malawi coverage survey 2012, Pg 10, Table 3.
- Uganda: "One lesson from the coverage survey was that coverage of non-enrolled children was very low. It was surprising and disappointing to learn about the issue but good to catch at this point because the MDA strategy can be adjusted." GiveWell's non-verbatim summary of a conversation with Yolisa Nalule, October 14, 2014.
- 124
- Côte d'Ivoire: "In Côte d'Ivoire, SCI encourages teachers to ask children to bring non-enrolled siblings to school for treatment and asks CHWs to reach the remaining children in the community. Some areas have had low coverage. In November, Dr. Nogaro is planning a qualitative survey of CHWs in areas of low coverage of non-enrolled children to better understand the issues in these areas." GiveWell's non-verbatim summary of a conversation with Sarah Nogaro, October 16, 2014, Pg 4.
- Malawi: "Additional funding for extra days in the communities was also made available to ensure that non-enrolled children and at risk adults will be captured." SCI Malawi coverage survey 2012, Pg 23.
- 125
- "The first coverage survey in CDI was carried out in February 2014; 3 months after the MDA had taken place." SCI Côte d'Ivoire coverage survey 2014, Pg 4
- Malawi: ”The MDA took place at the end of June through to the beginning of July 2012.” Fiona Fleming, SCI Senior Monitoring & Evaluation Manager, email to GiveWell, November 9, 2014. “The coverage survey was carried out in October 2012, during term time.” SCI Malawi coverage survey 2012, Pg 8.
- 126
“The surveyors may ask additional questions to remind the children and see if the answers seem believable, for example:
- Show children the dose poll and ask if the children remember it
- Ask the children what they remember about the pills (it is normal to remember praziquantel's bitter taste, size and smell)
- Ask the children how many pills they took (while trying to judge how many they should have received by getting them to stand near the dose pole)."
GiveWell's non-verbatim summary of a conversation with Sarah Nogaro, October 16, 2014.
- 127
"The surveyors only record if the children say they took the drug, didn’t take the drug, or are unsure; currently, the surveyors do not track answers or concerns from the additional questions, though going forward SCI will consider including these as well." GiveWell's non-verbatim summary of a conversation with Sarah Nogaro, October 16, 2014
- 128
Alan Fenwick, SCI Director, email to GiveWell, November 24, 2014.
- 129
GiveWell's non-verbatim summary of a conversation with Sarah Nogaro, October 16, 2014
- 130
- "During this survey, a question on whether or not each [child] attended school was omitted. Therefore, it is not possible for us to compare coverage between enrolled and unenrolled children for this survey." SCI Côte d'Ivoire coverage survey 2014, Pg 7.
- "Of the 65 villages that were planned for survey, 57 were finally visited, including all 25 of the planned villages in Mulanje, but only 32/40 of the planned villages in Mangochi. For analysis purposes, it was assumed these villages were missing at random in Mangochi, though the reason they were not surveyed is unknown. Although data were double-entered on an Access database originally, the second data entry was lost due to a computer hard drive failure and so only single entered data was available." SCI Malawi coverage survey 2012, Pg 8.
- 131
- "Calculation of validated coverage rates initially included answers from both proxy and direct interviews across all 4 districts. As shown in Figure 2, coverage rates calculated based on direct interviews were higher than those which included responses given by proxy (p < 0.001), perhaps due to the parent erring on the side of caution when giving their answer. As direct interviews are believed to be more robust, we omitted data from proxy interviews when calculating final coverage rates (Table 4)." SCI Côte d'Ivoire coverage survey 2014, Pg 10.
- Proxy results were similar to results from direct interviewing in Malawi, and were included in the headline analysis. SCI Malawi coverage survey 2012, Pg 11, Figure 4.
- 132
Number of yes/no answers obtained in person (summed across four districts): 2178
Number of proxy yes/no answers obtained (summed across four districts): 228
SCI Côte d'Ivoire coverage survey 2014, Pg 9, Table 3. - 133
Funding sources in table below are compiled from:
- SCI Summary sheet of treatments instigated and overseen by SCI.
- GiveWell's non-verbatim summary of a conversation with Alan Fenwick, SCI Director, June 17, 2010.
- SCI Board management accounts (April 2010).
- GiveWell summary of SCI finances (October 2014), Sheet Combined with previous updates.
- April 2012, November 2012, and October 2013 updates on SCI.
Funding for mass treatment | Have we seen disease prevalence, intensity or morbidity results?
Information on expectations for results under the DFID grant is from SCI impact and coverage survey plans. Only primary funders are listed (so, for example, countries that received both DFID and unrestricted funds are listed as "DFID funded").
2003 2004 2005 2006 2007 2008 2009 2010 2011 2012 2013 2014 Burkina Faso - Gates | Problematic results with details Gates | Problematic results with details Gates | Problematic results with details Gates | Problematic results with details Gates/ USAID | No results Gates / USAID | No results Gates / USAID | No results Gates / USAID | No results (Taken over by HKI) - - Burundi - - - - GNNTDC | Results with details GNNTDC | Results with details GNNTDC | Results with details GNNTDC | Results with details Individual | Results with details Individual | No results Individual | No results Individual | No results Côte d'Ivoire - - - - - - - - - - DFID | Baseline results with details DFID | No results yet Ethiopia - - - - - - - - - - Unrestricted funds | No results yet Unrestricted funds | No results yet Liberia - - - - - - - - - DFID | Baseline results with details DFID | No data collected DFID | Results expected Jan 2015 Malawi - - - - - - - - - DFID | Results with details DFID | No data collected DFID | Results with details Mali - Gates | Results without details Gates | Results without details Gates/ USAID | Results without details USAID | No results USAID | No results USAID | No results (Taken over by HKI) - - - Mauritania - - - - - - - - - - Unrestricted funds | No results - Mozambique - - - - - - - - - DFID | Results exist but haven't been shared DFID | No data collected DFID | No results Niger - Gates | Results with details Gates | Results with details Gates/ USAID | Results without details Gates/ USAID | No results Gates/ USAID | No results Gates/ USAID | No results Gates/ USAID | No results DFID | No results DFID | No results DFID | No results DFID | No results Rwanda - - - - GNNTDC | No results GNNTDC | No results GNNTDC | No results GNNTDC | No results ? End Fund | No results End Fund | No results End Fund | No results Senegal - - - - - - - - - Unrestricted funds | No results Unrestricted funds | No results Unrestricted funds | No results Tanzania / Zanzibar Gates | Results without details Gates | Results without details Gates | No results Gates | No results Gates | No results Gates | No results Gates | No results Gates | No results DFID | No results DFID | No results DFID | Results expected Jan 2015 DFID | No results yet Uganda Gates | Results with details Gates | Problematic results with details Gates | Problematic results with details Gates | Problematic results with details Gates/ USAID | No results Gates/ USAID | No results Gates/ USAID | No results Gates/ USAID | No results DFID | No results DFID | No results DFID | Baseline results with details DFID | No data collected Yemen - - - - - - - - Unrestricted SCI funds | No results World Bank and unrestricted funds | No results yet World Bank and unrestricted funds | No results yet - Zambia - Gates | Known failure Gates | Known failure Gates | Known failure Gates | Known failure - - - DFID | No results DFID | Baseline results with details DFID | Baseline results with details DFID | No data collected Under SCI's DFID grant, SCI plans to conduct coverage validation surveys (SCI report to DFID (October 2013), Pgs 5-6). SCI has supported treatments in each of the 8 countries (plus Zanzibar) funded with its phase 1 DFID grant (for example, SCI report to DFID (October 2013), Pg 7. We have results with details from one coverage survey in each Malawi (SCI Malawi coverage survey 2012) and Côte d'Ivoire (SCI Côte d'Ivoire coverage survey 2014), and results without details from Zanzibar (SCI report to DFID (October 2013), Pg 5) and Uganda (GiveWell's non-verbatim summary of a conversation with Yolisa Nalule, October 14, 2014).
- 134
See table in previous footnote "Funding for mass treatment | Have we seen disease prevalence, intensity or morbidity results?"
- 135
"We aimed to assess the health impact of a national control programme targeting schistosomiasis and intestinal nematodes in Uganda, which has provided population-based anthelmintic chemotherapy since 2003… We conducted three annual longitudinal
surveys." Kabatereine et al. 2007, Pgs 91-92. - 136
"For the present study, parasitological and morbidity data were collected from a cohort of 1727 Burkinabe´ children 6–14 years old, randomly sampled from 16 schools before and 1 year after chemotherapy (2004 and 2005, respectively)." Koukounari et al. 2007, Pg 660.
- 137
- SCI impact and coverage survey plans.
- "Normally, SCI plans to do a coverage survey after the first round of treatment. However, except for Malawi, Côte d'Ivoire and Uganda, this has not happened. After the first round, coverage surveys would probably be roughly every three years unless there are issues that warrant follow up. In follow ups, surveys may just focus on high and low performing areas." GiveWell's non-verbatim summary of a conversation with Lynsey Blair, October 16, 2014.
- 138
"Getting on track with M&E is a priority. SCI and CNTD have made it clear to the government that further support hinges on being able to provide sentinel site data. Baseline prevalence was measured using a different technique than the World Health Organization (WHO) recommends so it cannot be compared to other data. The government program manager is coming to Liverpool in a couple weeks in part to work on that. It is likely that the country staff needs more resources, and there is a plan to hire a new data manager to help with compiling information in consistent, coherent way. There has not yet been a coverage survey. SCI expected one, but the previous CNTD program manager did not plan it and this was not communicated early enough to correct. One is expected after this year’s MDA." GiveWell's non-verbatim summary of a conversation with Lynsey Blair, October 16, 2014.
- 139
"A baseline survey was originally planned for September but was delayed due to work on the action plan. It will likely happen in late November or early December when the dates of the SCH/STH treatment campaign are finalized. The first follow up will be a year after the baseline, just prior to the second round of treatment." GiveWell's non-verbatim summary of a conversation with Michael French, October 15, 2014.
- 140
- 141
"The research summarised in this paper is based upon field-work funded by the Schistosomiasis Control Initiative (SCI), Imperial College, under the auspices of the Bill and Melinda Gates Foundation. [...] We are grateful to Professor Alan Fenwick, director of SCI, for his unfailing support, and his encouragement of our work, even when our findings made uncomfortable reading. We are also grateful to other staff from SCI, some of whom have disagreed with our analysis, but who have continued to provide assistance, including Lynsey Blair, Fiona Fleming and Artemis Koukounari." Allen and Parker 2011, Pg 114.
- 142
We examined the references from Parker, Allen, and Hastings 2007, Allen and Parker 2011, Parker and Allen 2011, Allen and Parker 2012, and Parker and Allen 2014, Muhumuza et al. 2013 and Standley et al. 2009. We searched on Google Scholar for "niger schistosomiasis prevalence," “niger deworming uptake," "niger praziquantel uptake," "Burundi schistosomiasis prevalence," "Burundi deworming uptake," "Burundi praziquantel uptake," "schistosomiasis prevalence Africa," "deworming uptake Africa," "praziquantel coverage Africa," "Uganda schistosomiasis prevalence," and "Uganda praziquantel uptake."
- 143
For example:
- SCI Director Alan Fenwick and SCI-affiliated researcher Narcis Kabatereine were coauthors on Brooker et al. 2005 and Standley et al. 2010.
- Narcis Kabatereine, SCI Africa Capacity Building Adviser, was a co-author on Standley et al. 2009.
- Lynsey Blair, SCI Senior Project Manager, was a coauthor on Stothard et al. 2013.
- Knopp et al. 2009 was funded in part by SCI: "Financial support: This study received funding from the Swiss National Science Foundation (projects PPOOB–102883 and PPOOB– 119129), the Natural History Museum (supported through The Health Foundation,United Kingdom),the World Health Organization (OD/TS- 07-00331), the European Union (FP6 STREP CONTRAST project, contract 032203), and the Schistosomiasis Control Initiative." Pg 1077.
- 144
See the spreadsheet for details and citations.
- 145
- 146
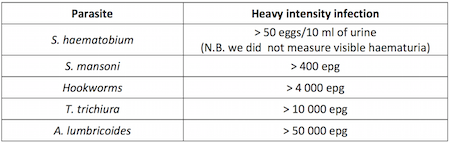
SCI Côte d'Ivoire panel study baseline report, Pg 7. - 147
"Single-dose oral therapies can kill the worms, reducing ... infections by 99 percent ... Reinfection is rapid, however, with worm burden often returning to eighty percent or more of its original level within a year ... and hence geohelminth drugs must be taken every six months and schistosomiasis drugs must be taken annually." Miguel and Kremer 2004, Pg 161.
- 148
GiveWell's notes from visit to Malawi on October 17-19, 2011.
- 149
See table "Funding for mass treatment | Have we seen disease prevalence/intensity or morbidity results?" in previous footnote.
- 150
GiveWell's notes from visit to Malawi on October 17-19, 2011. Updated in Alan Fenwick, SCI Director, email to GiveWell, November 24, 2014.
- 151
GiveWell's notes from visit to Malawi on October 17-19, 2011.
- 152
- Uganda: "The first country to implement a control programme on a national scale...Uganda implemented the SCI-supported control programme in April 2003." Kabatereine et al. 2007, Pg 91.
- Burkina Faso: "Some small-scale control activities with treatment had taken place in some areas in the past,11,13 but the national control programme did not start until 2004." Touré et al. 2008, Pg 780.
- Niger: "Niger’s National Schistosomiasis and Soil-Transmitted Control Programme (PNLBG) was launched at 2004." Fenwick et al. 2009, Pg 5.
- Mali: "In the following years many planned activities were not implemented due to limited financial resources but finally in 2004 national control activities recommenced in the country with support from the SCI." Fenwick et al. 2009, Pg 5.
- Tanzania: "The failure to embrace a national treatment programme has been due primarily to the costs involved in reaching the millions of individuals estimated to be at risk of infection, and the Ministry of Health was never able to support treatment within their budget. In October 2003, the Tanzanian National Plan was approved for funding by the SCI as a step towards developing a sustainable control programme." Kabatereine et al. 2006, Pg 334.
- Zambia: "'The Zambian Bilharzia Control Programme' (ZBCP) was established in 2004 to develop a MoH and MoE joint strategy for bilharzia and worm control. The MoE was already in receipt of a grant from the United States Agency for International Development (USAID) for implementing training and treatment in some schools on a small scale in two provinces, Eastern and Southern, which was known as the ‘School Health and Nutrition programme’ (SHN)." Fenwick et al. 2009, Pg 4.
- 153
"Without SCI's involvement, the program would likely not have gone forward. With the exception of filling small funding gaps on an ad hoc basis, the government has not been able to allocate funding to NTDs. It was interested in doing disease mapping but did not have the funding to do so, and it likely would not have received drug donations without the mapping data." GiveWell's non-verbatim summary of a conversation with Oumer Shafi, November 4, 2014.
- 154
"Drug distribution channels:
- School-based delivery for school children. School teachers will be trained to carry out drug distribution at schools.
- Community-based delivery for school-aged children who are not attending school and for community adults at high risk. Community Drug Distributors (CDD) will be trained to deliver the drugs at community.
- Health centre-based delivery. Drugs will be made available at health centres for those in the community who do not qualify for MDA and who request for treatment. Health workers at the centres will be trained.
Drug distributors need a minimum of one day’s training to understand the basis for calculating dosages, the necessary actions to deal with side-effects and treatment record keeping and reporting." SCI Neglected tropical diseases in Mozambique, Pg 23.
"For schistosomiasis and STHs, treatment will be conducted through schools by the teachers. For LF, treatment will be conducted through community directed treatment, by the CDDs and community health agents, managed by the district medical officer." SCI Proposal by SCI, Imperial College to manage the Program for Integrated Control of Neglected Tropical Diseases in Côte d'Ivoire, Pg 23. - 155
- "In Tanzania matters came to a head in places around Morogoro in 2008. Distribution in schools of tablets for schistosomiasis and soil-transmitted helminths provoked riots, which had to be contained by armed police. It became a significant national incident, and one of the consequences has been the delay in Tanzania adopting a fully integrated NTD programme, and the scaling back some existing drug distributions." Allen and Parker 2011, Pg 109.
- "From these reports a number of problems with the MDA were raised which included fear of side effects from the tablets, particularly following the mass hysteria and death in Blantyre and Rumphi respectively and may explain some of the geographic heterogeneity seen. Furthermore most districts reported that MDA occurred after standard 8 students had finished exams and left school, and due to having inadequate resources for drug distribution...The side-effects incident in Blantyre and death in Rumphi had a large effect on districts and with many district reports stating that after the incidence many families refused to participate." SCI Malawi coverage survey 2012 Pgs 5, 21.
- 156
Our old analysis used 87 million treatments (with our “mostly conservative guess” that total costs were $87.8 million). This was largely based on this quote: “Mass drug administrations (MDAs) for schistosomiasis and the STH have been conducted annually in all countries, totaling over 45 million treatments by 2008. Since then integrated treatment has reached 10 million people in each of Burkina Faso and Niger, 3 million in Uganda and 8 million in each of Burundi and Rwanda. 2.5 million children have been treated in Tanzania” (SCI Gates Foundation final report (January 2011), Pg 3).
We now think that we interpreted these data incorrectly and that it is not clear that the funding we accounted for paid for these treatments. Later in the same document, SCI emphasizes only the 45 million treatments when reporting on the outcomes of the Gates Foundation grants. Furthermore, SCI Summary sheet of treatments instigated and overseen by SCI reports a total of 50 million schistosomiasis treatments across all of SCI’s work from a comparable time period (it also reports 87.4 million “treatments for all NTDs”). It is possible that only these 50 million treatments should be counted.
In the cases of Burundi and Rwanda, we have seen recent information that contradicts the treatments we had included (SCI Burundi June 2014 Open Day poster and SCI Rwanda June 2014 Open Day Poster show total praziquantel – the drug used to treat schistosomiasis – treatments since 2007 as 2.9 million and 1.0 million, respectively).
Excluding the 16 million treatments since 2008 that we counted in Burundi and Rwanda increases our cost per treatment estimate by about 20%.
- 157
Alan Fenwick, SCI Director, email to GiveWell, November 24, 2014.
- 158
This understanding is from undocumented conversations with SCI from early in our investigation of SCI.
- 159
"Ordering of ALB is carried out by the Ministry Of Health Programme Manager for Lymphatic Filariasis (LF) Elimination. Previously the ALB had been used for the LF program and stocks had not been replenished in time for the SCH campaign which contributed to the low ALB coverage. Treatments were also carried out in conjunction with the child health days which may have caused confusion with who was eligible for treatment and prioritising the younger children. Furthermore due to the complexities of distributing PZQ compared to ALB there may have been more focus during the training and distribution on reporting and dispensing PZQ." SCI Malawi coverage survey 2012, Pgs 20-21.
- 160
We explain why we take this approach in this blog post.
- 161
Alan Fenwick, SCI Director, email to GiveWell, November 24, 2014
- 162
It is not clear to us how to interpret the 87.4 million “treatments for all NTDs” in this data (e.g. how many of these were deworming and if SCI paid for the treatments), so to be conservative we have not included them at all. A more optimistic way to interpret these data could be to include 24.2 million schistosomiasis treatments in Burkina Faso, Niger, and Uganda that were delivered as part of integrated treatment programs (SCI Gates Foundation final report (January 2011), Pg 9, Table 2; these countries account for 70 million of the 87.4 million “treatments for all NTDs”). Including these treatments lowers the estimate to $1.05 per treatment.
- 163
We used Leslie et al. 2011, a study of the costs of a SCI-funded deworming program in four districts of Niger in 2004-2006, to estimate non-SCI contributions to SCI's deworming programs. Three of the authors of the study were affiliated with SCI. The study aimed to account for all costs of the program, including costs funded by the government and non-financial costs such as the value of volunteers' time:
“This was a retrospective study which covered a two year period from April 2004 to May 2006, including the first and second years of MDA and related programme activities in four health districts. All data on first year costs at national, regional, district, and sub district levels were taken from the PNLBG accounts and receipts and records of staff missions or activities. Second year cost data for national and regional level activities were taken from receipts. District and sub district, school and community MDA resource use data for 2005 were collected in June 2006 through a retrospective survey…
The main cost elements include: the programme specific expenditure; the opportunity cost or value of government contributions related to in-kind costs of using local government staff and vehicles and the value of CDD’s time (taken as the daily agricultural labour rate); and the international costs of programme co-ordination, reporting and technical support." Leslie et al. 2011, Pgs 23.The study is of a single country, looked at a program that was carried out years ago, and the program may differ in some ways from current programs, but overall it is of high quality and provides us with a sense for the portion of resources contributed by SCI versus non-SCI parties.
Two examples of how the area where the study was conducted may not be representative of all areas in which SCI works:
- Due to low school enrollment rates, a substantial portion of the program was through community distribution. Current SCI programs focus on school-based distribution. "The primary school net enrolment rate (NER) in 2004 in Niger was 41%... To achieve high treatment coverage in targeted school age children and at risk adults two treatment strategies, school-based and community-based distribution, were established." Leslie et al. 2011, Pg 2.
- "The cost per treatment and prevalence figures relate to the study sample of four districts located in the Niger River Valley. This was and is an area of high disease prevalence and high population density relative to other parts of the country. The costs per person treated may be higher in lower density and more remote areas." Leslie et al. 2011, Pg 8.
Non-SCI costs were 18% of the total cost of the program and 33% of the cost of school-based deworming (the program also included community-based deworming).
- ”Programme cost: 75%
- Government cost: 18%
- International tech. support: 7%”
Leslie et al. 2011, Pg 5, Table 2.
It is our understanding from the paper and our past conversations with SCI that "programme expenditure" was fully funded by SCI. We believe that "international tech. support" refers to SCI staff time and travel costs; we're somewhat less confident in this than in our understanding of “programme expenditure.” Government costs are "related to in-kind costs of using local government staff and vehicles and the value of CDD’s time (taken as the daily agricultural labour rate)." Leslie et al. 2011, Pg 3.
Calculating non-SCI costs of school-based delivery:
- The average cost/treatment in the study was $0.58: “The total economic cost per treatment was $0.58. This includes programme, government and international costs.” Leslie et al. 2011, Author Summary. At 7% of the total cost, international tech. support accounts for $0.04/treatment.
- “The full economic delivery cost of school based treatment in 2005/06 was $0.76, and community treatment was $0.46. If only programme costs are included these figures are $0.47 and $0.41 respectively.” Leslie et al. 2011, Pgs 7-8.
- Therefore, non-program costs (government and international tech. support) are $0.29 ($0.76 - $0.47) of the $0.76 cost of each school based treatment. Since $0.04 is international tech. support, that leaves $0.25 of government costs, or 33% of the total cost.
It is our understanding that in recent programs SCI has continued to do some community-based deworming but that most of its treatments are delivered through schools. Therefore, we conservatively estimate that non-SCI actors contribute 30% of the cost of a SCI deworming program.
- 164
“Program costs can vary. For example, in Sudan, it can be expensive to transport drugs. In Darfur, it might cost about 40-50 pence per treatment, while in Khartoum it could be 10 pence per treatment.” Alan Fenwick, SCI Director, conversation with GiveWell, October 15, 2014.
- 165
Sources for this data:
- Bleakley 2007: Pg 84, Table 1, "Hookworm-Infection Rate," "Whole Sample."
- Croke 2014: Kabatereine et al. 2001, Pg 284, Table 1, Average for eastern districts. Kabatereine et al. 2001 was a disease mapping study conducted in southern Uganda in 1998, two years before the study underlying Croke 2014 began, I.e. these are not results from the individuals enrolled in the study underlying Croke 2014. Note that the districts in the eastern district average in Kabatereine et al. 2001 are not an exact match for the districts included in Croke 2014, though four of the five districts included in Croke 2014 (Busia, Iganga, Mbale, and Tororo) are included in the Eastern district average. Furthermore, the districts for Croke 2014 were selected because Kabatereine et al. 2001 had found high worm prevalence in eastern districts: "Five districts in the eastern region of Uganda were selected (Busia, Iganga, Mbale, Palissa, and Tororo) because a survey had indicated that about 60% of children aged 5-10 years were infected with intestinal nematodes, most commonly hookworm." Alderman et al. 2006, pg 1.
- Miguel and Kremer 2004: Miguel and Kremer 2004, Pg 168, Table 2.
- Summary of SCI data from previous programs: Based on our discussion of the Niger, Burundi, Burkina Faso, and Uganda panel studies in our 2012 review of SCI.
- Liberia: SCI Liberia panel study baseline report, Pg 4, "Summary table of baseline results."
- Malawi: SCI Malawi panel study, Pg 11, Table 7.1.
- Côte d'Ivoire: SCI Côte d'Ivoire panel study baseline report, Pg 11, Table 6.1.1
- Zambia: SCI Zambia panel study baseline report, Pg 11, Table 7.
- Uganda: SCI Uganda panel study baseline report Pg 10, Table 6.1.
- Zanzibar: Knopp et al. 2013: "The baseline Schistosoma haematobium prevalence in school children and adults was 4.3% (range: 0-19.7%) and 2.7% (range: 0–26.5%) in Unguja, and 8.9% (range: 0–31.8%) and 5.5% (range: 0–23.4%) in Pemba, respectively. Heavy infections were detected in 15.1% and 35.6% of the positive school children in Unguja and Pemba, respectively." Abstract. This study also measured disease rates in adults and the treatment program will include adult treatments.
Bleakley 2007, Croke 2014, and Miguel and Kremer 2004, are discussed in greater detail here.
The WHO definition of "heavy" infection, which seems to have been used across all of the studies, is given in this table:
SCI Côte d'Ivoire panel study baseline report, Pg 7. - 166
"In Malawi, urine volumes were not accurately recorded thus it is possible that data is indicating lower overall prevalence in sentinel sites. ICOSA will be undertaking further data analysis to quantify underestimates using mapping data from 2012 and baseline data in appropriate districts." SCI report to DFID (October 2013), Pg 15.
- 167
"The NTD programme in Zanzibar has recently completed the 3rd round of MDA." SCI report to DFID (October 2013), Pg 17.
- 168
See previous footnote for sources for this and following tables in this section.
- 169
Data not reported for Bleakley 2007 or Zanzibar.
- 170
Data not reported for Miguel and Kremer 2004, Bleakley 2007, Croke 2014 or Zanzibar.
- 171
Much of the data we have received from SCI is on a budget year from April 2015 to March 2016. It is our understanding that SCI works on this schedule to match DFID's fiscal year because DFID is its largest funder. This schedule corresponds reasonably well with tracking uses of unrestricted funds, because donors who use GiveWell's research tend to give a large portion of donations in December, which allows SCI to spend these funds in the next budget year.
- 172
Alan Fenwick, SCI Director, conversation with GiveWell, October 15, 2014.
- 173
Alan Fenwick, SCI Director, conversation with GiveWell, October 14, 2014.
- 174
“In extreme circumstances, committed money could be shifted to other opportunities. For example, SCI had planned to do work in Liberia, but the Ebola outbreak has put that work on hold and so the committed funding could be reallocated.” Alan Fenwick, SCI Director, conversation with GiveWell, October 14, 2014
- 175
- ”SCI first contacted the government [in Côte d'Ivoire] and started to discuss a SCH/STH program in 2010. A civil war delayed progress because there was political turmoil, a weakened health system, and dangerous conditions. In 2012 conditions improved, and the contracts between SCI and the Ministry of Health were set up.” GiveWell's non-verbatim summary of a conversation with Sarah Nogaro, October 16, 2014, Pg 1.
- ”Using drugs that are about to expire is a key factor used to prioritize between programs in strategic budget decisions.” Alan Fenwick, SCI Director, conversation with GiveWell, October 15, 2014.
- “Factors that could affect SCI’s plans include country capacity (countries not being prepared to use planned funding or asking to expand more quickly than planned), WHO praziquantel donations (countries getting more or less drugs than expected), and new countries asking for assistance. New restricted funding could shift unrestricted funding to another use.” Alan Fenwick, SCI Director, conversation with GiveWell, October 15, 2014.
- Treatment frequency is determined by mapping results: "World Health Organization (WHO) guidelines suggest different treatment frequencies depending on prevalence:
- Low (1-10% prevalence): treat twice during primary school (once every 3-4 years)
- Moderate (10-50% prevalence): treat every other year, and
- High (prevalence over 50%): treat every year.
Only 3 districts have high prevalence so the plan for next year is to treat those areas, as well as those that need treatment every other year and were not treated in 2014. Others districts have moderate or low prevalence and would be treated again in future years, following WHO guidelines." GiveWell's non-verbatim summary of a conversation with Sarah Nogaro, October 16, 2014, Pg 2.
- 176
- “If SCI hits its conservative fundraising targets, in 2015 it will repeat the same treatments in Côte d'Ivoire and Mozambique, which will cost about £500,000 in each.” Alan Fenwick, SCI Director, conversation with GiveWell, October 15, 2014.
- Only a small portion of children treated in 2014 will need treatment in 2015: “In May 2014: 1,425,461 SAC received treatment in the remaining areas of the first phase of mapping. In November 2014: 3.5 million SAC are targeted for the next treatment, which would correspond to the second phase of mapping. [...] In 2015, 637,228 SAC will be targeted, which is everyone who should be treated, based on WHO guidelines described above.” GiveWell's non-verbatim summary of a conversation with Sarah Nogaro, October 16, 2014, Pgs 2-3. It seems reasonable to expect DFID funding is sufficient to deliver 2015 treatments because in the 2014 budget, DFID funding was allocated to cover £200,000 of total costs of £600,000. SCI report to GiveWell (September 2014), Pg 7.
- 177
Alan Fenwick, SCI Director, conversation with GiveWell, October 15, 2014. As of November 4, 2014, Google states that £1 is worth $1.6.
- 178
Expectations as of November 2013 for how it would spend an additional $4 million:
- Côte d'Ivoire: expected to need $400,000 and actually spent about $350,000.
- Mozambique: expected to need as much as $3 million and actually spent $1.4 million.
- Mauritania: expected to need $1 million and didn’t spend anything.
- Ugandan islands: expected to need about $600,000 and didn’t spend anything.
- The $1.75 million spent in Côte d'Ivoire and Mozambique represents about 80% of the spending.
- Expectations as of 2013 are listed in our November 2013 review of SCI.
- Actual spending is through mid-September 2014 from GiveWell summary of SCI finances (October 2014).
- 179
Discussion about commitment to Senegal to monitor a USAID-funded treatment program (GiveWell's non-verbatim summary): "They caught us at the right moment. The program manager was in favor of it and she was underemployed at the time. That said, if you invest in a country and become known there, they may approach you to work with them in the future if there is a need and you have the funding. So it may turn out to be a good investment in the end." Alan Fenwick, SCI Director, conversation with GiveWell, October 14, 2014.
- 180
- We think 50% is intended to be a reasonable estimate from our understanding of several cases (some examples below). Depending on the context, SCI might want 33% (e.g. for a fairly stable program or with long term funding commitments) or up to 300% (e.g. if it is a small pilot aiming to scale rapidly the following year) in reserves.
- ”Before starting a new program, SCI wants to have funding for a pilot but also for some amount (perhaps double the pilot) for scale-up in future years.” Alan Fenwick, SCI Director, conversation with GiveWell, October 14, 2014.
- ”Ethiopia and Sudan have financial contributions from other partners so SCI would be comfortable holding less in reserves than it otherwise would want.” Alan Fenwick, SCI Director, conversation with GiveWell, October 15, 2014.
- 181
SCI fundraising targets (November 2014). As of November 4, 2014, Google states that £1 is worth $1.6.
SCI told us that the "wish list target for expansion" is in addition to the "minimum fund raising target" and that "2014/15" indicates April 2014 to March 2015. Alan Fenwick, SCI Director, email to GiveWell, November 24, 2014.
- 182
“With £2-3 million, SCI would spend about three-quarters and save the rest for reserves. With £4 million, it would spend about half and hold back half. £3 million would be a fantastic achievement and put SCI in a very strong position. It would be difficult to follow through on plans with less than £2 million.” Alan Fenwick, SCI Director, conversation with GiveWell, October 15, 2014 As of November 4, 2014, Google states that £1 is worth $1.6.
- 183
Alan Fenwick, SCI Director, conversation with GiveWell, October 14, 2014
- 184
- ”Comic Relief, an organization that raises nearly £100 million per year from the British public, has given £100,000. It has previously targeted HIV and malaria but is now considering NTDs.” Alan Fenwick, SCI Director, conversation with GiveWell, October 14, 2014
- ”Vitol was interested in contributing to charitable causes in countries where it drills for oil. It provided £100,000 to support mapping in Côte d'Ivoire and has since shown some interest in providing funding for implementation.” Alan Fenwick, SCI Director, conversation with GiveWell, October 14, 2014
- ”Historically, SCI has spent very little time on traditional fundraising activities. SCI may consider hiring a staff member dedicated to fundraising. Also, Imperial College has expanded its fundraising team, and it may be able to support SCI’s efforts to raise funds.” Alan Fenwick, SCI Director, conversation with GiveWell, October 14, 2014
- As of November 4, 2014, Google states that £1 is worth $1.6.
- 185
- Data for 2014-2016 from SCI contribution to the global effort to control and eliminate schistosomiasis, slide 16.
- Note, slide 11 of the same document lists Merck donations of 90 million and 140 million tablets in 2014 and 2015, respectively. This is 25 million and 20 million higher than the numbers we cite. We do not know why this discrepancy exists. .
- Data for 2011 from slide 9, converted from tablets to treatments assuming 2.5 tablets/treatment.
- 186
- Top 20 countries, estimated schistosomiasis infections.
- However, SCI told us that there have been few treatments in Nigeria: “There has been very little treatment in Nigeria. Only two (of 36) states have any schistosomiasis program.” Alan Fenwick, SCI Director, conversation with GiveWell, October 15, 2014