The following tables are excerpted from Chapter 2 of From Poverty to Prosperity: Intangible Assets, Hidden Liabilities, and the Lasting Triumph over Scarcity, by Arnold Kling and Nick Schulz, New York: Encounter Books, 2009.
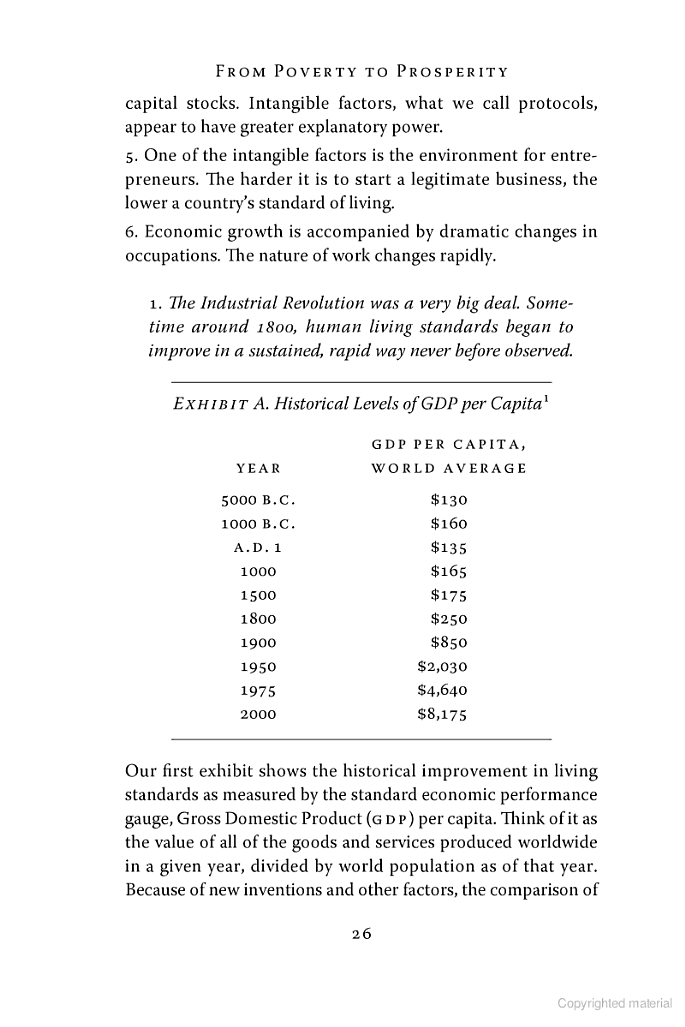
Exhibit A: World average GDP per capita from 5000 B.C. to 20001
| Year | GDP per capita in $, world average |
|---|---|
| 5000 B.C. | 130 |
| 1000 B.C. | 160 |
| A.D. 1 | 135 |
| 1000 | 165 |
| 1500 | 175 |
| 1800 | 250 |
| 1900 | 850 |
| 1950 | 2030 |
| 1975 | 4640 |
| 2000 | 8175 |
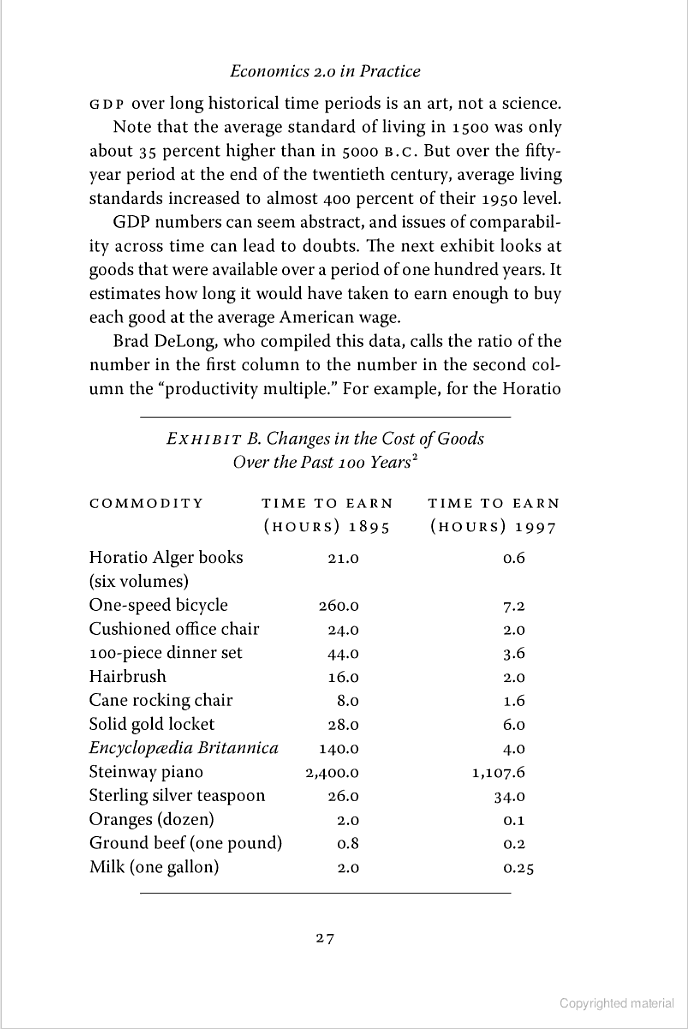
Exhibit B: Selected goods and the time it would have taken to earn enough to buy them, based on the average American wage, 1895 and 19972
| Commodity | Time to Earn (hours) 1895 | Time to Earn (hours) 1997 |
|---|---|---|
| Horatio Alger books (six volumes) | 21 | 0.6 |
| One-speed bicycle | 260 | 7.2 |
| Cushioned office chair | 24 | 2 |
| 100-piece dinner set | 44 | 3.6 |
| Hairbrush | 16 | 2 |
| Cane rocking chair | 8 | 1.6 |
| Solid gold locket | 28 | 6 |
| Encyclopedia Britannica | 140 | 4 |
| Steinway piano | 2400 | 1107.6 |
| Sterling silver teaspoon | 26 | 34 |
| Oranges (dozen) | 2 | 0.1 |
| Ground beef (one pound) | 0.8 | 0.2 |
| Milk (one gallon) | 2 | 0.25 |
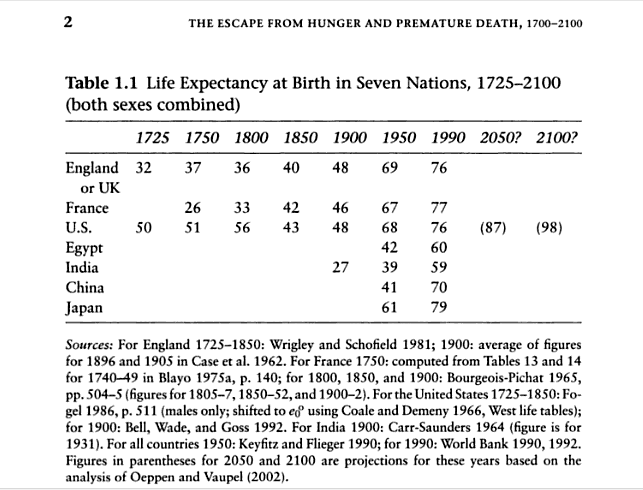
Exhibit C: Life expectancy at birth in four countries, 1750-1990 (both sexes combined)3
| Country | Life Expectancy, 1750 | Life Expectancy, 1900 | Life Expectancy, 1950 | Life Expectancy, 1990 |
|---|---|---|---|---|
| England or UK | 37 | 48 | 69 | 76 |
| France | 26 | 46 | 67 | 77 |
| U.S. | 51 | 48 | 68 | 76 |
| India | 27 | 39 | 59 |
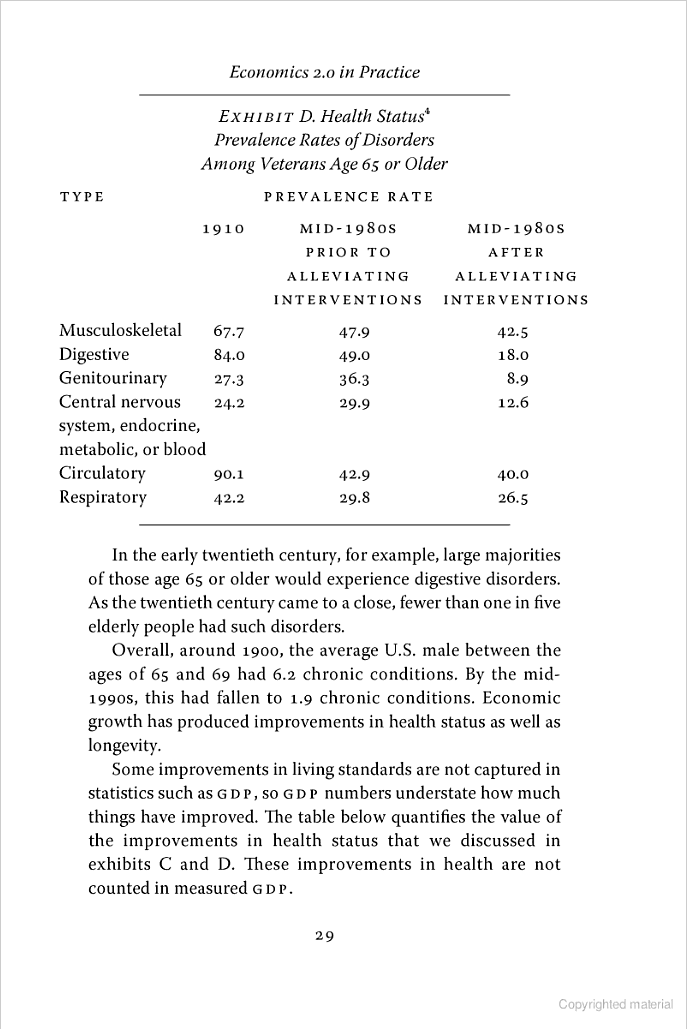
Exhibit D: Prevalence of serious health problems among older veterans4
| Type of Disorder Prevalent Among Veterans Age 65 or Older | Prevalence Rate in 1910 | Prevalence Rate in Mid-1980s Prior to Alleviating Interventions | Prevalence Rate in Mid-1980s After Alleviating Interventions |
|---|---|---|---|
| Musculoskeletal | 67.7 | 47.9 | 42.5 |
| Digestive | 84 | 49 | 18 |
| Genitourinary | 27.3 | 36.3 | 8.9 |
| Central nervous system, endocrine, metabolic, or blood | 24.2 | 29.9 | 12.6 |
| Circulatory | 90.1 | 42.9 | 40 |
| Respiratory | 42.2 | 29.8 | 26.5 |
Exhibit E: Growth in living standards measured by annualized percentage increases in per capita consumption and value of health status5
| Years | Average Annual Percentage Increase in Consumption | Average Annual Percentage Increase in Value of Health Status |
|---|---|---|
| 1900–1925 | 2 | 2.3 |
| 1925–1950 | 1.8 | 3.3 |
| 1950–1975 | 2.4 | 1.9 |
| 1975–1995 | 2 | 1.7 |
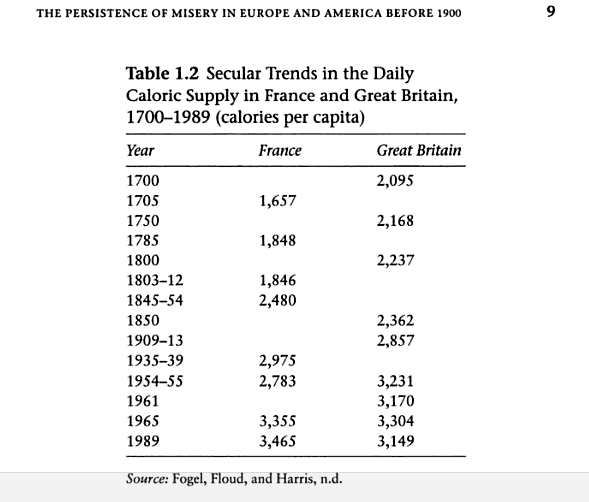
Exhibit F: Daily caloric supply in Great Britain, 1700-19136
| Year | Daily Average Calories Consumed per Capita in Great Britain |
|---|---|
| 1700 | 2095 |
| 1800 | 2237 |
| 1850 | 2362 |
| 1909–1913 | 2857 |
| 1954–1955 | 3231 |
| 1965 | 3304 |
| 1989 | 3149 |
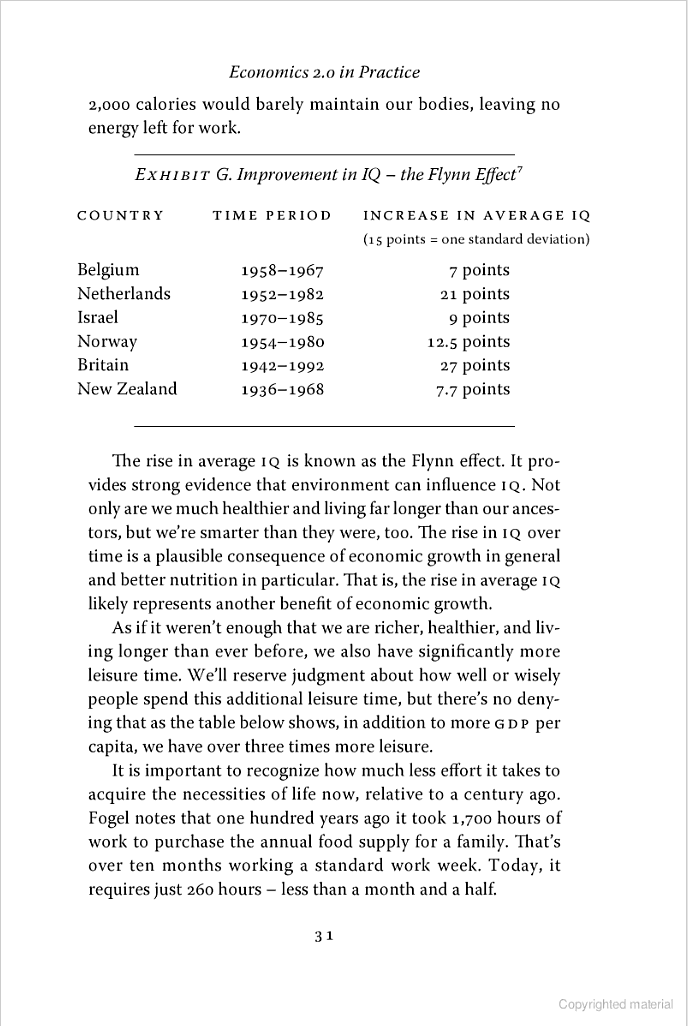
Exhibit G: Improvement in IQ in six countries, 20th century7
| Country | Time Period | Increase in Average IQ (15 points = one standard deviation) |
|---|---|---|
| Belgium | 1958–1967 | 7 points |
| Netherlands | 1952–1982 | 21 points |
| Israel | 1970–1985 | 9 points |
| Norway | 1954–1980 | 12.5 points |
| Britain | 1942–1992 | 27 points |
| New Zealand | 1936–1968 | 7.7 points |
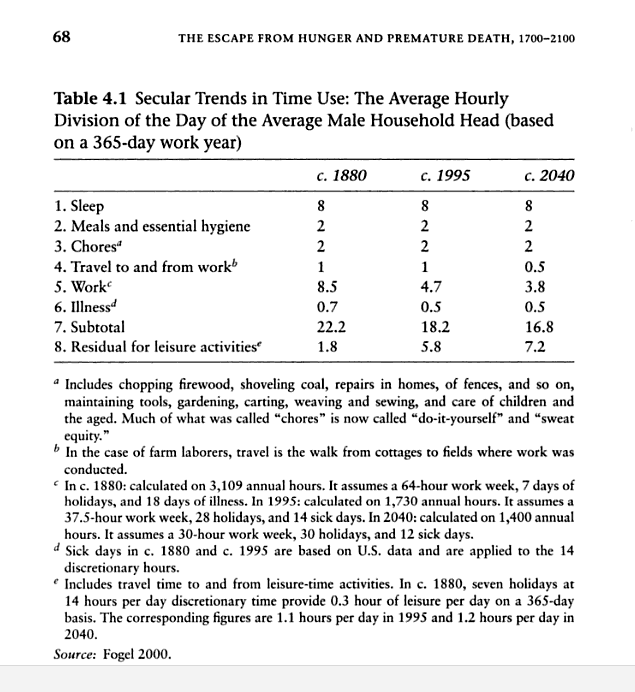
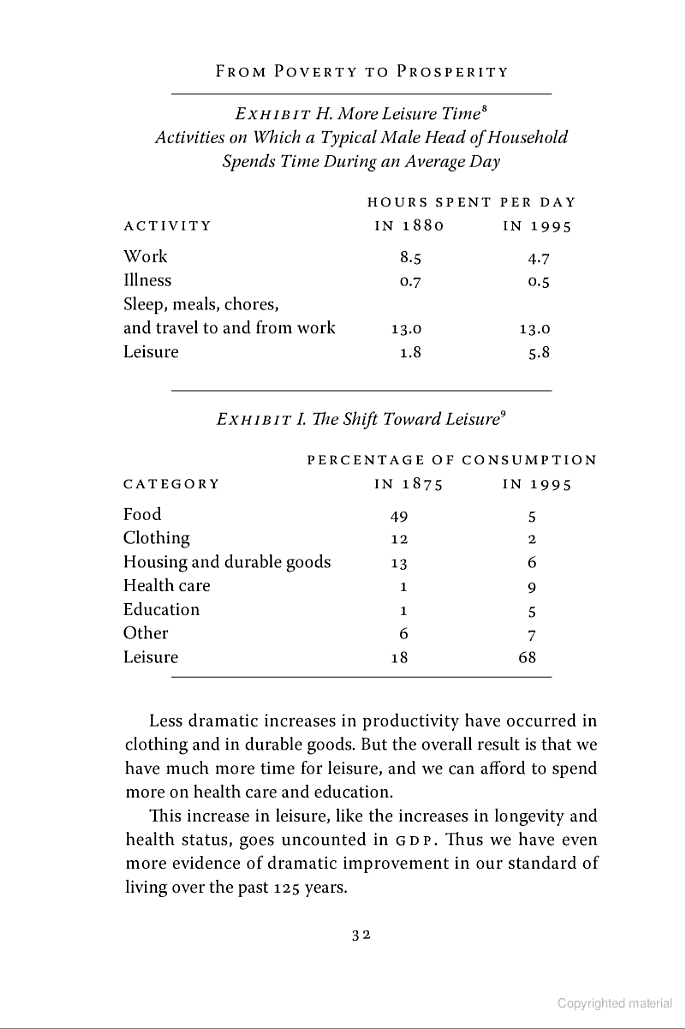
Exhibit H: Hours per day spent by average male head of household on various activities, 1880 and 19958
| Activity on Which a Typical Male Head of Household Spends Time During an Average Day | Hours Spent per Day in 1880 | Hours Spent per Day in 1995 |
|---|---|---|
| Work | 8.5 | 4.7 |
| Illness | 0.7 | 0.5 |
| Sleep, meals, chores, and travel to and from work | 13 | 13 |
| Residual for leisure activities | 1.8 | 5.8 |
Exhibit I: Relative consumption by category, 1875 and 19959
| Consumption Category | Percentage of Consumption in 1875 | Percentage of Consumption in 1995 |
|---|---|---|
| Food | 49 | 5 |
| Clothing | 12 | 2 |
| Housing and durable goods | 13 | 6 |
| Health care | 1 | 9 |
| Education | 1 | 5 |
| Other | 6 | 7 |
| Leisure | 18 | 68 |
Sources
| Source name used in footnotes | Link | Date link was last accessed (for external files) | Archived link (for external files) |
|---|---|---|---|
| J. Bradford DeLong, Macroeconomics. McGraw-Hill Irwin, 2002. Chapter 5, “The Reality of Economic Growth: History and Prospect” (as cited in Kling, 2010, Pgs 26, 27). | Source | [May 1, 2013] | Exhibit A Exhibit B |
| Robert William Fogel, The Escape from Hunger and Premature Death, 1700–2100. Cambridge University Press, 2004, Pgs 2, 9, 68. | Source | [May 1, 2013] | Exhibit C Exhibit F Exhibit H |
| Robert William Fogel, The Escape from Hunger and Premature Death, 1700–2100. Cambridge University Press, 2004 (as cited in Kling, 2010, Pgs 29, 32). | Source | [May 1, 2013] | Exhibit D Exhibit I |
| William Nordhaus, “The Health of Nations: The Contribution of Improved Health to Living Standards,” National Bureau of Economic Research, 2002, Pg 48. | Source | [May 1, 2013] | Exhibit E |
| Deary, Ian J., Intelligence: A Very Short Introduction. Oxford University Press, 2001 (as cited in Kling, 2010, Pg 32). | Source | [May 1, 2013] | Exhibit G |
- 1
J. Bradford DeLong, Macroeconomics. McGraw-Hill Irwin, 2002. Chapter 5, “The Reality of Economic Growth: History and Prospect” (as cited in Kling, 2010).
- 2
DeLong, 2002 (as cited in Kling, 2010, Pg 27).
- 3
Robert William Fogel, The Escape from Hunger and Premature Death, 1700–2100. Cambridge University Press, 2004, Pg 2.
- 4
Robert William Fogel, The Escape from Hunger and Premature Death, 1700–2100. Cambridge University Press, 2004 (as cited in Kling, 2010, Pg 29).
- 5
William Nordhaus, “The Health of Nations: The Contribution of Improved Health to Living Standards,” National Bureau of Economic Research, 2002, Pg 48.
Note: The value of health status was determined using a "life-years" approach. "Under the life-years approach, [...] the economic value of improved health is equal to the increase in life expectancy times the value of an additional life-year. In both cases, the estimates are weighted by the share of the population that is experiencing the lower mortality or greater life expectancy." Nordhaus, 2002, Pg 30.
- 6
Fogel, 2004, Pg 9.
- 7
Deary, Ian J., Intelligence: A Very Short Introduction. Oxford University Press, 2001 (as cited in Kling, 2010, Pg 32).
- 8
Fogel, 2004, Pg 68.
- 9
Fogel, 2004 (as cited in Kling, 2010, Pg 32).