We have published a more recent review of this intervention. See our most recent report on mass distribution of long-lasting insecticide-treated nets.
Published: November 2013
Updated: November 2014
Note: In 2014, we did not reassess the evidence for LLINs. We only updated the room for more funding section of this page.
This page discusses the case for mass distribution of long-lasting insecticide-treated nets (LLINs) for protection against malaria. In general, we focus our discussion on work similar to that of the Against Malaria Foundation.
This intervention involves trying to achieve universal ownership of LLINs within a population, giving free new LLINs to the people who do not already have them. Evidence suggests that when large numbers of people use LLINs to protect themselves while sleeping, the burden of malaria can be reduced, resulting in a reduction in child mortality among other benefits.
LLINs cost under $10 each to purchase and distribute (including all costs), and this intervention is generally considered to be among the most cost-effective ways to save lives. Mass distribution of LLINs is in the same range of cost-effectiveness as other priority programs we have considered.
Table of Contents
- What is malaria (the disease targeted by LLINs)?
- What is LLIN distribution and how does it target malaria?
- What is the evidence regarding the general effectiveness of LLIN distributions?
- Two key issues around LLIN distributions
- How cost-effective is LLIN distribution?
- Is there room for more funding in LLIN distribution?
- Our process for updating this page in 2013 and 2014
- Sources
Previous versions of this page:
- 2012 report on insecticide treated nets
- 2011 report on insecticide treated nets
- 2009 report on insecticide treated nets
What is malaria (the disease targeted by LLINs)?
Malaria is one of the leading causes of child deaths in Africa.1 It is transmitted from person to person by infected mosquitoes.2 It involves flu-like symptoms including fever.3 As discussed below, there is evidence connecting malaria with death (particularly in children under 5), anemia, splenomegaly (enlarged spleen), other nutrition-deficiency-related indicators, and low birthweight.
It is also believed that malaria can cause permanent disability (hearing impairment, visual impairment, epilepsy, etc.).4
What is LLIN distribution and how does it target malaria?
An insecticide-treated net (ITN) is a net (usually a bed net), designed to block mosquitoes physically, that has been treated with safe, residual insecticide for the purpose of killing and repelling mosquitoes, which carry malaria.5 A long-lasting insecticide-treated net (LLIN)6 is an ITN designed to remain effective for multiple years without retreatment.7 The World Health Organization recommends that LLINs be distributed for free to achieve universal coverage (one LLIN for every 1.8 people in the target population) of those at risk for malaria.8 An LLIN distribution involves surveying people to determine the need for LLINs; delivering LLINs; and promoting the use of LLINs (to read our notes from visiting an ongoing LLIN distribution, see our page on October 2011 site visits).
What is the evidence regarding the general effectiveness of LLIN distributions?
Evidence from small-scale, high-quality studies
The best evidence for the effectiveness of LLIN distributions comes from randomized controlled trials of insecticide-treated net campaigns, which are reviewed in two Cochrane reviews (Lengeler 2004a; Gamble, Ekwaru, and ter Kuile 2006). We have separately found, examined, and summarized the papers reviewed in Lengeler 2004a.9 The studies are mostly short-term, examining insecticide-treated nets (not necessarily LLINs) over a period of 6 months to 2 years.
Lengeler's (2004a) meta-analysis, examining 22 studies,10 found:
- Mortality (5 studies): a statistically significant impact on all-cause mortality in children under 5, summarized as "5.53 deaths averted per 1000 children protected per year" with no clear dependence on one measure of the regional malaria transmission dynamics.11
Two studies attempted to examine malaria-specific mortality and found smaller or similar-sized effects, which the review author attributes to the difficulty of attributing mortality to malaria.12
Note that the above figure ("5.53 deaths averted per 1000 children protected per year") is based on people who could be covered by the ITNs distributed, not on people who are confirmed to be using ITNs (i.e., the implication is that .00553 lives are saved for every child under five who could be covered by a distributed ITN, not that .00553 lives are saved for every child under five who is confirmed to be using an ITN).13
- Anemia (9 studies): statistically significant impacts on haemoglobin levels, about +1.3 g/L when insecticide-treated nets were compared to untreated nets and +5.7 g/L when insecticide-treated nets were compared to no nets.14 (More on how to interpret these g/L figures at our writeup on deworming.)
- Splenomegaly (enlarged spleen) (5 studies): about 23% protective efficacy (which we presume means that the nets reduced splenomegaly by 23%) when insecticide-treated nets were compared to untreated nets and 30% protective efficacy when insecticide-treated nets were compared to no nets.15
- Effects that were usually statistically significant in individual trials, but were not combined into summary analysis, for severe malarial disease,16 uncomplicated clinical episodes of malaria,17 prevalence of malaria parasites,18 high parasitemia (prevalence of malaria parasites in the blood),19 and nutrition-related measures (weight for age, weight for height, mean mid-upper arm circumference but not height-for-age or unspecified other measures).20
Gamble et al. (2006) focused on the effects on pregnant women; it examined fewer studies than Lengeler (2004a) (6 vs. 22). It connected ITNs with statistically significant reductions in the risk of low birthweight and fetal loss (only in women with four or fewer previous pregnancies) and in placental malaria (overall), but not in anemia/haemoglobin measures.21
We focus here on Lengeler (2004a) because (a) it reviewed more studies; (b) it had a general-population focus and was thus more in line with the programs we seek to evaluate and the effects we seek to assess (particularly the effects on mortality).
What sorts of programs were carried out in small-scale studies?
We have examined and summarized the papers reviewed in Lengeler (2004a),22 seeking to better understand the basic approaches of the programs that led to the results discussed above. We found:
- The details of the programs are often unclear.
- The programs' approaches varied; most consisted of free ITN distribution, or treatment of existing untreated nets with insecticide (effectively turning untreated nets into ITNs), but some involved promotion/marketing of nets and treatment.
- All of the studies examining child mortality involved distribution of ITNs to entire communities, not just to children under five. Only two studies distributed ITNs specifically to children under five.
- In most studies, coverage of ITNs was very low prior to the program (though there was often high coverage of untreated nets), and substantially higher afterward.
-
Many studies report intensive measures to ensure that people used their ITNs consistently and properly - measures well beyond what we would expect to be feasible in a larger-scale distribution (and well beyond the measures taken by the Against Malaria Foundation). Sample quotes:23
- "Each village was visited daily by a supervisor who checked the dilution of the permethrin and the progress of the installation."
- "Care was taken to place the nets over all beds in each selected house"
- "Mothers of the children in the study cohort were reminded weekly how to use the net. Nets which became torn or damaged were repaired or replaced. A survey was conducted every 4 weeks during the rainy season to determine whether the bed nets had been tucked in and the entry flaps placed correctly."
- "After distribution, study staff went door-to-door to ensure that nets were hung properly."
- "At mass meetings of the intervention group males, insecticide dipping procedures and net erection methods were demonstrated...Two months after bed net distribution, the teams revisited the trial families to give further encouragement."
-
Usage does not appear to have been near-universal. Most studies report usage rates in the range of 60-80%, though some report 90%+ usage.
- Only two studies specifically reported both reported usage and actual usage as determined by surprise visits to homes. In one, actual usage was 70-73% while reported usage was 85%; in the other, actual usage was 85% and reported usage was 97%.24
The author of Lengeler (2004a) has stated to us that few if any randomized controlled trials have been done since this review, and that few are likely to be done, since the efficacy of ITNs is well enough established that such studies could face challenges with ethics boards.25
How have larger-scale distributions compared to the programs addressed in these studies?
Funding for malaria control has increased substantially since 2004, making a large number of national scale-ups possible.26
As noted above, the studies discussed above may have differed substantially from what can be expected of an "average" ITN distribution. The review author notes this, stating, "the bulk of data in this review describe impact under ideal trial conditions (efficacy) rather than impact under large-scale programme conditions (effectiveness). While the difference between efficacy and effectiveness is likely to be small for certain medical interventions (such as vaccination or surgery), it can potentially be large for preventive interventions such as ITNs."27
In order to get a sense for how the large-scale performance of LLINs has compared with the promise of the smaller-scale studies discussed above, we have asked the following key questions:
- How have officially delivered LLINs matched up with LLINs confirmed to be in use by actual households?
- What has been the general pattern of LLIN usage, i.e., have people used their LLINs?
- What has been the connection between LLIN usage and drops in malaria deaths and morbidity?
We feel that malaria scholars have used reasonably credible data to provide helpful answers to #1 and #2. We feel that #3 is substantially harder to answer due to issues with malaria data and the difficulty of isolating the impact of LLINs; it seems likely to us that malaria has generally been on the decline since the increase in LLIN distribution began (and that it was not before the increase began), but we do not have enough information to be highly confident that this is the case, or to confidently attribute the change to LLIN distribution as opposed to other control measures. Details follow.
From LLIN distribution to LLIN ownership
It appears to us that malaria control programs commonly use an "8%-20%-50%" model to estimate the percentage of distributed LLINs that remain in the field years later: they assume that 8% of LLINs distributed 0-12 months ago are no longer in the field (whether because of loss in the process of delivery, falling into disrepair, being given away, etc.), that 20% of LLINs distributed 12-24 months ago are no longer in the field, and that 50% of LLINs distributed 24-36 months are no longer in the field. The very limited evidence we have seen on this topic appears consistent to us with the idea that this model is the best available. Further discussion of this topic is available at another page, for the sake of brevity.
From LLIN ownership to LLIN usage
We used data from national surveys collected in the WHO World Malaria Report to analyze net usage rates in sub-Saharan Africa. We report results from the 2010 and 2012 editions of the World Malaria Report, which cover different survey years and may use slightly different methodologies (though it is difficult to know from the information available in the reports).28 Our findings are below.
2010 World Malaria Report
In the 2010 World Malaria Report, net usage rates are determined by using national population surveys to compare (a) the percentage of the population that could theoretically be protected by owned ITNs based on an assumption that each ITN protects two people,29 with (b) the percentage of the population that reports using an ITN.30 The 2010 World Malaria Report finds 3 countries in sub-Saharan Africa with greater than 100% apparent usage (this could be a function of more than 2 people covered by each ITN in some cases,31 combined with possible over-reporting of usage in surveys), 2 countries with very low apparent usage (Swaziland, 0%, and Nigeria, 40%), and 7 countries with apparent usage ranging from 69% to 85%.32
2012 World Malaria Report
The 2012 World Malaria Report tabulates results from national population surveys, and compares (a) the percentage of the population that could theoretically have access to an owned ITN in their household, assuming that each ITN within a household protects two people and does not protect anyone outside of the household,33 with (b) the percentage of the population that reported using an ITN the previous night.34 It finds slightly higher usage rates than the 2010 World Malaria Report. In 17 sub-Saharan African countries that conducted surveys from 2009-2011, the median net usage rate was 91%, with an interquartile range of 82%-98% usage.35
Over-reporting
It is possible that survey data overstates usage; in our discussion of small-scale studies above, we cite one study where actual usage (as assessed by spot visits to homes) was 70-73% while reported usage was 85%.36
If we assume an equal amount of over-reporting in the national surveys as in the small-scale study, and apply this adjustment to the 2010 World Malaria Report data, actual net usage rates would range from 57% to 73%.37
If this adjustment were applied to the 2012 World Malaria Report data, the interquartile range for net usage rates would be 68% to 84%.38
Bottom line
Broadly speaking, the net usage figures implied by surveys gathered in the World Malaria Report are similar to what was found in the small-scale studies discussed above (which had net usage rates generally in the 60%-80% range),39 even after accounting for minor over-reporting. However, this data and our analysis of it could easily be unreliable.40
From LLIN usage to reduced malaria burden
Funding for malaria control has increased substantially since 2004, making a large number of national scale-ups possible. Accordingly, we have looked into the question of whether the impact of LLINs on the burden of malaria can be directly seen in available data (outside the context of intensive small-scale studies). Our discussion is on a separate page, for brevity.
In brief: data and studies appear to show some cases of apparent malaria control success, and also seem to indicate that the overall burden of malaria in Africa is more likely to be falling than rising. However, in most cases it is difficult to link changes in the burden of malaria to particular malaria control measures, or to malaria control in general; and the data remains quite limited and incomplete, such that we cannot confidently say that the burden of malaria has been falling on average. We can imagine that a malaria scholar, with more context than we have on the strengths and weaknesses of different data sets and the histories of malaria control in different areas, could have a higher degree of confidence in the idea that malaria control (and LLINs in particular) has contributed to major declines in the burden of malaria.
Possible developmental effects
As noted above, ITN distribution appears to have benefits other than reduced mortality, such as reduced anemia (an effect size larger than what we have seen for deworming). In addition, Bleakley 2010 makes a case that reducing the burden of malaria may have a lasting impact on children's development, and thus on their ability to be productive and successful throughout life. This is a similar paper, with similar results, to one of the two major pieces of evidence for the developmental impact of deworming.
Bleakley 2010 analyzes a number of attempts to eliminate malaria in the Americas during the early-to-mid 20th century, focusing on the U.S., Brazil, Columbia, and Mexico. He concludes:
There are good reasons to be cautious in using this study as evidence relevant to ITN distribution:
- The programs studied were very different from LLIN distribution campaigns: they focused on indoor residual spraying and other interventions, and did not involve bednets.42
- The context was very different from that of modern-day ITN distributions: the campaigns took place in the U.S.A. of the 1920s and Latin America of the 1950s, where the impact of malaria could have been very different from the consequences in the modern-day developing world (and the infections themselves may have been quite different as well).
- Bleakley 2010 is not an experimental study, but a retrospective one. That is, rather than setting out to answer a question by collecting new data, the author collected and analyzed a large amount of pre-existing data, raising strong possibilities for publication bias. We believe it is unlikely that this paper would have been published in a major economics journal if it had simply concluded that there was no strong evidence for major benefits of malaria eradication. We are generally very hesitant to use papers of this nature in our work. This worry is enhanced by the use of multiple different outcomes and measures of malaria prevalence across the different countries studied, raising the possibility that the author could have selected those specifications that make the outcomes most interesting (in this case, positive for malaria eradication).
That said, we believe the paper merits some weight on the question of developmental benefits, because:
- It has a plausible strategy for separating the effects of malaria infection from effects of other things (such as poverty) that may correlate with malaria infection. Specifically, it exploits the fact that the eradication campaigns caused a relatively rapid drop in malaria infection rates (which was plausibly exogenous because of technological advancement in the creation of DDT) and that areas with higher initial malaria prevalence saw greater falls in malaria prevalence.43 Thus, it seems possible that a connection between the fall in malaria prevalence and positive life impacts - coinciding with the timing of the campaign - could be attributed specifically to malaria eradication, and not to other factors.
- It uses graphs to illustrate a relationship between malaria prevalence and later-in-life income that, while varying across countries, shows that the correlation between baseline malaria rates and adult income was negative and fairly constant, then turned into "zero effect" (when adjusted using a set of controls), coinciding well with the timing of the eradication campaign. It seems difficult to explain this pattern except by attributing the change to the drop in malaria prevalence, though it is worth noting that the relationship in Colombia becomes positive, which is unexpected.44
- It addresses multiple alternate possible explanations for its observations, including a fairly robust set of controls, though they vary by country (because there is no consistent set of cross-country and cross-time data).45
- It covers a number of very large-scale campaigns. While randomized controlled trials allow for a cleaner connection between a program and its effects, a large-scale study like this seems likely to be less dependent on idiosyncratic aspects of a particular mini-program designed to be studied.
Bleakley 2010 also finds effects on school enrollment that vary by country.46
Possible negative/offsetting impact
- Possible development of insecticide resistance. There appears to be consensus in the malaria community that the use of LLINs will contribute to the development of insecticide resistance. We discuss this issue in greater depth on a page focused on insecticide resistance. In brief, we feel that resistance is a very serious concern, and would like to see substantially more data available to assess it. It also appears to us that the malaria control community has been devoting attention and investigation to this issue, has developed a reasonable knowledge base (if one that has plenty of room to grow), and still recommends the use of LLINs regardless of the resistance situation. A reasonable summary of the malaria community's perspective is available in notes from our conversation with the WHO's Dr. Abraham Mnzava.
- Possible postponement of human immunity. It has been argued that LLINs, by protecting children from mosquitoes, may not only reduce the short-term burden of malaria, but may also reduce opportunities for humans to acquire immunity, making them more susceptible to malaria over the long term.47 A 2010 paper claims that this question has been "answered, with a clear indication that even seven years after initial exposure of infants to ITN, no increased mortality could be observed"48 and cites three sources: Binka et al. 2002, Diallo et al. 2004, and Lindblade et al. 2004. All of these appear to be follow-ups on the small-scale, high-quality studies that originally established the impact of ITNs on child mortality, and all appear (from their abstracts; we have not vetted the papers further) to find that reductions in child mortality were sustained in the several years after the initial study.49 These follow-ups account for 3 of the 5 studies that originally established an impact of LLINs on child mortality. We have emailed the authors of all five studies to ask whether there have been any follow-ups beyond the latest we're aware of; in 4 of 5 cases, it's been confirmed that no more follow-ups were done, and in the fifth case we have not heard back.
- Undermining private markets. It is possible that giving away LLINs for free causes people to systematically expect that they will continue to receive LLINs for free, and thus causes people to be unwilling to pay for them. (More at a 2012 blog post.)
- Allergic reactions. We have heard anecdotes of minor allergic reactions (e.g., itching skin) to LLINs. We have located no mention of this issue in the Cochrane reviews discussed above and have located very little information on it in general. We did discuss it with program staff during our visit to an ongoing LLIN distribution (we were told that this issue affects few people and can be avoided by letting an LLIN hang for a few days before use). We believe this to be a very minor concern.
- Equity concerns. It is possible that LLIN distribution may cause conflicts if it is not perceived as fair and equitable. We have seen very little evidence on whether this is an issue. We feel that the Against Malaria Foundation takes appropriate steps to mitigate this concern.
Two key issues around LLIN distributions
Targeted vs. universal coverage
It appears that there has been a shift in emphasis over the last several years from targeted coverage (aiming primarily to cover children under five and pregnant women with ITNs) to universal coverage (aiming to protect everyone in a community with ITNs).
The 2004 Cochrane review discussing the impact of ITNs on under-5 mortality (discussed above) appears to advocate primarily for coverage of children under five,50 and as of 2006 this seemed to be the focus of the Roll Back Malaria Partnership, the United Nations Millennium Development Goals, and the US President's Malaria Initiative as well.51 However, in 2007 the World Health Organization issued a recommendation for universal coverage that appears to have been an explicit change in position.52
We did a brief investigation of the arguments for targeted vs. universal coverage, because we wondered whether the Against Malaria Foundation's focus on universal coverage was justified. It seemed to us that if the main benefit of ITNs is in reducing mortality for children under five, then targeting children under five could achieve most of the benefits of universal coverage, for a fraction of the cost. On the other hand, there is a potential argument for universal coverage based on the possibility that universal coverage will be more likely to have community-level effects.53
Our investigation consisted of:
- Speaking with Christian Lengeler, the author of the Cochrane review of the evidence regarding ITN distribution discussed above. (This Cochrane review appears to us to be the most widely cited evidence of the efficacy of ITNs.54 ) We have published our notes from this conversation.55
- Speaking with two scholars that Professor Lengeler referred us to on this question, Dave Smith and Thomas Smith. We have published notes from each of these conversations.56
- Reviewing literature that these scholars referred us to.
Our conclusions are:
- The evidence for the efficacy of ITNs in the Cochrane review is based on studies of universal coverage programs, not targeted programs. In particular, all five studies relevant to the impact of ITNs on mortality involved distribution of ITNs to the community at large, not targeted coverage (see above). (We confirmed this in our examination of the individual studies cited in the Cochrane review.57 ) Thus, there is little basis from the Cochrane review for determining how the impact of ITNs divides between individual-level effects (protection of the person sleeping under the net, due to blockage of mosquitoes) and community-level effects (protection of everyone in communities where ITN coverage is high, due to reduction in the number of infected mosquitoes, caused either by mosquitoes' being killed by insecticide or by mosquitoes' becoming exhausted when they have trouble finding a host).
- The people we spoke to all believe that the community-level effect of ITNs is likely to be a significant component of their effect, though none believe that this effect has been conclusively demonstrated or well quantified.58
- There is some empirical evidence suggesting that the community-level impact of ITNs is significant.
- We reviewed one study, Hawley et al. 2003, which examined data from a randomized study of ITNs and compared (a) households not selected to receive ITNs but living near other households that had been selected to receive ITNs to (b) households not selected to receive ITNs living far from other households that had been selected to receive ITNs.59 Non-ITN households were divided into quartiles based on proximity to ITN households, and statistically significant trends were observed for child mortality, hemoglobin level and percentage anemic (e.g., non-ITN households showed more favorable performance on these measures as they got closer to ITN households), though the trends were not significant for two other measures of malaria burden.60 For the set of non-ITN households closest to ITN households, malaria outcomes were similar to those for ITN households themselves.61 We find this study credible, although we note that this was a separate analysis of data from a trial of ITN efficacy, so it may be susceptible to publication bias.
- This study cites eight other studies arguing for significant community-level effects on malaria transmission and one study arguing against this idea. Of these nine, only two (both arguing for community-level effects) examine measures of malaria morbidity/mortality as opposed to simply transmission.62 We have not examined these studies.
- Counter-evidence comes from the Cochrane review focused on pregnant women (which is not the main one we have discussed):
The most recent trial from western Kenya by Njagi et al. is informative in this respect, as it is the only trial that compared the effects of ITNs versus no nets using simple randomisation by individual in an area with low ITN coverage (little or no mass effect) [24,29]. This trial and the community-randomised trial by ter Kuile et al. [27] were conducted simultaneously in contiguous areas with similar malaria transmission at baseline, and similar socioeconomic and educational status and ethnicity of the trial population. The effect estimates were similar between the two trials (in women not randomised to IPTp-SP), suggesting that ITNs may work equally well when provided to individuals as part of antenatal care in the second trimester or when provided to entire communities.63
The scholars we spoke with also pointed us to papers attempting to model malaria transmission mathematically.
- One such paper, Killeen et al. (2007), that we were pointed to by two of the scholars we spoke to and has been described as a particularly influential paper,64 uses a relatively detailed model of mosquito behavior, which we have not independently vetted and assessed, in order to conclude that "high (80% use) but exclusively targeted coverage of young children and pregnant women (representing <20% of the population) will deliver limited protection and equity for these vulnerable groups. In contrast, relatively modest coverage (35%–65% use, with this threshold depending on ecological scenario and net quality) of all adults and children, rather than just vulnerable groups, can achieve equitable community-wide benefits equivalent to or greater than personal protection."65
- Smith et al. (2009) proposes a model for the relationship between ITN coverage and effective protection for the community. This model implies that each incremental increase in ITN coverage is more valuable to the community than the previous increase (e.g., going from 60% to 70% coverage would be more valuable than going from 50% to 60% coverage, which in turn would be more valuable than going from 40% to 50% coverage).66
We asked one scholar whether there were any prominent papers in this category making the opposite argument (that community-level effects are likely to be insignificant) and he replied that he did not know of any.67
We do not find the evidence for community-level impact to be conclusive, but we believe that the best interpretation of the available evidence suggests at least some community-level impacts, consistent with the consensus of the scholars we spoke to and the World Health Organization.
Free vs. cost-recovering distributions
There has been some debate about whether ITNs should be sold or given freely, with some arguing that selling them (even for highly subsidized prices) may improve the likelihood that they get to people who will use them. We believe that the weight of the (limited) available evidence supports giving out ITNs rather than selling them. Evidence implies that charging a fee has significantly reduced demand for the product, without leading to corresponding increases in utilization rates (and has not significantly impacted the costs of the program).
- One high-quality study evaluated the impact of user fees on net purchase and on utilization of the net. A program distributing nets at prenatal clinics in Kenya found that increased prices (from $0 to $0.75, the price at which they were sold) reduced demand by approximately 75%,68 but were not associated with higher rates of utilization.69
- A review of high-quality studies on this general issue cites two other studies. One found that charging for deworming drugs significantly reduced demand while raising little revenue and failing to improve the targeting of recipients70 ; another found that charging for water disinfectant "led to a rapid drop-off in take-up, with no evidence of increased targeting to the most vulnerable" while slightly increasing utilization rates.71
- The study on The Gambia (discussed above) reports that individuals given free nets in year one, who were then asked to pay for insecticide to retreat them in year two, saw a significant reduction in coverage and a rise in child mortality.72
- The study on Kenya's program (discussed above) reports that Kenya began selling nets at subsidized prices starting in 2002.73 Net coverage rates remained extremely low, at 25%,74 so in 2004, Kenya sold more heavily subsidized nets.75 In 2006, the program began distributing nets for free,76 raising net coverage to 79% between 2006 and 2007.77
- As discussed above, there is a case that ITNs provide community-level protective benefits, so increasing the level of coverage in a community could be beneficial to everyone, not just ITN users. This gives some additional reason for giving out ITNs for free.
How cost-effective is LLIN distribution?
Two general notes on the limitations to cost-effectiveness analysis such as this:
- Such analysis will usually draw its main estimates of program effects from small-scale, high-quality studies (our analysis here is no exception). These studies may be unrepresentative of real-world conditions, on account of being carried out in optimal locations and with unusual amounts of funding and intensity.
- We believe that cost-effectiveness estimates such as these should not be taken literally, due to the significant uncertainty around them. We provide these estimates (a) for comparative purposes and (b) because working on them helps us ensure that we are thinking through as many of the relevant issues as possible.
We provide a spreadsheet78 that estimates the (a) cost per life saved, (b) cost per person protected per year, and (c) cost per child under 14 protected per year. Cells highlighted in green represent particularly debatable and/or variable parameters; readers can change these (or any other figures) to see how the outcomes are affected.
Our analysis is relatively simplified and unlikely to capture all of the key issues. Some key assumptions and choices made in our model:
- We build the model on the Cochrane review's conclusion that each effective year of protection for children under five results in 0.00553 lives saved.79
- We include a simple adjustment to account for the fact that child mortality rates are lower today than they were at the time of the studies on ITNs.80 This adjustment assumes that ITNs avert the same proportion of under-5 deaths that they averted at the time of the studies. This could be incorrect.81
-
LLINs are assumed to last 2.22 years on average, consistent with the decay model discussed above.82
- We assume that LLIN usage is in line with what was observed in the small-scale studies discussed above. We believe this is an appropriate assumption based on the available data, as discussed above.83
- Rather than explicitly model usage, we base our calculation only on coverage, using a "lives saved per person-year of protection" figure that is itself based on coverage, not usage.84
- We model community-level effects crudely.85
- Our estimate does not include the possible concerns discussed above around negative/offsetting impact (delaying the development of immunity, causing allergic reactions, etc.) with the exception of insecticide resistance. We believe that these are minor concerns.
- Our estimate does not include the many possible benefits of malaria control aside from saving the lives of children under 5. These may include developmental effects, saving the lives of people over the age of 5,86 benefits to the health system of a reduced malaria burden, etc.
A description of the major updates that we made to this cost-effectiveness analysis in 2013 is in this footnote.87
Bottom line
Our best-guess estimate comes out to about $3,300 per life saved using the total cost per net and about $2,900 per life saved using the marginal cost per net (see details on total versus marginal costs per net in our spreadsheet analysis). We also show the number of children under 14 who are protected for each life saved, since ITN protection may yield non-mortality-related benefits comparable to those of deworming, and we provide some rows that account for this additional benefit in order to allow more intuitive comparisons between the two interventions. LLIN distribution is in the same range of cost-effectiveness as our other priority programs.
We also provide reference points for conversions to the cost per disability-adjusted life-year (DALY), a common metric in public health. We have found this metric to add more confusion than clarification,88 but we provide this information for those who find it helpful. Note that our cost per DALY figures are based only on lives saved and do not account for other benefits.
We encourage readers who find formal cost-effectiveness analysis important to examine the details of our calculations and assumptions, and to try putting in their own. To the extent that we have intuitive preferences and biases, these could easily be creeping into the assumption- and judgment-call-laden work we’ve done in generating our cost-effectiveness figures, and we’re not entirely confident that the figures themselves are adding substantial information beyond the intuitions we have from examining the details of them.
Is there room for more funding in LLIN distribution?
Current funding gap
The Roll Back Malaria Partnership's Harmonization Working Group estimates funding gaps for LLINs across all African countries.89 It most recently published a gap analysis in September 2013. At that time, it estimated that about 390 million additional LLINs would be needed in 2013-2016.90 In May and October 2014, we asked the Co-Chair of the Harmonization Working Group for updates on the size of the funding gap. On both occasions she told us that there remained significant gaps in funding for LLINs. She gave the following initial estimates for 2014-2017 (in millions of LLINs):
| Country | 2014 | 2015 | 2016 | 2017 |
|---|---|---|---|---|
| Need | 217 | 235 | 197 | 238 |
| Financed | 197 | 181 | 98 | 41 |
| Gap | 20 | 54 | 99 | 198 |
While we would guess that other funders will contribute some LLINs, the size of the gaps and the persistence of the 2014 gap late into the year, as occurred in 2013 as well,91 suggests that there is, and will continue to be, unmet need for LLINs in African countries.
Past funding gaps
In 2011-2013, funding gaps for bed nets in sub-Saharan Africa were generally significant,92 as we had stated in previous versions of this page.93 In 2013, expected near-term net gaps were significantly reduced, but remained fairly large in absolute terms. For more details on the 2013 net gap, see the 2013 section on room for more funding in LLIN distribution, which has been moved to this footnote.94
Our process for updating this page in 2013 and 2014
In 2013, we only conducted further investigation into issues that (a) could significantly affect our perception of the effectiveness of mass distributions of LLINs and that (b) we could reasonably expect to learn more about in a limited amount of time.
We conducted further research on the following issues:
- Evidence from small-scale, high-quality studies (assessed as up-to-date in September 2013)95
- From LLIN distribution to LLIN ownership (assessed as up-to-date in September 2013)
- From LLIN ownership to LLIN usage96
- From LLIN usage to reduced malaria burden (assessed as up-to-date in September 2013)
- Possible negative/offsetting impact (updates to insecticide resistance and delayed immunity only)97
- How cost-effective is LLIN distribution?98
- Is there room for more funding in LLIN distribution?99
Major questions that may merit further research in the future include:
- What is the impact of insecticide resistance on the current effectiveness of LLINs?
- Do LLINs reduce all-cause mortality for people older than age 5?
- What is the evidence that LLINs have long-term impacts on children?
- Has the proportion of deaths averted by LLINs in under-5-year-olds changed over time because of improvements in general health?
2014
In 2014, we did not reassess the evidence for LLINs. We only updated the room for more funding section of this page.
Sources
Uncited supplementary materials
| Document | Source |
|---|---|
| GiveWell. Country-level charts of ITN coverage vs. malaria mortality | Source |
| GiveWell. Tabulation of ITN coverage vs. malaria mortality | Source |
| Hoffman, Vivian, Christopher Barrett and David Just. 2009. Do free goods stick to poor households? Experimental Evidence on Insecticide Treated Bednets. World Development 37: 607-617 | Source |
| Lopez, Alan D., et al., eds. 2006. Global burden of disease and risk factors | Source |
| O'Meara, Wendy Prudhomme et al. 2010. Changes in the burden of malaria in sub-Saharan Africa | Source (archive) |
| Otten, Mac, and Jo Lines. Where did the LLINs go? An analysis of data from 7 countries with the most recent surveys (2008-2009) | Source |
| Quiñones, M.L. 1998. Permethrin-treated bed nets do not have a 'mass-killing effect' on village populations of Anopheles gambiae s.l. in The Gambia | Source (archive) |
| Roll Back Malaria Partnership. Current status of pyrethroid resistance in African malaria vectors and its operational significance | Source |
| Tami, Adriana et al. 2004. Evaluation of Olyset™ insecticide-treated nets distributed seven years previously in Tanzania | Source |
| Trape, Francois et al. 2011. Malaria morbidity and pyrethroid resistance after the introduction of insecticide-treated bednets and artemisinin-based combination therapies: a longitudinal study | Source (archive) |
| World Health Organization. Profiles: 31 high-burden countries (2009) | Source |
- 1
"In Africa, malaria accounts for an estimated 25% of all childhood mortality below age five, excluding neonatal mortality (WHO 2003)." Lengeler 2004a, Pg 2.
- 2
"Human infection begins when the malaria vector, a female anopheline mosquito, inoculates plasmodial sporozoites from its salivary gland into humans during a blood meal. The sporozoites mature in the liver and are released into the bloodstream as merozoites. These invade red blood cells, causing malaria fevers. Some forms of the parasites (gametocytes) are ingested by anopheline mosquitoes during feeding and develop into sporozoites, restarting the cycle." Jamison et al. 2006, Pg 413.
- 3
"Most malaria infections cause symptoms like the flu, such as a high fever, chills, and muscle pain. Symptoms tend to come and go in cycles. One type of malaria may cause more serious problems, such as damage to the heart, lungs, kidneys, or brain. It can even be deadly." WebMD. Malaria: Topic overview
- 4
See Jamison et al. 2006, Pg 416, Table 21.3 for estimates of cases of hearing impairment, visual impairment, epilepsy, etc. caused by malaria.
- 5
"Using mosquito nets as a protection against nuisance insects was practiced in historical times (Lindsay 1988). During World War II, Russian, German, and US armies treated bed nets and com- bat fatigues with residual insecticide to protect soldiers against vector-borne diseases (mainly malaria and leishmaniasis) (Curtis 1991). In the late 1970s, entomologists started using synthetic pyrethroids: their high insecticidal activity and low mammalian toxicity made them ideal for this purpose.
In the 1980s, studies of ITNs showed that pyrethroids were safe and that ITNs had an impact on various measures of mosquito biting (such as the proportion of mosquitoes successfully feed- ing on humans and the number of times a mosquito bit humans in one night). These studies showed that pyrethroids worked by both repelling and killing mosquitoes. In addition, researchers determined optimal doses of various insecticides with different materials (Curtis 1991; Curtis 1992a; Curtis 1996; Lines 1996; Rozendaal 1989a). The cost-effectiveness of ITNs has also been demonstrated (Goodman 1999; Hanson 2003)." Lengeler 2004a, Pg 2.
- 6
See "Abbreviations" - World Health Organization. World Malaria Report (2012) Pg viii.
- 7
- "Re-treating ITNs semiannually
or just before the annual peak in transmission is essential for
effective vector control and is proving a major logistical and
financial challenge. Fortunately, new types of nets with a long-
lasting insecticidal property are now available, and re-
treatment will soon cease to be an issue." Jamison et al. 2006, Pg 421. - "Sumitomo Chemical's Olyset net uses the latest research and technology to achieve a breakthrough in the global fight against malaria. Permethrin is incorporated inside the Olyset fibres to create a bed net guaranteed to last at least five years.* It is tear-proof, wash-proof, and never requires treatment.
The pyrethroid insecticide permethrin is a synthetic molecule similar to natural pyrethrin, which comes from a species of chrysanthemum. Because it poses minimal toxic risk to humans, Olyset is particularly valuable where babies and small children are concerned." Sumitomo Chemical. Olyset net
- "Re-treating ITNs semiannually
- 8
"WHO recommendations for malaria vector control are the following:
Insecticide-treated nets- As high coverage rates are needed to realize the full potential of vector control, WHO recommends that in areas targeted for malaria prevention, and for which ITNs are selected as the vector control method, they should be made available to all people at risk, i.e. universal access (21). Because of the operational advantages of LLINs over ITNs, and the fact that the vast majority of nets being procured and distributed today are indeed LLINs, the remainder of this section will refer to LLINs rather than ITNs. In order to meet the target of universal access, it is currently proposed that 1 LLIN should be distributed for every 2 persons. At the household level, the distribution of 1 LLIN for every 2 members of the household will entail rounding up in households with an odd number of members (e.g. 3 LLINs for a household with 5 members, etc.) Because of this rounding up, the achievement of 1 LLIN for every 2 people at household level requires an overall ratio, for procurement purposes, of 1 LLIN for every 1.8 people in the target population (17).
- LLINs should be provided either free of charge or be highly subsidized. Cost should not be a barrier to their availability to all people at risk of malaria, especially those at greatest risk such as young children and pregnant women (21) and those in rural communities with least ability to purchase outright or provide a supplemental co-payment.
- Universal access to LLINs is best achieved and maintained by a combination of delivery systems. The basic concept is a combination of ‘catch up’ and ‘keep up’. Catch up involves mass distribution campaigns which can rapidly achieve universal coverage of LLINs. However, it is essential to complement such campaigns with continuous ‘keep up’ delivery systems, particularly routine delivery to pregnant women through antenatal services and to infants at immunization clinics. It should also be noted that targeted distribution to infants and pregnant women will fall short of the quantity needed to maintain universal coverage, and other strategies involving further campaigns may be required (21).
- In order to be protected, individuals must not only own LLINs but also use them. Behaviour change interventions including information, education, communication (IEC) campaigns and post-distribution “hang-up campaigns” are strongly recommended, especially where there is evidence of their effectiveness in improving LLIN usage (21).
- Only LLINs recommended by the WHO Pesticide Evaluation Scheme (WHOPES) should be procured by national programmes and partners for malaria control. At present there are 13 recommended products (22). Detailed guidance on good practice in the handling and use of pesticides, and on quality control in procurement, can be found on the WHOPES website (23). Independent quality control of products (including insecticides) should be undertaken before shipment, to ensure that substandard products are not delivered to countries. The suppliers of pesticide should bear the cost of analysis, including the cost of sending samples to an accredited or recognized laboratory for analysis on behalf of countries that do not have adequately equipped or staffed national quality control laboratories (9).
- It is now recognized that the lifespan of LLINs is variable, among settings and among products. Therefore, all large-scale LLIN programmes (including those implemented by NGOs) should make efforts to monitor LLIN durability in local settings, using standard methods published in 2011 (24). The collection of local data on the comparative durability of alternative LLIN products, using rigorous and auditable methods, is expected to enable procurement decisions to be made on the basis of price per year of protection rather than unit price per net; this in turn is expected to bring rapid and potentially substantial cost savings. This is important because LLINs represent a large proportion of the global malaria control budget (18). Efforts are also under way to develop more varied and sophisticated methods for testing the durability of LLINs under simulated laboratory conditions." World Health Organization. World Malaria Report (2012) Pgs 4-5.
- 9
- 10
"The remaining 22 trials, including 1 trial that is currently unpublished, met the inclusion criteria for this review. These trials are described below." Lengeler 2004a, Pg 6.
- 11
"The summary rate difference, which expresses how many lives can be saved for every 1000 children protected, was 5.53 deaths averted per 1000 children protected per year (95% CI 3.39 to 7.67; Analysis 1.2). I performed a regression analysis of the natural logarithm of the rate difference on the entomological inoculation rate and could not find a trend (r^2 = 0.52, F = 3.2 on 1,3 degrees of freedom, P = 0.2). In contrast to protective efficacies, the risk differences seemed to have a tendency towards a higher effect with a higher entomological inoculation rate. This apparent paradox is because the baseline mortality rates are higher in areas with high entomological inoculation rates." Lengeler 2004a, Pg 9. Note on the entomological inoculation rate: “The intensity of malaria transmission measured by the frequency with which people living in an area are bitten by anopheline mosquitoes carrying sporozoites. This is often expressed as the annual entomological inoculation rate (EIR), which is the number of inoculations of malaria parasites received by one person in one year.” World Health Organization. Guidelines for the Treatment of Malaria, 2nd ed. (2010) pg vii.
- 12
"The impact of ITNs on malaria-specific death rates was looked at only briefly because of the problems using verbal autopsies in determining malaria deaths. In the two trials for which the data were available, the percentage reduction in malaria-specific mortality was similar or smaller than the percentage reduction in all-cause mortality: 14% (versus 23%) for Gambia (D'Alessandro et al. 1995), and 22% (versus 18%) for Ghana (Binka et al. 2002). One interpretation is that malaria-specific death rates were not reflecting the true impact of ITNs on mortality (since a much higher specific impact would have been expected)." Lengeler 2004a, Pg 9.
- 13
"The summary rate difference, which expresses how many lives can be saved for every 1000 children protected, was 5.53 deaths averted per 1000 children protected per year (95% CI 3.39 to 7.67; Analysis 1.2)." Lengeler 2004a, Pg 8. We have confirmed with the author that this figure is based on an "intention to treat" analysis, e.g., "protected" refers to children in the treatment group, not to children who were confirmed to own or use ITNs.
- 14
- "Anaemia: expressed in mean packed cell volume (PCV); it is equivalent to the percentage haematocrit. Results given in g/decilitre were converted with a standard factor of 3:1, that is, 1 g/decilitre equals 3%PCV." Lengeler 2004a, Pg 4.
- " The nine trials that measured anaemia were conducted in areas of stable malaria; six trials compared treated to untreated nets (Appendix 13), and three trials compared treated nets to untreated nets (Appendix 14). Overall, the packed cell volume of children in the ITN group was higher by 1.7 absolute packed cell volume per cent compared to children not using nets. When the control group used untreated nets, the difference was 0.4 absolute packed cell volume per cent." Lengeler 2004a, Pg 9.
- 0.4 packed cell volume converts to (0.4/3 * 10) = 1.3 g/L using the conversion factor provided (and multiplying by 10 to convert from g/dL to g/L). Similarly, 1.7 packed cell volume converts to (1.7 / 3 * 10) = 5.7 g/L.
- 15
"Four out of the five trials that measured splenomegaly were carried out in areas with stable malaria (Appendix 15 and Appendix 16). Because the exception was one trial carried out in Thailand whose weight is very small (only 2.6% in the relevant comparison) (Thailand (Luxemberger)), I did not carry out a subgroup analysis. Splenomegaly was significantly reduced for both types of controls: there is a 30% protective efficacy when controls were not using nets, and a 23% protective efficacy when the control group used untreated nets." Lengeler 2004a, Pg 9.
- 16
"Only one trial examined severe malarial disease as an outcome Kenya (Nevill). The trial used passive and hospital-based case ascertainment, and observed a 45% (cluster-adjusted 95% CI 20 to 63) reduction in the frequency of severe malaria episodes follow- ing the introduction of ITNs (Appendix 4)." Lengeler 2004a, Pg 8.
- 17
"Uncomplicated clinical episodes:
The trial results are available in Appendix 5 for no nets controls and in Appendix 6 for untreated nets controls. A summary of the main findings for protective efficacies is available in Appendix 7; confidence intervals were not calculated as this analysis includes both cluster and individually randomized controlled trials. No risk or rate differences were calculated because the denominators were not uniform and the sensitivity of the reporting systems of the different trials is likely to have varied considerably. Three findings can be highlighted.
- The effect of ITNs on uncomplicated clinical episodes of malaria is shown by large effect estimates in all trials. Overall, the reduction in clinical episodes was around 50% for all subgroups (stable and unstable malaria; no nets and untreated nets) and for both P. falciparum and P. vivax.
- The protective efficacy is higher (at least 11% for P. falciparum) when the control group had no nets. This was expected and it was the reason to create two separate comparisons. In areas with stable malaria (entomo- logical inoculation rate > 1) the differences in protective efficacies against uncomplicated malaria was 11% (50% no nets versus 39% untreated nets). In areas with unstable malaria (entomological inoculation rate < 1), the differences were bigger: 23% (62% no nets versus 39% untreated nets) for P. falciparum, and 41% (52% no nets versus 11% untreated nets) for P. vivax.
- In areas of unstable malaria (entomological inoculation rate < 1), the impact against P. falciparum episodes seemed to be higher than the impact against P. vivax episodes."
Lengeler 2004a, Pg 9.
- 18
"Parasite prevalence:
The results are available in Appendix 8 for no nets and in Appendix 9 for untreated nets controls. The results for both groups are summarized in Appendix 10; confidence intervals were not calculated as this analysis includes both cluster and individually randomized controlled trials. Two points can be highlighted from these results.
- In areas of stable malaria, impact on prevalence of infection (measured through cross-sectional surveys) was small: 13% reduction when the control group did not have any nets and 10% reduction when the control group had untreated nets.
- In areas with unstable malaria, the results are of limited value because there was only a single trial in each subgroup (treated versus no nets; and treated versus un- treated nets).
Lengeler 2004a, Pg 9.
- 19
"High parasitemia:
The results are shown in Appendix 11 for no nets and Appendix 12 for untreated nets controls. This outcome was only assessed for trials in areas of stable malaria, where parasitaemia does not necessarily lead to a clinical episode, and where parasitaemia cut- offs are useful to define disease episodes. Five trials measured this outcome: four used 5000 trophozoites/ml as the cut-off, while the fifth trial used an age-specific cut-off (Kenya (Phillips-Howard)). The protective efficacy was 29% for the two trials in which the control group did not have nets, and was 20% for the three trials in which controls had untreated nets." Lengeler 2004a, Pg 9.
- 20
"Three trials carried out with ITNs have demonstrated a positive impact on anthropological measurements in children sleeping under treated nets.
In Gambia (D'Alessandro et al. 1995), mean z-scores of weight-for-age and weight-for-height were higher in children from treated villages (-1.36 and -0.98, respectively) than in those from untreated villages (-1.46 and -1.13, respectively). The differences were statistically significant after adjustment for area, age, differential bed net use, and gender (P = 0.008 and P = 0.001, respectively). There was no statistically significant difference in me significant an z-scores for height-for-age.
In the trial carried out in Kenya (Kenya (Nevill)), infants sleeping under ITNs in the intervention areas had statistically significantly higher z-scores for weight-for-age than control infants not under treated nets (analysis of variance allowing for season, gender, and age: F = 21.63, P = 0.03). Mean mid-upper arm circumference z-scores were also statistically significantly higher among infants in the intervention communities (analysis of variance allowing for survey, gender, and age: F = 19.0, P = 0.005) (Snow 1997).
In Kenya (Kenya (Phillips-Howard)), protected children under two years of age had a statistically significantly better weight-for- age z-score than unprotected children (P < 0.04). No other statistically significant differences were measured for other parameters or other age groups, although all z-score differences between intervention and control groups were in favour of the protected group." Lengeler 2004a, Pgs 9-10.
- 21
“Six randomized controlled trials were identified, five of which met the inclusion criteria: four trials from sub-Saharan Africa compared ITNs with no nets, and one trial from Asia compared ITNs with untreated nets. Two trials randomized individual women and three trials randomized communities. In Africa, ITNs, compared with no nets, reduced placental malaria in all pregnancies (risk ratio (RR) 0.79, 95% confidence interval (CI) 0.63 to 0.98). They also reduced low birthweight (RR 0.77, 95% CI 0.61 to 0.98) and fetal loss in the first to fourth pregnancy (RR 0.67, 95% CI 0.47 to 0.97), but not in women with more than four previous pregnancies. For anaemia and clinical malaria, results tended to favour ITNs, but the effects were not significant. In Thailand, one trial randomizing individuals to ITNs or untreated nets showed a significant reduction in anaemia and fetal loss in all pregnancies but not for clinical malaria or low birthweight.” Gamble, Ekwaru, and ter Kuile 2006, Pg 1.
- 22
- 23
- 24
GiveWell. Summary of ITN RCTs, Sheet 1, cells Q14-R14, Q21-R21.
- 25
"To the best of my knowledge there have been no more RCTs with treated nets. There is a very strong consensus that it would not be ethical to do any more. I don't think any committee in the world would grant permission to do such a trial." Christian Lengeler, author of Cochrane Review of insecticide-treated bed nets, phone conversation with GiveWell, November 2, 2011
- 26
See World Health Organization. World Malaria Report (2012) chart on Pg 16.
- 27
"The results presented in this review are from randomized controlled trials where the intervention was deployed under highly controlled conditions, leading to high coverage and use rates. The one exception is Gambia (D'Alessandro et al. 1995), which was a randomized evaluation of a national ITN programme in which the intervention deployment was not as good as in the other trials. Therefore, the bulk of data in this review describe impact under ideal trial conditions (efficacy) rather than impact under large-scale programme conditions (effectiveness). While the difference between efficacy and effectiveness is likely to be small for certain medical interventions (such as vaccination or surgery), it can potentially be large for preventive interventions such as ITNs.
Some of the consequences of moving from a scientific trial towards a large-scale programme is illustrated by the results of the two mortality trials carried out in The Gambia. The first trial was carried out under well-controlled implementation conditions, with a high coverage rate in the target population (Gambia (Alonso)). Unfortunately it was not randomized and hence not included in the present analysis. The second one was the evaluation of a national impregnation programme carried out by primary health care personnel and which faced some operational problems (leading, for example, to a lower than expected insecticide dosage) and a lower coverage rate (around 60%) of the target population (Gambia (D’Alessandro)). The difference of impact between the two studies is important: the first trial achieved a total reduction in mortality of 42%, while the protective efficacy in the second trial was 23%. It is not clear whether the difference in the baseline mortality rate (42.1 versus 24.3 deaths per 1000 in the control group) played a role in this difference of impact." Lengeler 2004a, Pg 10.
- 28
Possible methodological differences between the reports include:- The 2012 World Malaria Report is explicit that its calculation of net usage is: (# of people who report using bed nets) / (# of people with access to owned bed nets in their household, assuming that each net can cover 2 people and that a net does not cover anyone outside of the household). The 2010 World Malaria Report does not provide detailed information about its net usage calculation. It is possible that its calculation of net usage is: (# of people who report using bed nets) / (# of owned bed nets * 2). If this difference exists, it would partly explain the higher apparent usage in the 2012 World Malaria Report because the denominator in the 2012 report would be smaller than the denominator in the 2010 report.
- The surveys included in the 2012 World Malaria Report seem to survey reported usage by asking whether individuals slept under an ITN the previous night (see World Health Organization. World Malaria Report (2012) Annex 5, Pg 212). It is unclear what period of time spent sleeping under an ITN is asked about in the surveys included in the 2010 World Malaria Report.
- 29
"In reviewing household surveys that provide the most recent results available on ITN coverage for 27 malaria-endemic countries between 2003 and 2009, it was evident that relatively low proportions of households own an ITN (median 16%, lower quartile 5%, upper quartile 45%); only 7 surveys were conducted during the massive expansion of ITN programmes from 2008 to 2010. However, within all surveys, a high proportion of available nets appear to be used (approximately 80%) assuming that one net can cover two people (Fig. 4.6a). Some countries such as Madagascar (2008) and Rwanda (2008) have higher rates of use than others. These results are consistent with previous analyses which suggest that the main constraint to enabling persons at risk of malaria to sleep under an ITN is lack of availability of nets (3)." World Health Organization. World Malaria Report (2010) Pg 23.
- 30
World Health Organization. World Malaria Report (2010) Table 4.2, Pg 19.
- 31
"In some cases the percentage of people living in households in which all members sleep under a net exceeds the percentage of households with enough nets to cover all occupants. Evidently in some households more than two people are sleeping under one net."
World Health Organization. World Malaria Report (2010) Pg 23.
- 32
World Health Organization. World Malaria Report (2010) Table 4.2, Pg 19.
- 33
“The proportion of the population with access to an ITN in the household (Footnote 2: Assuming 2 persons per ITN and the number of persons with access to an ITN cannot be greater than the number of persons sleeping in the household.) ranged from 2%-18% in initial surveys to 28-64% in the most recent surveys.” World Health Organization. World Malaria Report (2012) Pg 25.
- 34
World Health Organization. World Malaria Report (2012) Annex 5, Pg 212.
- 35
"In surveys from 17 countries in sub-Saharan Africa conducted during 2009–2011, the median proportion of the population using an ITN among the population with access to one was 91% (IQR 82%–98%). However, this includes households using nets beyond their assumed capacity of two persons per net and those households using nets at or below their full capacity. For example, in 21% of Rwandan households surveyed in 2010, a greater proportion of the population slept under an ITN than the proportion which had access to one, while in the remaining 79% of households approximately 71% of persons with access to an ITN slept under one. This same phenomenon resulted in the fraction of the population sleeping under an ITN to be higher than the fraction deemed to have access to one in the Rwanda 2007 survey (Figure 4.4). People use nets that are available at high rates; however, more work needs to be done to ensure that all persons with nets available to them use their nets to full capacity." World Health Organization. World Malaria Report (2012) Pg 25.
- 36
GiveWell. Summary of ITN RCTs, Sheet 1, cells Q14-R14, Q21-R21.
- 37
- As stated above, the 7 'mid-range' countries discussed range from 69-85% reported usage.
- The study discussed has 85% reported usage and 70-73% directly measured usage, for a 82%-86% ratio of directly measured usage to reported usage.
- Applying the 82%-86% ratio to the 77%-94% reported usage results in a range of 57% (69%*82%) to 73% (85%*86%) implied actual usage.
- 38
- As stated above, the interquartile range for reported usage rates in 17 sub-Saharan African countries was 82%-98%.
- The study discussed has 85% reported usage and 70-73% directly measured usage, for a 82%-86% ratio of directly measured usage to reported usage.
- Applying the 82%-86% ratio to the 82%-98% reported usage rates results in a range of 67% (82%*82%) to 84% (98%*86%) implied actual usage.
- 39
- 40
- It does seem possible that the surveys used for the above analysis are less prone to over-reporting than the surveys done in the small-scale studies, because the latter were likely done in the context of ITN promotion programs whereas the analysis above relies on large-scale surveys covering a large number of topics (a sample of the full surveys are available via Measure DHS. Malawi DHS 2010). On the other hand, the intensiveness of the interventions in the small-scale studies may have meant more accurate data collection and/or a higher ratio of actual (correct) usage to reported usage.
- Additionally, evidence from a recent study (Gobena et al. 2012) that directly observes net usage, rather than relying on self-reported survey data, has found very low usage rates (about 33% usage) in Ethiopia. However, we have not vetted this study and have not found other recent studies that use direct observation to measure usage rates.
- 41
- 42
- "The federal government’s large-scale efforts against malaria in the south began with World War I (WWI). In previous wars, a significant portion of the troops were made unfit for service because of disease contracted in or around encampments. The PHS, working now with a strong knowledge base on malaria control and greatly increased funding, undertook drainage and larviciding operations in southern military camps, as well as in surrounding areas. After WWI, the IHB and PHS expanded the demonstration work further. By the mid-1920s, the boards of health of each state, following the IHB/PHS model, had taken up the mantle of the malaria control in all but the most peripheral areas of the region (Williams 1951). The south experienced a drop in malaria mortality of more than 60 percent in the decade of the 1920s." Bleakley 2010, Pgs 5-6.
- "In the early 1950s, the World Health Organization (WHO) proposed a worldwide campaign to eradicate malaria. While the WHO mostly provided technical assis- tance and moral suasion, substantial funding came from USAID and UNICEF. The nations of Latin America took up this task in the 1950s. While individual nations had formal control of the design and implementation of the programs, their activities were comparatively homogeneous as per the dictates of their international funders. The central component of these programs was the spraying of DDT, principally in the walls of houses. Its purpose was not to kill every mosquito in the land, but rather to interrupt the transmission of malaria for long enough that the existing stock of parasites would die out. After that, the campaigns would go into a maintenance phase in which imported cases of malaria were to be managed medically.
The Latin American countries analyzed in the present study (Mexico, Colombia, and Brazil) all mounted malaria eradication campaigns, and all saw large declines in malaria prevalence. Panel A of Figure 1 shows malaria cases per capita in Colombia. (Comparable time-series data were not available for the US, Brazil, or Mexico. Nevertheless, there is little doubt that malaria declined in all four countries immediately following these campaigns.) A decline of approximately 80 percent is seen in the graph. Throughout Latin America, the campaign ultimately proved inadequate to the task, and, in many areas, malaria partially resurged two decades later. But in almost all parts of the hemisphere, malaria never returned to its levels from before the application of DDT." Bleakley 2010, Pg 6
- 43
"How realistic is the assumption that areas with high infection rates benefited more from the eradication campaign? Mortality and morbidity data indicate drops of 50 to 80 percent in the decade after the advent of the eradication efforts. Such a dramatic drop in the region’s average infection rate, barring a drastic reversal in the pattern of malaria incidence across the region, would have had the hypothesized effect of reducing infection rates more in highly infected areas than in areas with moderate infection rates. Data on malaria cases by Colombian departments allow us to examine this directly. The decline in malaria incidence as a function of intensity prior to the eradication campaign is found in panel B of Figure 1. The basic assumption of the present study, that areas where malaria was highly endemic saw a greater drop in infection than areas with low infection rates, is borne out. (Similar results are seen for US and Mexican states. Data for Brazilian states were not available.)
Finally, the timing of the eradication campaign should induce variation in childhood malaria infection that has a marked pattern across year-of-birth cohorts. The present study considers the effects of childhood malaria infection on later- life outcomes, so it is useful to characterize childhood exposure to an eradication campaign. This is shown in Figure 2. Consider a campaign that starts in year zero and takes effect instantaneously. Cohorts born after this date will be exposed to the campaign for their entire childhood. On the other hand, those cohorts who were already adults in year zero will have no childhood exposure to the campaign, while the “in-between” cohorts will be partially exposed during childhood, as shown in Figure 2. I exploit this timing in two ways. First, in Section III, I compare the “born after” cohorts to the “already adult” cohorts by taking differ- ences across these cohort groups. Second, in Section IV, I use the functional form of childhood exposure in estimation using data for all cohorts. (I discuss some alternative functional forms in Section IV.B.)
These four factors (the external origin of the campaigns, the quick reduction of malaria that followed, the use of nonmalarious areas for comparison, and the differential incidence of eradication benefits across cohorts) combine to form the research design of the present study." Bleakley 2010, Pgs 8-9. - 44
See Bleakley 2010, Figure 4, Pg 26.
- 45
See Bleakley 2010, Appendix III, Pg 40, for the full list of controls by country.
- 46
"Mixed results are found for years of education, in contrast with consistently positive effects of malaria eradication on income and literacy. Furthermore, in no country can the change in income be accounted for by the change in years of schooling. These facts are in no way discordant with the economic theory of schooling, which compares returns with opportunity costs. Childhood health plausibly raises both, leaving an ambiguous effect on the optimal time to spend in school. This combination of results, interpreted with simple price-theoretic reasoning regarding the education decision, show that we should be cautious in using changes in time in school as a sufficient statistic by which development and health policies are evaluated." Bleakley 2010, Pg 35.
- 47
“From 1995 onwards, coinciding with the results from the main African ITN trials, a vigorous debate arose about the possibility that the short-term mortality improvements observed in trials of 1–2 years' duration could be offset by increased mortality at older ages — a "delayed mortality" effect (4, 5). The underlying hypothesis was that immunity to malaria would develop more slowly under reduced transmission, leading to a longer period of susceptibility. No direct evidence was available at the time either to support or to refute this hypothesis.” Lengeler 2004b - 48
- 49
- " A 17% efficacy in preventing all-cause mortality in children aged 6–59 months was previously reported from a cluster-randomized controlled trial of insecticide-treated mosquito nets (ITNs) carried out in the Kassena-Nankana District of northern Ghana from July 1993–June 1995. A follow-up until the end of 2000 found no indication in any age group of increased mortality in the ITN group after the end of the randomized intervention. These results should further encourage the use of ITNs as a malaria control tool in areas of high endemicity of Plasmodium falciparum." Binka et al. 2002. This appears to be a followup on Binka et al. 1996 (cited in our GiveWell. Summary of ITN RCTs)
- "OBJECTIVES: To determine the impact of insecticide-treated curtains (ITC) on all-cause child mortality (6-59 months) over a period of six years. To determine whether initial reductions in child mortality following the implementation of ITC are sustained over the longer term or whether 'delayed' mortality occurs … A rural population of ca 100 000 living in an area with high, seasonal Plasmodium falciparum transmission was studied in Burkina Faso. Annual censuses were conducted from 1993 to 2000 to measure child mortality. ITC to cover doors, windows, and eaves were provided to half the population in 1994 with the remainder receiving ITC in 1996. Curtains were re-treated or, if necessary, replaced annually. FINDINGS: Over six years of implementation of ITC, no evidence of the shift in child mortality from younger to older children was observed. Estimates of the reduction in child mortality associated with ITC ranged from 19% to 24%." Diallo et al. 2004, abstract. This appears to be a followup on Habluetzel et al. 1997 (cited in our GiveWell. Summary of ITN RCTs).
- "A total of 130,000 residents of 221 villages in Asembo and Gem were randomized to receive insecticide-treated bednets at the start of phase 1 (111 villages) or phase 2 (110 villages) … Mortality rates did not differ during 2002 (after up to 6 years of bednet use) between children from former intervention and former control households born during phase 1 (HR, 1.01; 95% CI, 0.86-1.19)." Lindblade et al. 2004, abstract. This appear to be a follow-up on Phillips-Howard et al. 2003 (cited in our GiveWell. Summary of ITN RCTs
- 50
"An approximate extrapolation to the current population of children under five years of age at risk for malaria in sub-Saharan Africa (14% of approximately 480 million population at risk, or 67 million children) indicates that approximately 370,000 child deaths could be avoided if every child could be protected by an ITN." Lengeler 2004a, Pg 10.
- 51
"The Roll Back Malaria Partnership, the United Nations Millennium Development Goals, and the US President's Malaria Initiative have set a target of at least 80% use of ITNs by young children and pregnant women (the people most vulnerable to malaria) by 2010." Killeen et al. 2007, Pg 1258. Note that this paper was "received December 22, 2006."
- 52
- "This Position Statement from the WHO Global Malaria Programme (WHO/GMP) describes a shift in guidance on malaria prevention through the use of insecticide- treated nets (ITNs).
The WHO/GMP calls upon national malaria control programmes and their partners involved in insecticide-treated net interventions to purchase only long-lasting insecticidal nets (LLINs). LLINs are designed to maintain their biological efficacy against vector mosquitoes for at least three years in the field under recommended conditions of use, obviating the need for regular insecticide treatment.
In order for their full potential to be realized, LLINs should be deployed as a vector control intervention. WHO/GMP, therefore, recommends full coverage of all people at risk of malaria in areas targeted for malaria prevention with LLINs." World Health Organization. Insecticide-treated mosquito nets: A WHO position statement (2007) Pg 1.
- "GMP now recommends universal coverage with Long Lasting Insecticidal Mosquito Nets. Wherever any of the earlier documents refers to targeted coverage of risk groups only, please refer to superseding guidance on this matter now provided in the 2007 GMP position statement Insecticide-treated mosquito nets: a position statement [the source quoted directly above]." World Health Organization. Publications on insecticide-treated materials: Guidelines
- "This Position Statement from the WHO Global Malaria Programme (WHO/GMP) describes a shift in guidance on malaria prevention through the use of insecticide- treated nets (ITNs).
- 53
There is a distinction between individual-level effects (protection of the person sleeping under the net, due to blockage of mosquitoes) and community-level effects (protection of everyone in communities where ITN coverage is high, due to reduction in the number of infected mosquitoes, caused either by mosquitoes' being killed by insecticide or by mosquitoes' becoming exhausted when they have trouble finding a host).
- 54
Examples:
- The World Health Organization position statement discussed immediately previously cites this review as its main source: "On the basis of five community-randomized trials, a Cochrane review concluded that, when full cover- age is achieved, ITNs reduce all-cause child mortality by an average 18% (range 14–29%) in sub- Saharan Africa (5). The general implication of this is that 5.5 lives could be saved per year for every 1000 children under 5 years of age protected. It was also concluded that ITNs reduce clinical episodes of malaria caused by Plasmodium falciparum and P. vivax infections by 50% on average (range 39– 62%), as well as reducing the prevalence of high-density parasitaemia." World Health Organization. Insecticide-treated mosquito nets: A WHO position statement (2007) Pg 3.
- The Disease Control Priorities Report also cites this review as its main source for ITN efficacy: "We drew estimates of the effectiveness of ITNS from a recent meta-analysis of WHO/TDR-sponsored trials conducted in Sub-Saharan Africa [Lengeler 2004a]." Jamison et al. 2006, Pg 423.
- 55
- 56
- 57
- 58
- "When you're moving from protecting only children to protecting everybody, you multiply your costs by a factor of five, but you also get at least twice as much effect and we know that from both modeling and empirical impact assessments … I don't think we will ever really have the reply to that question [about the relative magnitude of community-level effects]. Though one thing you can do is mathematical modeling. There are different groups in the world who are doing modeling for the effect of increasing coverage of ITNs, and they will be able to give you some sort of answer … The two people who occur to me are Thomas Smith at the Swiss Tropical Institute and Dave Smith at the University of Florida's Emerging Pathogens Institute." Christian Lengeler, author of Cochrane Review of insecticide-treated bed nets, phone conversation with GiveWell, November 2, 2011
- "There are empirical studies that show that there seems to be a community-level impact of ITNs. There are theoretical studies that show that there ought to be a community-level effect. What I don't think there is is any attempt to estimate the magnitude of the community-level effect from empirical data. We've done this with mathematical models, but haven't completed the linkage with empirical data that could help with this estimate." Thomas Smith, Swiss Tropical Institute Head of the Biostatistics and Computational Sciences Unit, phone conversation with GiveWell, November 8, 2011.
- "The argument for ITNs has always been that ITN coverage is a public good. Some of the good accomplished is not internalized to the person using the net. Some people argue that there's a negative externality as well - unprotected people are getting bitten by the mosquitoes that would have bitten the protected people - but I don't think you can make that argument with ITNs … What I do is analysis of data using mathematical models. In general, the leading models say that the more people use the nets, the bigger the positive externalities are … If you're talking about the marginal dollar for more nets, there's a lot more uncertainty on the cost-effectiveness of that than we'd like. The only data that we have is bad data. Improved surveillance would be helpful." Dave Smith, University of Florida Associate Professor of Zoology, phone conversation with GiveWell, November 4, 2011
- 59
"In late 1996, the villages in Asembo were randomized into ITN (intervention) and control villages … for two years, 1997 and 1998, people in half of the villages (intervention villages) in Asembo had access to properly treated bed nets and half (control villages) did not. Periodic spot checks during this period showed that few (<3%) nets were sold or moved outside the study area, although adherence to net use, measured as the proportion of study participants directly seen to be sleeping under nets during early morning observational surveys, was usually approximately 70% … Although the study area is divided into villages with approximate boundaries as shown in Figure 1A, these are social constructs that do not reflect variation in population density … The 300-meter interval for the main exposure variables was based upon the observation that this distance range divides the number of compounds of each type into approximately equal quartiles (Table 1). All distance calculations were done on the basis of intent to treat; all compounds in ITN villages were assumed to have ITNs and all compounds in control villages were assumed to lack ITNs." Hawley et al. 2003, Pg 121.
- 60
"… Compounds in control villages that are ≥900 meters from the nearest ITN village served as the comparison group for these analyses. A total of seven dichotomous variables were created that contained all other compounds. For control villages, we created three variables for compounds that were 0–299, 300–599, or 600–899 meters from the nearest ITN compound. For ITN villages, we created four variables for compounds 0–299, 300–599, 600–899, and ≥900 meters from the nearest control compound. The intent of this analysis was to allow us to illustrate spatial patterns of effect in a straightforward way; however, the cost of this approach was some loss in statistical power. These distance categories approximate compound distribution by quartiles as shown in Table 1 … The effect of the primary geographic exposure variable, distance to nearest compound of different type, is illustrated in Figure 2, which shows the effect of each of seven different exposure categories on five malaria-related outcomes, as well as geohelminth infection. For geohelminth infection, no effect of ITN use or distance is apparent. In contrast, a protective effect of living in ITN villages (stippled area of Figure 2) is apparent at all distance categories for all-cause mortality of children 1–59 months of age and for high-density parasitemia, anemia, and hemoglobin level … The overall pattern of effects is similar for all five malaria-related outcomes: protective effects are observed within the ITN compounds, with a similar level of protection seen in control compounds located within 300 meters of intervention compounds; these effects are statistically significant for the morbidity measures most sensitive to changes in transmission levels: anemia and hemoglobin level … Results of tests of trend reflect the patterns visible in Figure 2 for clinical malaria (odds ratio [OR] = 0.92, 95% confidence interval [CI] = 0.75, 1.12, P = 0.38), high-density parasitemia (OR = 0.89, 95% CI = 0.78, 1.01, P = 0.08), moderate anemia (OR = 0.78, 95% CI = 0.69, 0.89, P = 0.0001), hemoglobin level regression coefficient (OR = 0.18, 95% CI = 0.06, 0.31, P = 0.0048), and child mortality (hazard ratio = 0.94, 95% CI = 0.90, 0.98, P = 0.002). For all of these malaria-related outcomes, trends are in the direction indicating greater protection in compounds closer to intervention villages, with strongly significant trends seen for mortality, anemia, and hemoglobin level. For geohelminth infection, no trend was observed (OR = 1.09, P = 0.47)."
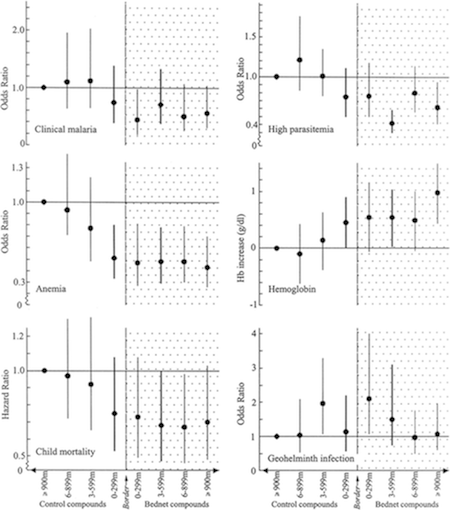
Hawley et al. 2003, Pgs 123-125.
- 61
"This community effect on nearby compounds without nets is approximately as strong as the effect observed within villages with ITNs." Hawley et al. 2003, Pg 121.
- 62
"studies from various parts of Africa and Papua New Guinea indicate the presence of a beneficial community effect (we propose use of this term rather than the less descriptive mass effect) on malaria transmission [references 1-6], severe malaria [reference 7] and mortality [reference 8] in children. One study, in contrast, yielded no evidence for either beneficial or harmful community-wide effects. [reference 9]" Hawley et al. 2003, Pg 121.
We looked up reference 9 and confirmed that it discusses only transmission: "In The Gambia, the use of permethrin-treated bed nets has led to a reduction in morbidity and mortality from malaria in children. However, no clear evidence has been found for a 'mass-killing effect' on the mosquito vectors as a result of this intervention. Two further entomological studies to investigate this phenomenon have been carried out. In one study, 20 villages were paired so that bed nets in one member of each pair were treated with permethrin. In the other, a cross-over design was used in which treated and untreated bed nets were exchanged between 2 villages. Longevity, biting rate and resting density of the malaria vector population and sporozoite rates were assessed in both studies. Malaria vectors were equally abundant and long-lived, and as likely to be infective, in villages with treated bed nets as in those with untreated nets. However, a clear reduction in the density of the indoor-resting population of mosquitoes in rooms with treated bed nets was found, probably reflecting the excito-repellency of the insecticide. This study confirmed that, in The Gambia, the protection against death and morbidity from malaria seen in children using treated bed nets must be due primarily to personal protection rather than to a 'mass-killing effect' on the mosquito vector population at a village level." Quinones et al. 1998, abstract.
- 63
- 64
"An important paper that had some influence in the political debate about mass distribution (as opposed to distribution to infants and pregnant women only) was: Killeen et al. 2007." Thomas Smith, Swiss Tropical Institute Head of the Biostatistics and Computational Sciences Unit, email to GiveWell, November 8 2011.
- 65
Killeen et al. 2007, Pg 1246. The paper includes a spreadsheet with the full specification of its model.
- 66
See Smith et al. 2009, Table 1, Pg 514. Note that the higher the existing level of ITN coverage (column headings), the lower the additional amount of ITN coverage needed (figure in the cell minus figure in the column heading) to reach the specified target. For example, at a PfPR of 50% and a goal of reducing it to 1% (10th row, 4th-6th columns), one would need to go from 0% to 71% effective coverage (71% absolute change), or from 10% to 77% coverage (67% effective change), or from 20% to 81% effective coverage (61% effective change).
- 67
"Holden Karnofsky: Do you know of any papers or scholars arguing the opposite, that community-level effects are negligible and/or that universal coverage has little value-added above and beyond covering pregnant women and children under five?
Thomas Smith: I don't." Thomas Smith, Swiss Tropical Institute Head of the Biostatistics and Computational Sciences Unit, phone conversation with GiveWell, November 8, 2011.
- 68
"This is very consistent with the results based on net sales; they suggest that demand for ITNs is 75 percent lower at the current cost-sharing price in Kenya (50Ksh or $0.75) than it would be under a free distribution scheme." Cohen and Dupas 2007, Pg 11. See also Figure 1, Pg 11.
- 69
Cohen and Dupas 2007, Pg 15, Figure 2.
- 70
"When a school-based NGO deworming program in western Kenya introduced cost sharing, the take-up of deworming medication fell sharply and revenue failed to outpace administrative costs, despite the health and education benefits of the program. User fees did not help target treatment to the sickest children. As deworming pills are delivered directly into children's mouths, there was no gap between take-up and usage, so pricing had no potential psychological impact on use through sunk costs." Kremer and Holla 2009, "Pricing and Access: Lessons from Randomized Evaluations in Education and Heath" in What Works in Development?: Thinking Big and Thinking Small, ed. by Jessica Cohen, William Easterly, Pg 95.
- 71
"Two-stage pricing randomization has also been used to test the two potential routes by which pricing could affect use in a door-to-door marketing campaign for water disinfectant on the outskirts of Lusaka, Zambia. As with deworming and nets, pricing led to a rapid drop-off in take-up, with no evidence of increased targeting to the most vulnerable. Pricing had no statistically significant psychological effect on use. The authors of the study argue that there was some screening effect since those who were more willing to pay for the disinfectant were more likely to have chlorine in their water at later random checks than those who received it for free." Kremer and Holla 2009, "Pricing and Access: Lessons from Randomized Evaluations in Education and Heath" in What Works in Development?: Thinking Big and Thinking Small, ed. by Jessica Cohen, William Easterly, Pg 99.
- 72
"In 1993 a cost-recovery programme was introduced and villages given free insecticide during the first year of the study were asked to pay 5.00 Dalasi (US$0.50) per bednet treated. Unfortunately this led to a dramatic drop in coverage and a return of child mortality rates in these villages to their pre-intervention values." D'Alessandro et al. 1995, Pg 483.
- 73
"In January 2002 the UK Department for International Development (DFID) awarded PSI-Kenya US$33 million over 5 y to socially market partially subsidised ITN within the existing retail sector... A two-tier pricing system of 350 Kenya Shillings (KES) (equivalent to US$4.7) in urban settings versus KES100 (US$1.3) in rural settings was implemented." Noor et al. 2007, Pg 1342.
- 74
Noor et al. 2007, Pg 1344, Table 1.
- 75
"The programme began in October 2004, and during the first 6 mo Supanet ITNs were bundled with separate Powertab net treatment tablets (for every 6 mo) and distributed to MCH attendees. In May 2005 an additional US$37 million was committed by DFID to PSI to procure and distribute Supanet-branded long-lasting insecticidal nets (LLINs), Olyset and Permanet. These public sector nets were heavily subsidized pretreated nets (KES50; US$0.7) and branded with the MoH logo." Noor et al. 2007, Pg 1342.
- 76
"During round four of the GFATM awards in April 2004, Kenya's application was successful and US$17 million was approved to procure and distribute 3.4 million LLINs (Olyset and Permanet brands) free of charge to children under the age of 5 y. This represented, at the time, the largest successful award for free distribution of LLINs in Africa." Noor et al. 2007, Pg 1342.
- 77
Noor et al. 2007, Pg 1344, Table 1.
- 78
GiveWell. Cost-effectiveness analysis of LLIN distribution 2014
- 79Note that this figure is based on people who could be covered by the ITNs distributed, not on people who are confirmed to be using ITNs (i.e., the review discussed above implies that .00553 lives are saved for every child under five who could be covered by a distributed ITN, not that .00553 lives are saved for every child under five who is confirmed to be using an ITN).
- "The summary rate difference, which expresses how many lives can be saved for every 1000 children protected, was 5.53 deaths averted per 1000 children protected per year (95% CI 3.39 to7.67; Analysis 1.2)." Lengeler 2004a, Pg 8. We have confirmed with the author that this figure is based on an "intention to treat" analysis, e.g., "protected" refers to children in the treatment group, not to children who were confirmed to own or use ITNs.
Our use of this figure entails a couple of implicit simplifications:
- We do not model variations in the transmission setting (prevalence and behavior of mosquitoes, presence of cattle, etc.). Note that the review we are using states that its ".00553 lives saved per child protected" figure does not appear sensitive to one measure of transmission dynamics.
- “The summary rate difference, which expresses how many lives can be saved for every 1000 children protected, was 5.53 deaths averted per 1000 children protected per year (95% CI 3.39 to 7.67; Analysis 1.2). I performed a regression analysis of the natural logarithm of the rate difference on the entomological inoculation rate and could not find a trend (r 2 = 0.52, F = 3.2 on 1,3 degrees of freedom, P = 0.2). In contrast to protective efficacies, the risk differences seemed to have a tendency towards a higher effect with a higher entomological inoculation rate. This apparent paradox is because the baseline mortality rates are higher in areas with high entomological inoculation rates." Lengeler 2004a, Pg 8.
- Our use of this figure also implies that each person-year of protection provides an equivalent protective effect - e.g., going from 80% to 81% coverage has the same effect as going from 0% to 1% coverage. The information we have (discussion above) suggests that ITNs are actually more effective at higher levels of coverage (because part of their effect is on community-level transmission of malaria); this in turn implies that distributing ITNs in an area where coverage is already reasonably high should be more cost-effective than distributing ITNs in an area of low prior coverage, as in the small-scale studies. However, we are not confident in this dynamic and do not model it.
- 80
See penultimate section of our 2012 blog post on the subject
- 81
- The deaths averted by ITNs may be the same deaths that could be averted by, for example, vitamin A supplementation (as noted above, many of the deaths averted by ITNs are not specifically attributable to malaria). So perhaps other improvements in general health are independently averting all the deaths that ITNs could avert in their absence; under this model it’s possible that ITNs don’t avert any deaths at all.
- On the flipside, there may be increasing returns to improved general health: perhaps there are children who previously (at the time of the studies) would have been in such poor health that they would have died even with ITNs, but now can have their deaths averted by ITNs.
- 82
We assume that this decay model accounts for a substantial amount of the extent to which LLINs are lost, not delivered, or discarded. We provide a less optimistic estimate where LLINs are assumed to last 1 year on average (note that the evidence on ITN effectiveness is generally limited to a time frame of one year); we provide a more optimistic estimate where LLINs are assumed to last 3 years on average (this could be warranted if Against Malaria Foundation distributions result in fewer lost/undelivered/discarded LLINs).
- 83
Those who believe that effective usage is likely to be lower can model this assumption using the "Wastage" cell in our sheet (which allows one to specify a percentage of ITNs that are lost, misused, or otherwise paid for but unimpactful, beyond the already-implicit assumptions in the model). Our model may not sufficiently adjust for this sort of additional "wastage," if (as discussed above) ITNs are more effective at higher levels of prior coverage.
- 84
This is why, when calculating pre-existing coverage of the population, we take reported usage figures and divide them by 70% (this assumes that coverage is greater than usage such that usage = 70% * coverage).
- 85
We use a single figure (referred to in this paragraph as X) for the "percentage of the effects of ITNs that comes from community-level effects." If coverage of children under 5 is C1, and coverage of the population as a whole is C2, then we model the "effective coverage" of children under 5 as (X*C2+(1-X)*C1). In other words, when 10% of the ITN effect is presumed to be from community-level effects, this means that the "effective coverage" of children under 5 comes from taking a weighted average of the under-5 ownership and the community ownership, with 90% weight on the former and 10% weight on the latter. Using this model, and 50% for X, would have an implication similar to that of the more sophisticated model we discuss above.
- 86
“Global malaria deaths increased from 995 000 (95% uncertainty interval 711 000—1 412 000) in 1980 to a peak of 1 817 000 (1 430 000—2 366 000) in 2004, decreasing to 1 238 000 (929 000—1 685 000) in 2010. In Africa, malaria deaths increased from 493 000 (290 000—747 000) in 1980 to 1 613 000 (1 243 000—2 145 000) in 2004, decreasing by about 30% to 1 133 000 (848 000—1 591 000) in 2010. Outside of Africa, malaria deaths have steadily decreased from 502 000 (322 000—833 000) in 1980 to 104 000 (45 000—191 000) in 2010. We estimated more deaths in individuals aged 5 years or older than has been estimated in previous studies: 435 000 (307 000—658 000) deaths in Africa and 89 000 (33 000—177 000) deaths outside of Africa in 2010.” Murray et al. 2012, Abstract.
- 87
- Update to cost-effectiveness analysis in 2013
- In 2013, we updated our cost-effectiveness analysis to account for (a) concerns about insecticide resistance and (b) changes in our estimate of net costs due to falling global net prices and changes in our estimate of non-net distribution costs. The changes are as follows:
- Our baseline cost-effectiveness scenario assumes a 20% reduction in the effectiveness of bed nets due to insecticide resistance. This assumption is highly uncertain and subjective.
- In other words, we assume that 20% fewer deaths are averted per ITN-protected child under 5. See GiveWell. Cost-effectiveness analysis of LLIN distribution 2014, Sheet Main sheet.
- In our pessimistic scenario about the impact of insecticide resistance, we assume that 80% of the efficacy of LLINs is lost, based on our calculation that untreated nets are roughly 20% as effective as insecticide-treated nets. This calculation compares studies of treated versus untreated nets to studies of treated nets versus no nets and assumes that, in the worst case, insecticide resistance causes treated nets to be equally as effective as untreated nets. For details on how we came up with this assumption, see GiveWell. Cost-effectiveness analysis of LLIN distribution 2014, Sheet Insecticide Resistance.
- The 20% baseline case is an arbitrary reduction of the pessimistic scenario, based on the current lack of evidence that insecticide resistance has affected the efficacy of LLINs.
- The cost of nets has fallen significantly in recent years.
- “Another driver of the reduced gap was a change in the price of nets. Previously, nets cost $7.50 to purchase and deliver and they now cost $5.80. The major driver of this change was the reduced cost of purchasing nets. This may fall further, but Dr. Renshaw does not believe it is likely to fall significantly.” Notes from a conversation with Melanie Renshaw, 10/17/2013.
- A Roll Back Malaria planning tool modeled the breakdown in costs as:
- Cost of net: $3.30
- Shipping: $1.00
- Warehousing: $0.21
- Distribution: $0.40
- Training: $0.30
- Microplanning: $0.14
- Social mobilization: $0.15
- Monitoring and evaluation, includes supervision: $0.30
Roll Back Malaria. Planning tool spreadsheet. Sheet LLINs.
- However, the reduction in net prices was more than offset by an increase in our estimate of non-net distribution costs.
- For 2013, we based our estimate of non-net costs on global average non-net costs (as reported in Roll Back Malaria. Planning tool spreadsheet, Sheet LLINs) instead of AMF-provided non-net costs (which we had used to estimate non-net costs in the past) because the global average non-net costs are a more conservative baseline for cost estimation and we generally expect costs to be underestimated. For details on our estimate of total and marginal net costs, see GiveWell. Net cost estimates 2013, Sheet Main.
- Detail on the global average non-net costs (according to a Roll Back Malaria planning tool):
- Cost of net: $3.30
- Shipping: $1.00
- Warehousing: $0.21
- Distribution: $0.40
- Training: $0.30
- Microplanning: $0.14
- Social mobilization: $0.15
- Monitoring and evaluation, includes supervision: $0.30
This implies average non-net costs of about $2.50 per LLIN.
Roll Back Malaria. Planning tool spreadsheet. Sheet LLINs. - AMF estimates of non-net costs range from about $0.92 per LLIN (see our 2012 AMF review) to about $1.21 per LLIN (see GiveWell. Net cost estimates 2013, Sheet Main).
- Our baseline cost-effectiveness scenario assumes a 20% reduction in the effectiveness of bed nets due to insecticide resistance. This assumption is highly uncertain and subjective.
- The updates to insecticide resistance and net costs reduced our estimated cost-effectiveness of LLIN distribution.
- 88
See our blog posts on the topic:
- 89
See for example Roll Back Malaria Partnership gap analysis (September 2013).
- 90
Roll Back Malaria Partnership gap analysis (September 2013), sum of cells N45:Q45.
- 91
Roll Back Malaria Partnership gap analysis (September 2013), sum of cell N45.
- 92
- “Pre-2010-2011, net gaps were regularly filled. In 2011, the Global Fund (the major worldwide funder of nets) had some problems that significantly reduced the funding it could allocate. This led to significant net gaps in 2011, 2012, and most of 2013 in specific countries that do not have a broad base of partner support.” Notes from a conversation with Marcy Erskine, 9/18/2013.
- “The Global Fund significantly reduced funding for nets in 2011, '12, and '13 because it received less funding than expected due to the global economic crisis and it slowed disbursements of existing funds due to concerns about improper spending. These factors caused the net gap to rise.” Notes from a conversation with Melanie Renshaw, 10/17/2013.
- 93
See the "Is there room for more funding in LLIN distribution" section from the 2012 LLIN intervention report and the accompanying coverage analysis (GiveWell. LLIN gap analysis (2012))
- 94
2013 “Is there room for more funding in LLIN distribution?” section:
- Note: this section has been reformatted as a bulleted list in order to preserve footnotes.
- There is currently a funding gap of approximately 22 million nets for 2013 and 71 million nets for 2014, with the gap increasing in future years.
- “Our best estimate is that we have the following gaps for nets:
- 2013: 22,049,149
- 2014: 71,219,977
- 2015: 118,362,677
- 2016: 163,443,589”
Notes from a conversation with Marcy Erskine, 9/18/2013. Based on Roll Back Malaria Partnership gap analysis (September 2013).
- “This gap analysis assumes that we should provide 1 net for every 1.8 people in areas at risk for malaria. It includes all nets that have been financed, even if they have not yet been distributed.” Notes from a conversation with Melanie Renshaw, 10/17/2013.
- “Our best estimate is that we have the following gaps for nets:
- Because gaps are less accurate for years that are further in the future, we focus our analysis on the net gap through the end of 2014.
- “The net gap is less accurate for years that are further out because gaps close as donors make commitments.” Notes from a conversation with Marcy Erskine, 9/18/2013.
- Dr. Melanie Renshaw, the Co-Chair of the Roll Back Malaria Harmonization Working Group (the group that releases the gap analysis on which our research is based), told us that the Global Fund will likely fill at least 60% of the remaining net gap through the end of 2014, leaving a gap of approximately 37 million bed nets.
- “The Global Fund new funding modality is likely to close at least 60% of this gap.” Notes from a conversation with Melanie Renshaw, 10/17/2013.
- 22 million [2013 gap] + 71 million [2014 gap] = 93 million nets [total 2013-14 gap]
- 93(1-.6) = 37.2 million nets [remaining 2013-14 gap]
- Assuming a cost of $5.80 per net distributed – which includes both the costs of the net and all costs associated with distributing it – there is an overall funding gap of approximately $216 million.
- “Another driver of the reduced gap was a change in the price of nets. Previously, nets cost $7.50 to purchase and deliver and they now cost $5.80. The major driver of this change was the reduced cost of purchasing nets. This may fall further, but Dr. Renshaw does not believe it is likely to fall significantly.” Notes from a conversation with Melanie Renshaw, 10/17/2013.
- 37.2 million nets * $5.80 = $215.76 million net gap
- However, there are several factors that may reduce the net gap:
- countries are able to “front-load” Global Fund funding, which means that they can shift funding commitments for future years to current years in order to close current gaps.
- “An alternative way to fill the gap will be if countries front-load Global Fund funding, shifting 2016 commitments to earlier years if it will enable them to close the net gap, hoping to raise additional funds in future years. Countries have done this in the past.” Notes from a conversation with Melanie Renshaw, 10/17/2013.
- the Global Fund may receive significant additional funding due to renewed donor confidence and a recovering global economy, which may allow them to close more than 60% of the current net gap.
- “Additionally, due to renewed donor confidence in the Global Fund and a recovering global economy, contributions to the Global Fund are increasing. Now that the Global Fund is again allocating significant funds to nets, the net gap should remain smaller than it has been in the recent past.” Notes from a conversation with Melanie Renshaw, 10/17/2013.
- large funders, such as DfID, are able to close net gaps after the gaps are known to exist.
- ”The numbers above also do not include funds from donors, such as DfID, that are able to fill large gaps (e.g., in the millions of nets) in particular countries after the gaps are known to exist.” Notes from a conversation with Marcy Erskine, 9/18/2013.
- “Other partners such as DFID are also expected to fill additional gaps moving forward.” Notes from a conversation with Melanie Renshaw, 10/17/2013.
- small, flexible donors, such as AMF, Nothing But Nets, UMCOR, and the Red Cross, are not included in the gap analysis.
- “The numbers above do not include nets from "flexible" funders (i.e., organizations like the UN Foundation, UMCOR, AMF, and the Red Cross) that can fill small pressing gaps.” Notes from a conversation with Marcy Erskine, 9/18/2013.
- some of the funding gap may exist in countries where funding is not actually the limiting factor to net distribution. E.g., some countries with “funding gaps” may lack the infrastructure to distribute nets.
- countries are able to “front-load” Global Fund funding, which means that they can shift funding commitments for future years to current years in order to close current gaps.
- We are uncertain how much of the funding gap could be reduced due to these factors. However, Dr. Melanie Renshaw is optimistic that the 2013-14 net funding gap will be closed.
- “Dr. Renshaw is optimistic that the gap will be closed.” Notes from a conversation with Melanie Renshaw, 10/17/2013.
- The Roll Back Malaria Harmonization Working Group will publish its next update on the funding gap in April 2014.
- “The Roll Back Malaria Harmonization Working Group (http://www.rollbackmalaria.org/mechanisms/hwg.html) published its latest net gap update in September and expects to publish its next update in April 2014.” Notes from a conversation with Melanie Renshaw, 10/17/2013.
- Why is there a reduced funding gap?
- The Global Fund, the largest international funder of malaria control, significantly reduced its funding for bed nets in 2011, '12, and '13 because (a) it received less funding than expected due to the global economic crisis and (b) it slowed disbursements of existing funds due to concerns about improper spending, among other factors. Reduced funding from the Global Fund caused the net gap to rise in 2011.
- See Figure 3.1, World Health Organization. World Malaria Report (2012), Pg 16.
“The Global Fund significantly reduced funding for nets in 2011, '12, and '13 because it received less funding than expected due to the global economic crisis and it slowed disbursements of existing funds due to concerns about improper spending. These factors caused the net gap to rise.” Notes from a conversation with Melanie Renshaw, 10/17/2013.
- See Figure 3.1, World Health Organization. World Malaria Report (2012), Pg 16.
- Recently, the Global Fund has scaled its funding back up.
- “This year, the Global Fund has provided interim funds, allocating approximately $600 million to fund replacement LLINs; this allocation was responsible for significantly reducing the 2013 and 2014 net gap. Additionally, due to renewed donor confidence in the Global Fund and a recovering global economy, contributions to the Global Fund are increasing.” Notes from a conversation with Melanie Renshaw, 10/17/2013.
- Before the Global Fund crisis, net gaps were regularly filled.
- “Pre-2010-2011, net gaps were regularly filled.” Notes from a conversation with Marcy Erskine, 9/18/2013.
- Additionally, the price of producing and delivering nets has fallen from $7.50 to $5.80. The major driver of this change was the reduced cost of purchasing nets.
- “Another driver of the reduced gap was a change in the price of nets. Previously, nets cost $7.50 to purchase and deliver and they now cost $5.80. The major driver of this change was the reduced cost of purchasing nets. This may fall further, but Dr. Renshaw does not believe it is likely to fall significantly.” Notes from a conversation with Melanie Renshaw, 10/17/2013.
- A Roll Back Malaria planning tool modeled the breakdown in costs as:
- Cost of net: $3.30
- Shipping: $1.00
- Warehousing: $0.21
- Distribution: $0.40
- Training: $0.30
- Microplanning: $0.14
- Social mobilization: $0.15
- Monitoring and evaluation, includes supervision: $0.30
Roll Back Malaria. Planning tool spreadsheet. Sheet LLINs.
- Changes in net production in recent years
- Because of the Global Fund crisis in 2011, many net suppliers were forced to scale down.
- “When Global Fund funding reduced, many producers scaled down their production capacity.” Notes from a conversation with Marcy Erskine, 9/18/2013.
- Because of this, there are currently long delays in net delivery, of about 6 to 12 months in some areas.
- “Thus, even though additional funding for nets is now becoming available, nets will not reach their pre-2011 peak anytime soon because net suppliers will not able to produce nets quickly enough. For context, in the countries in which Dr. Erskine is working, it seems that nets ordered today may take 6 to 12 months to be delivered (production + shipping and arrival in country). This estimate has not been confirmed with net suppliers.” Notes from a conversation with Marcy Erskine, 9/18/2013.
- However, Dr. Melanie Renshaw believes that net suppliers will scale up to their pre-2011 capacity in response to the Global Fund’s increased disbursements and the Global Fund’s new “pooled procurement” system, which will pool all funding for nets and distribute net orders more evenly throughout the year.
- “Dr. Renshaw believes that net suppliers will scale back up to their pre-2011 capacity in response to the Global Fund’s increased disbursements and the Global Fund’s new “pooled procurement” system, which will pool all funding for nets and distribute net orders more evenly throughout the year.” Notes from a conversation with Melanie Renshaw, 10/17/2013.
- Reasons that we may be underestimating the net gap
- A small-sample survey by AMF suggests that a Global Fund “universal” coverage campaign in Malawi may not have achieved universal coverage. AMF’s survey found that, of the estimated nets needed to achieve universal coverage in two districts in Malawi, only 60% were present.
- “Despite the recent Global Fund campaign, AMF believes that there are still large enough gaps in net coverage in Balaka and Dedza to justify its upcoming distributions…In order to spot-check net coverage in these districts, AMF asked Concern Universal to conduct a survey to assess how many nets were present and hung in a sub-set of households covered by that distribution…The survey found that, of the estimated nets needed to achieve universal coverage, only 60% were present…AMF believes that these survey results, though lacking robustness because of the small sample size, support its view that the previous campaign left significant gaps in coverage, and therefore that its upcoming distributions can effectively cover more people, both through encouraging net hang up and increasing net presence in households.” AMF Update, February 2013.
- This study suggests that the international donor community may be overestimating net coverage and underestimating the net gap. However, this was a small-sample study in a particular context; its results may not be representative.
- Bottom line
There is currently a bed net funding gap of approximately $216 million. However, there are several factors that may be leading us to overestimate or underestimate this gap. Dr. Melanie Renshaw, a net gap expert, believes that the bed net funding gap may be closed in the near future.
- 95
- We searched Google Scholar for all recent articles that cite Lengeler 2004a and assessed the relevance of these articles for our review.
- We searched Google Scholar for all recent articles that cite the key randomized controlled trials in Lengeler 2004a and assessed the relevance of these articles for our review.
- We did a general search for recent RCTs and reviews related to bed nets and mortality on Google Scholar. Search terms included “malaria bed nets,” “malaria mortality,” “bed nets mortality,” “malaria randomized controlled,” “bed nets randomized controlled,” etc.
- 96
We updated this section to include analysis from the 2012 World Malaria Report and searched Google Scholar for recent evidence on bed net usage. Recent net usage evidence did not lead to any significant changes in our report, but it raised the question of whether studies that directly observe bed net usage might find significantly less usage than studies that rely on usage surveys. - 97
- For our process on updating the insecticide resistance page, see the process section of the insecticide resistance page.
- The delayed immunity page was assessed as up-to-date in September 2013.
- 98
- We updated our cost-effectiveness analysis to account for (a) concerns about insecticide resistance and (b) changes in our estimate of net costs due to falling global net prices and changes in our estimate of non-net distribution costs.
- We further emphasized the uncertainty involved in doing cost-effectiveness analysis.
- 99
We conducted research on this topic and spoke with two net gap experts (see Notes from a conversation with Marcy Erskine, 9/18/2013 and Notes from a conversation with Melanie Renshaw, 10/17/2013) to bring our estimate of the bed net funding gap up to date.