Published: December 2023
Summary
What do they do? Against Malaria Foundation (AMF) provides funding for insecticide-treated nets (ITNs) (for protection against malaria) in low- and middle-income countries. AMF collaborates with each country’s national malaria program and other partner organizations to distribute ITNs in mass campaigns. AMF covers the costs of purchasing the nets and other partners cover the costs of distributing them to households (More).
We recommend AMF because of its:
- Implementation of a program (mass distribution of ITNs) that we think is very cost-effective (more in our separate report on ITNs).
- Long track record of supporting campaigns in a number of countries. (More)
- Processes for tracking other actors’ malaria spending in the countries where AMF works, giving us more confidence that it is filling genuine funding gaps. (More)
- Transparency – AMF shares significant information about its work with us. (More)
Our main reservations about AMF are:
- We have some uncertainty about data from AMF’s post-distribution monitoring, so we rely on other sources of data and rough guesses for some parts of our cost-effectiveness analysis. (More)
- While we see all our top charities as exceptional relative to the majority of organizations, our qualitative assessment of AMF is less positive than for our other top charities. (More)
- We have found it challenging to obtain and publish data on other funders’ contributions to the campaigns AMF supports. We see this as a concern because we rely on comprehensive data to produce an accurate analysis of the cost of AMF’s programs, and for transparency reasons. (More)
This assessment of AMF is based on the following components:
What do you get for your dollar? We think that AMF is one of the most cost-effective organizations that donors can support. We estimate (as of December 2023) that it costs ~$3,000 to ~$8,000 to avert a death in locations where GiveWell funds campaigns. That’s because ITNs are cheap to purchase and distribute (roughly $4 to $6 per net) and significantly reduce malaria mortality, among other benefits.
We also have a number of uncertainties about the evidence for ITNs in general, including how long the protection from ITNs lasts and the level of insecticide resistance in locations where GiveWell funds ITN distributions. We discuss these in our separate report on ITNs.
What information has AMF shared on its program? We ask organizations that we fund to share monitoring data and other detailed information on their programs. We use the data as inputs in our cost-effectiveness analysis, and its quality and reliability also informs our overall assessment of the program.
AMF has shared detailed information that we use to evaluate its program. We have a number of reservations about this information, which limits how much we are able to learn from it. The information we’ve seen includes:
- Data from post-distribution surveys to determine whether nets have reached households and how long they remain in good condition. Overall, we think that the results from these surveys provide some signal that the campaigns it supports are reaching recipients as intended. We have a number of open questions about it, including:
- Lower correspondence than we’d expect between monitoring data and audits of that data.
- More positive findings about ITN condition over time than we would expect from other high quality net durability literature.
We therefore only use this data in a limited way in our cost-effectiveness analysis of AMF's program (more).
- Data on AMF's spending, primarily on net purchase costs. We have seen only limited information on costs contributed by other funders to AMF-supported campaigns, which make up a substantial portion of the total cost to deliver nets to households (more).
- Data on the number of nets distributed to households. We have not investigated the methodology used to gather this data in detail, but our understanding is that it is not audited. This reduces our confidence in the data and limits our ability to check its accuracy (more).
- Before deciding whether to support campaigns, AMF gathers information on other malaria funders’ spending plans. This information increases our confidence that the programs AMF supports would not have been fully funded by another actor in AMF’s absence. This in turn increases our confidence that AMF’s funding results in a genuine increase in the overall number of nets distributed (more).
What is GiveWell’s qualitative assessment of AMF? We make qualitative assessments of our top charities alongside our cost-effectiveness analyses to inform our grantmaking. While we see all our top charities as exceptional relative to the majority of organizations, our qualitative assessment of AMF is less positive than for our other top charities. Factors informing our assessment include (more):
- While AMF shares detailed information about its work, we have sometimes questioned whether the information we received is fully comprehensive or reliable. In some cases, we have found that information shared by AMF does not reflect the full picture after deeper investigation, and we perceive AMF as hesitant to bring us negative updates about its program. Our impression is also that AMF is less concerned about the issues we have identified in its monitoring than GiveWell.
- Although we have mainly heard positive feedback about AMF, we have occasionally received feedback that AMF can be difficult for national malaria programs to work with. Specifically, we have heard that its policy of funding only ITNs and not the costs to distribute those ITNs (more) and some of its monitoring requirements (more) can cause challenges.
- AMF is a small organization for its budget size. As of December 2023, it had 13 team members and was raising more than $100 million per year. It does not have the types of support staff (particularly in finance and human resources) that many organizations rely on to identify and mitigate risks to the organization. It also employs fewer staff focused on monitoring, evaluation, and research intended to evaluate and improve its program.
1. What do they do?
1.1 In a nutshell
Against Malaria Foundation (AMF) supplies insecticide-treated nets (ITNs)1 for protection against malaria to malaria endemic countries. AMF collaborates with each country’s national malaria program and other partner organizations to distribute these nets in mass distribution campaigns.
Mass distribution of ITNs is one of GiveWell’s top recommended programs. Our assessment is that there is strong evidence that these campaigns reduce child mortality (and may provide other benefits for which there is weaker evidence). We discuss the evidence for mass distribution of ITNs in detail on a separate page.
1.2 Overview of Against Malaria Foundation’s activities
AMF’s role in ITN campaigns includes:
- Working with national malaria programs to identify funding gaps (more)
- Procuring nets (more)
- Monitoring and evaluation (more)
The national malaria program organizes each country’s ITN campaigns and is responsible for the country’s overall malaria control strategy. AMF’s partner organizations (either government health agencies or in-country non-profit organizations) are responsible for carrying out the ITN campaigns (more). AMF does not itself carry out campaigns or employ staff in countries where it funds ITNs. As of December 2023, AMF employs 13 staff members.2
From 2012 to 2021, AMF supported large-scale campaigns in eight countries (The Democratic Republic of the Congo (DRC), Ghana, Guinea, Malawi, Papua New Guinea, Togo, Uganda, and Zambia), for a total of around 85 million ITNs distributed.3 A summary of AMF's campaigns in that period can be found in this spreadsheet. Since 2021, AMF has also supported campaigns in Chad, Nigeria, and South Sudan.4
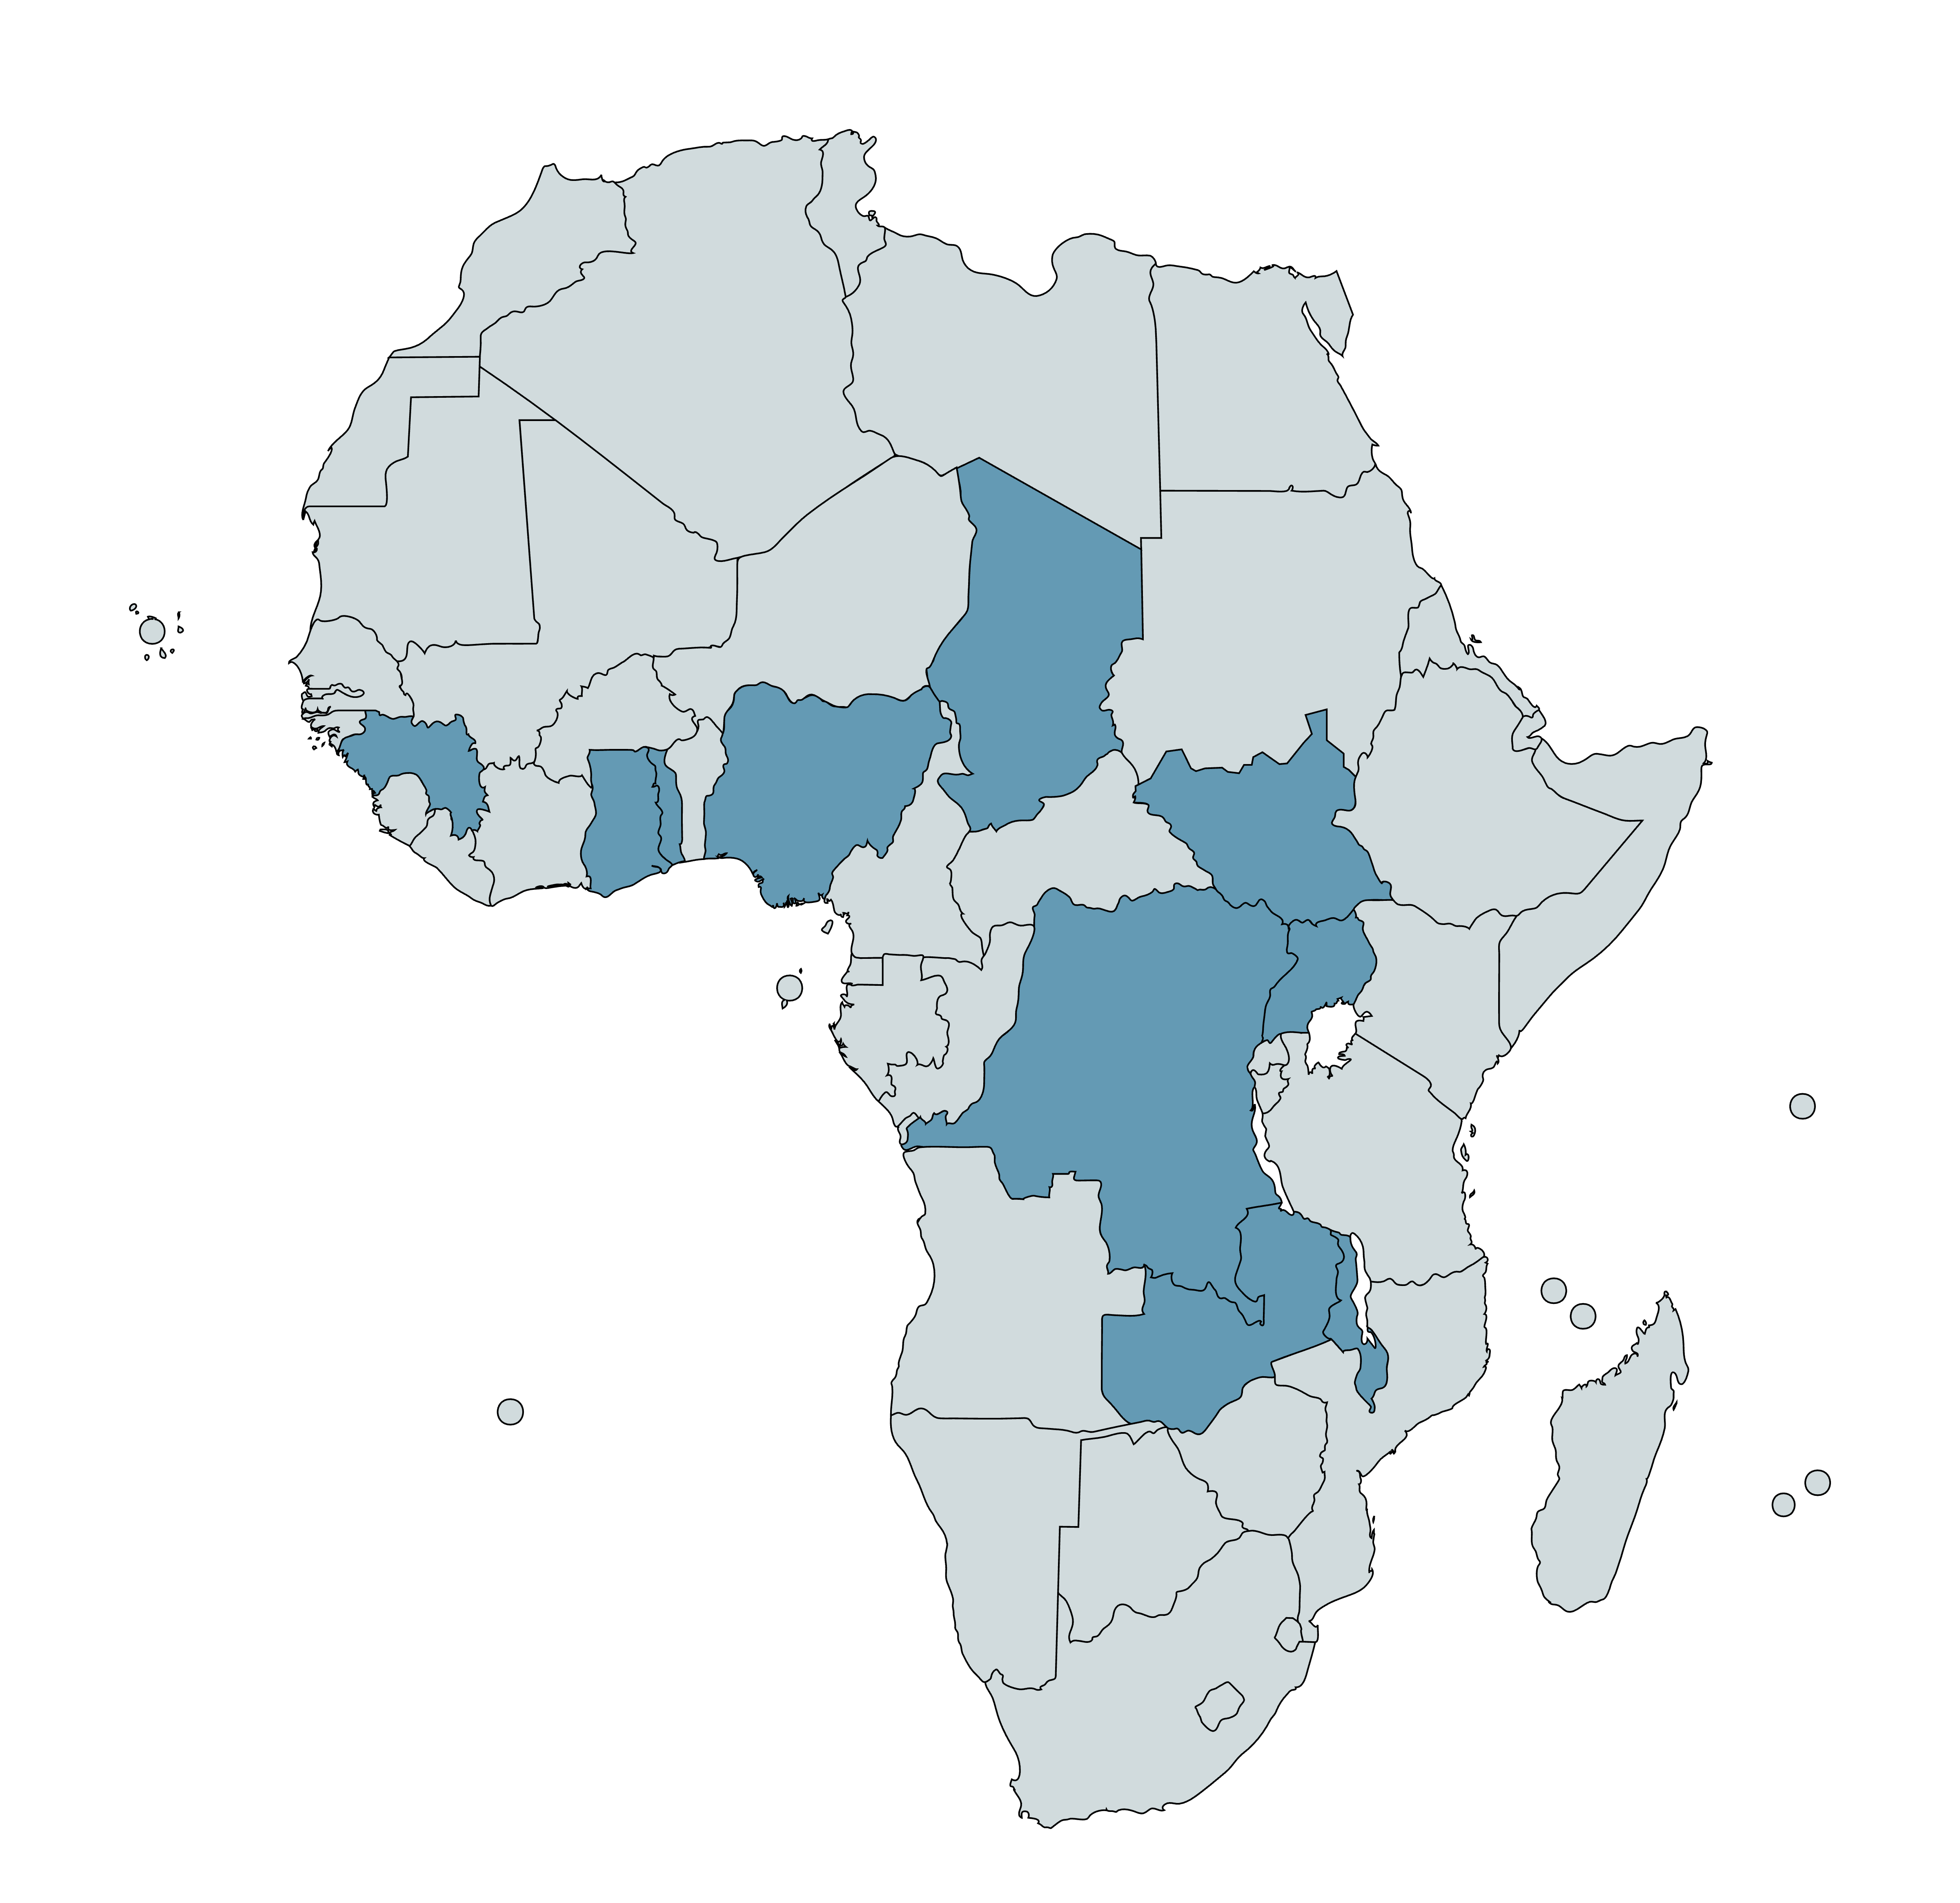
Countries with AMF-supported campaigns (2012-23) are highlighted in blue (Papua New Guinea not shown)5
How do ITN campaigns work?
ITNs are typically distributed through mass campaigns and "continuous distribution" channels.
- Mass campaigns are time limited and involve large-scale distribution of ITNs to households, either door-to-door or through central distribution sites in a community.6 The aim of mass campaigns is to reach as many people as possible in a given location.7 The interval between campaigns recommended by the World Health Organization (WHO) is three years.8 Many malaria endemic countries aim to deliver nets on this three year schedule, and depending on their size they may conduct campaigns nationwide or on a regional level on a rolling basis.9
- Continuous distribution involves ongoing distribution of ITNs during other touchpoints that people may have with the state or healthcare system. Continuous distribution is typically targeted at groups at elevated risk of malaria (e.g., young children and pregnant women), and also helps to fill coverage gaps that emerge after mass campaigns as nets are lost or deteriorate over time.10 Settings where people can access ITNs via continuous distribution include antenatal clinics, immunization clinics and schools.11
As of 2017, the WHO recommends that malaria endemic countries should use a combination of mass campaigns and continuous distribution to achieve high coverage of ITNs.12 AMF focuses on supporting mass campaigns and our analysis below focuses on mass campaigns.
Identifying funding gaps
National malaria programs in malaria endemic countries receive funding for malaria control interventions from external donors. The largest of these donors are The Global Fund to Fight AIDS, Tuberculosis and Malaria (the Global Fund) and the US President’s Malaria Initiative (PMI).13 Depending on the level of funding provided and the national malaria program’s specific malaria control priorities, this may leave funding gaps14 for ITN campaigns that the national malaria program wishes to conduct.15
We have heard of a number of different strategies that national malaria programs employ when there are funding gaps. These can be divided into two main approaches:
- Reducing the number of ITNs distributed in each campaign below the level needed to achieve universal coverage (e.g., by skipping subnational regions with lower malaria rates or regions that are targeted with another malaria intervention, or by reducing the number of ITNs distributed per household).16
- Extending the interval between campaigns (e.g., by conducting rolling campaigns by region so that campaigns happen less often than every three years in each region, or delaying the campaign to continue fundraising).17
We think that the impact of AMF’s funding varies depending on which approach the national malaria program would use without its funding:
- In the first case, we think that the impact of AMF’s funding is to increase the number of people who receive a net in the campaign.
- In the second case, we think that the impact of AMF’s funding is to shorten the interval between campaigns. We have received feedback from AMF that it believes this mischaracterizes the impact of its funding (see footnote for details).18
Each of these scenarios has different implications for our cost-effectiveness analysis (all else equal, we estimate that reducing the interval between campaigns is less cost-effective than increasing the number of people in a campaign who receive a net, although still highly cost-effective in some locations). See this section of our report on ITNs for a discussion of how this impacts our cost-effectiveness analysis.
AMF identifies these funding gaps primarily through discussions with national malaria program partners19 (including inbound funding requests from countries with funding gaps20 or renewing support to countries it supported in prior campaigns)21 and contacts at the Global Fund and PMI.22 AMF says that when selecting locations to support, it prioritizes based on the severity of the geography's malaria burden and the likelihood that the funding need will go unmet without support from AMF.23 The information that AMF collects and analyzes to assess whether funding needs will go unmet without their support is an important input into our cost-effectiveness analysis (discussed in more detail below).
As part of their negotiations, AMF, the relevant national malaria programs and partner organizations agree operational and funding details for each campaign.24 These include:
- Funding arrangements: In the campaigns we have seen,25 AMF has always covered the purchase cost for the nets, while partner organizations (in most cases the Global Fund) usually cover distribution and other "non-net costs."26 AMF also covers the costs of its post-distribution monitoring (discussed below),27 although these are a small portion of total costs.28
- The in-country organization (either a government health agency or a non-profit organization) which will carry out the campaign and the process that will be used to carry out the campaign.
- What information will be collected and shared with AMF, how it will be collected and when it will be shared. AMF requires that all registration and distribution data is collected digitally rather than using paper-based forms.29
We have received occasional feedback that AMF’s policy of paying for ITNs but not funding distribution costs can make it difficult for national malaria programs and partner organizations to work with. This policy can cause coordination challenges and delays because partners must reallocate some funding (usually funding that would have otherwise gone towards purchasing nets) to cover the distribution costs that AMF does not pay for.30 In the campaigns we have seen, the way that this typically happens is:31
- A national malaria program plans to deliver a campaign, using funding from the Global Fund or PMI to purchase and distribute ITNs. There may be a funding gap, meaning the national malaria program cannot purchase and distribute the full number of nets it would ideally wish to (as an example, a $20m gap consisting of $10m required to purchase nets and $10m required to distribute them).
- AMF negotiates with the national malaria program to fill the funding gap by providing funding to purchase nets (in this example, $20m of nets).
- The national malaria program then works with its other funding partner(s) to reallocate funds for the campaign. This involves these partners spending less on nets than originally planned, and more on distribution costs for the nets AMF has purchased. In the example above, this would involve partners other than AMF spending $10m less on nets and $10m more on distribution costs.
Overall, this policy results in a larger number of nets being purchased, but additional time may be needed to coordinate the process and reallocate the funding. AMF notes that it sees benefits from this policy including each partner focusing on its area of specialization and simplifying coordination for in-country partners (e.g., because fewer distribution contracts are needed).32 We have not deeply investigated or tried to corroborate this.
Procuring ITNs
For each campaign, AMF works with the national malaria program to identify which net types to use based on malaria prevalence, insecticide resistance33 and price data.34 It then purchases the nets, while other partners handle the costs of international shipping and logistics.35 We have previously heard from AMF that it can take over a year for nets to be ordered, manufactured, shipped to countries, and transported within countries.36 This means that AMF needs to order nets well in advance of when a campaign is scheduled to occur.
Distribution of ITNs
AMF’s in-country distribution partners37 (either government health agencies or non-profit organizations) typically pay for and manage the distribution of nets for each campaign. The specific processes used for campaigns have varied by country and over time. We provide a brief summary of key stages in the process below.
Registration
During the registration process, national health system staff or volunteers38 travel door-to-door in targeted areas to collect the information used to determine the number of ITNs to allocate to each household (e.g., the number of sleeping spaces and/or the number of household members), as well as the information used to identify the household for the distribution and post-distribution surveys (e.g., the name of the head of the household and GPS data on household location).39
The registration process is typically conducted before the distribution phase.40 The data gathered during registration provides campaign planners with information they can use to more accurately allocate the right number of ITNs to communities and households. However, our understanding is that in some campaigns the registration and distribution phases have taken place simultaneously (particularly campaigns conducted during the COVID-19 pandemic, in order to minimize the number of touchpoints with households). We have not investigated in detail what the implications have been for campaigns which conducted simultaneous registration and distribution.41
As part of the registration process, AMF typically requires that a specified percentage (typically 5%) of registered households are randomly selected to be revisited by a second set of data collectors in the days after registration. AMF reports that the main objective of the backcheck is to improve data quality across the registration data, as workers implementing the registration know their work may be checked.42 This “backcheck” data and the original registration data are compared to assess the accuracy of the original registration data.43 We have previously received feedback that this procedure causes challenges for national malaria programs and other partners, because AMF does not cover the costs of the procedure and national malaria programs may have existing procedures that need to be replaced with a new methodology.44 AMF reports that it is now more explicit about this requirement in initial discussions with each country, and aims to ensure that partners do not have to incur extra costs as a result of the procedure (e.g., because AMF will purchase additional nets to compensate for the costs).45 It also reports that 5 of 8 countries where it works have adopted the procedure nationwide (including in areas where AMF does not fund nets).46 We have not independently investigated or tried to corroborate this.
Distribution
Distribution partners manage the logistics of in-country shipping and storage of ITNs prior to the distribution. To distribute ITNs to recipients, AMF's distribution partners have used a mixture of distribution procedures. In some cases, recipients collect nets from a specified distribution point in or near their community. In others, distributors travel door-to-door to hand out ITNs to households. In some door-to-door campaigns, distributors may assist households with hanging up nets (a "hang-up" procedure). Distribution partners may conduct awareness raising activities or meet with local leaders to prepare communities for the campaign.
Monitoring and evaluation
AMF funds in-country monitoring partners to monitor its campaigns. The main monitoring information we have seen is from AMF’s post-distribution monitoring (PDM)47 , which tracks whether ITNs are in good physical condition, retained in households and used as intended in the months and years after the campaign.
PDMs are conducted by independent survey partners funded by AMF.48 PDMs survey a sample of households in the areas targeted by a campaign to assess the presence, usage, and condition of ITNs over time. Typically, PDMs survey 1.5% of registered households and occur at 9 months, 18 months and 27 months after the campaign.
See the section below for further details on the information we have reviewed from AMF’s monitoring.
Research on net effectiveness
In addition to its core activities, AMF has also funded research into the effectiveness of different kinds of ITN. As part of its support for the 2017 campaign in Uganda, it funded a randomized controlled trial of PBO (piperonyl butoxide) ITNs. PBO is added to ITNs to mitigate the impact of insecticide resistance.49 The study was the second large scale trial of PBO nets50 and found that, in an area of Uganda with high insecticide resistance, PBOs outperformed standard pyrethroid LLINs (long-lasting insecticidal nets) for 25 months after distribution.51 More details on the research are available in this blog post. As of 2019, the WHO conditionally recommends that PBO nets should be distributed instead of standard LLINs in areas where mosquitoes exhibit certain kinds of insecticide resistance.52 This study was continued during the Uganda 2020 and 2023 mass campaigns, with each campaign testing the efficacy of a newly developed net to combat insecticide resistance.53
1.3 How does Against Malaria Foundation use its funding?
A large majority of AMF’s total funding is dedicated to ITN purchases, with small proportions going towards "non-net costs" (e.g., costs related to distributing nets or conducting post-distribution monitoring), insecticide resistance research costs, and operational costs. In the past, AMF also paid for electronic data entry for some paper-based distributions.54
See the table below for a breakdown from July 2011 to June 2022.55 We include spending since FY 2012 (July 2011 to June 2012) because this is when AMF shifted to its current model of larger-scale campaigns.
| Category | July 2011 to June 2022 spending | Percentage of total spending, FY 2012 to 2022 |
|---|---|---|
| Net purchases | $347 million | 95% |
| Costs of distributing nets and monitoring ("non-net costs") | $12 million | 3% |
| Insecticide resistance research | $3 million | 1% |
| Salaries and other organizational costs | $4 million56 | 1% |
| Total spending | $366 million57 | - |
2. Monitoring and information sharing
2.1 Overview
GiveWell asks organizations that we fund to share detailed information on their programs. The aim of reviewing this information is to assess how much the program costs, whether the program is being conducted to a high quality, and whether it is reaching recipients as intended. We use data from these reviews as inputs in our cost-effectiveness analyses, and the quality and reliability of the information we’ve seen also informs our qualitative assessment of the program.
AMF and its partners collect a large volume of information about the campaigns it supports, and AMF is transparent about sharing this data. This includes:
- Data on the number of households registered to receive nets and the number of nets distributed to them (more).
- Post-distribution monitoring to assess net usage, ownership and physical condition over time (more).
- Information on costs incurred to deliver the campaigns it supports (more).
- Information on other funders’ malaria spending (more).
This information allows us to better understand AMF’s work, but we have a number of reservations about its quality and completeness, including:
- Concerns about some aspects of AMF’s post-distribution monitoring (more). These include:
- Low rates of correspondence between the main data and audited data.
- More positive findings about ITN retention over time than we would expect from other high quality net durability literature. AMF reports that more recent surveys do not follow this trend, although we have not yet analyzed the data to assess this claim.
- Concerns about the quality of the registration data used to allocate nets to households, again because of low rates of correspondence between the original registration data and audited data (more).
- Limited visibility into the data on the number of nets distributed to households in each campaign, which is not subject to data audits (more).
- Very limited data on costs contributed by other funders to AMF-supported campaigns. This is a concern because we use estimates of other funders’ spending as part of our analysis of the cost per net (more).
AMF’s post-distribution monitoring also samples only from households who have been registered to receive nets in the campaign, not the population as a whole. While we think this is appropriate for AMF’s main intended use of the data (understanding what happens to AMF-distributed nets over time),58 it means the data is less informative for understanding what proportion of the overall population are reached with nets, as some households may be missed by the registration process.
Ultimately, the information AMF has shared with GiveWell informs either our cost-effectiveness analysis, our qualitative assessment of AMF, or both. We divide our analysis below into information AMF has shared which directly feeds into our cost-effectiveness analysis (more), and information AMF has shared which we use in other ways (more).
2.2 Information informing our cost-effectiveness analysis
Cost information
For each of our top recommended programs, GiveWell conducts a "cost per output" analysis. This analysis aims to estimate the total cost to deliver one unit of the intervention (in this case, one net distributed to a household). Each analysis is designed to be comprehensive and include commodity purchases, distribution, organizational and other costs required to deliver the program.
We calculate the cost per ITN distributed in each country based on the following estimates:
- Estimates of the costs that AMF expects to pay to purchase each ITN in the future (at the time we made our most recent grant). We adjust these to account for an estimate of the proportion of nets which are purchased but not delivered, based on previous campaigns. Averaging across countries and net types, this accounts for 52% of total costs.59
- Estimates of the "non-net" costs (e.g., distribution costs) per ITN. This is based on estimates of costs that AMF and other funders incurred in previous campaigns (rather than projections of future spending). These account for 44% of total costs on average.60
- This is an uncertain part of our analysis, because we have very limited information on other funders’ non-net costs for AMF-supported campaigns. We rely on country-specific information on costs incurred by the Global Fund, but the information we have only covers a small number of previous campaigns (including some but not all the countries in our analysis). This means we’re unsure how reliable or generalizable it is.
- A rough estimate of the value of in-kind government contributions (e.g., staff time) to the ITN campaigns that AMF supports. These account for 5% of total costs on average.61
As of December 2023, we estimate that it costs between approximately $4 and $6 (varying by location) to distribute each ITN.62
Unlike most of our analysis, our estimates of cost per ITN are unpublished. This is because we have not received permission to publish country-specific cost estimates we received from the Global Fund or AMF’s projections for the costs it expects to pay to procure each net by country and net type,63 which our calculations rely on. AMF notes that, while they would like to allow the publishing of net costs, in keeping with their approach to transparency, doing so has the risk of compromising sensitive net price negotiations with manufacturers.64
We discuss our method for calculating these estimates in detail in our separate report on mass distribution of ITNs (here).
Distribution data
AMF’s partners (either national health agencies or in-country non-profit organizations) gather data at the distribution stage of each campaign on the number of nets distributed to households.65 AMF has shared this data with GiveWell for previous campaigns, and we use this data as one input into our estimates of AMF’s cost per net (discussed above). Specifically, we use data on the proportion of nets that were purchased but not distributed in previous campaigns (e.g., because they are lost, stolen, damaged, or otherwise not accounted for) to estimate the proportion of nets that will be purchased but not distributed in the future. As of December 2023, we estimate that this proportion is 5% overall (varying somewhat by country, from 2% in Uganda to 10% in Guinea).66
Our main uncertainty about this data is that we have very little visibility into how it was collected. We have not investigated in detail the methodology used to collect the data or possible sources of bias to the same extent as for AMF’s post-distribution monitoring. Our understanding is also that the distribution data is not audited (whereas the data collected on registration and in post-distribution monitoring is). This reduces our confidence in the data and limits our ability to check its accuracy.
Information on other malaria funding
When negotiating with national malaria programs and other malaria funders, AMF has a process for tracking how each national malaria program plans to spend its budget and what proportion of that budget goes towards campaigns. It uses this information to assess whether in its view there is a genuine gap for net campaigns, whether national malaria programs and other funders are taking AMF’s previous support for the program into account in their funding decisions, and whether other partners are likely to fund the campaign in AMF’s absence.67
This information is among the most comprehensive we have seen from any grantee on other actors’ spending. We find this information valuable because we aim to account for other actors’ spending behavior in our cost-effectiveness analysis. Specifically, we adjust our cost-effectiveness estimates to account for the likelihood that our grantees’ funding is causing other actors (governments and NGOs) to spend more or less on a program than they otherwise would.68
The way AMF’s process typically works is:
- The Global Fund, the largest global funder of malaria programs,69 determines its funding allocations to national governments on a three-year cycle.70
- For each funding gap it considers, AMF asks national malaria programs and other funders to fill out a spreadsheet with information about how the current Global Fund malaria allocation71 is being used, how that compares to the previous Global Fund malaria allocation, and what other funding sources are supporting the malaria budget.72 See GiveWell’s summary here for an example of this information for the 2018-20 and 2021-23 Global Fund allocations73 for Togo, Guinea, Chad and Uganda.
- This information allows AMF and GiveWell to monitor patterns in how the country’s malaria budget is being used, including patterns which give us clues about the likelihood that a funding gap would be filled in any case without AMF support. This is one input we use to generate the adjustments for other actors’ spending in our cost-effectiveness analysis.74
2.3 Information that we use in other ways
Some of the information AMF has shared with GiveWell does not feed directly into our cost-effectiveness analysis but does still inform our view of AMF as an organization. We use this information either indirectly to feed into our cost-effectiveness analysis (more), or as part of our qualitative assessment of AMF (more).
Registration
The ITN registration process, during which national health system staff or volunteers travel door-to-door to determine the number of nets required for each household, is summarized above.
AMF publishes data from the registration process75 and has shared more detailed registration information for some campaigns with GiveWell. We have not reviewed this data as carefully or comprehensively as we have reviewed data from AMF’s post-distribution monitoring (see below), and we have more limited information on the methodology used to collect this data.
AMF also requires that the campaigns it supports conduct a "backcheck" after the registration process, where a small percentage (typically 5%) of households randomly selected to be re-registered by different data collectors to validate the initial registration data.76 In principle, we see the backcheck procedure as a positive, both because it may encourage more accurate data collection (if staff conducting the registration think their work may be audited) and because it provides a check on the accuracy of the data. However, as discussed in an earlier section of the review, we have previously received feedback that this procedure can cause problems for AMF’s partners.77
We have also previously seen AMF analysis indicating low levels of correspondence78 (exact correspondence in the 65% to 95% range, varying by country)79 between the registration and backcheck data in previous AMF-supported campaigns. These rates are lower than we would have expected, given the seeming objectivity of the data collected (the number of residents per household and number of sleeping spaces) and reduce our confidence in the accuracy of the registration data.80 In 2021, we also compared the registration and backcheck data for AMF-supported campaigns in Uganda and Togo in 2020 to inform a grant decision for future campaigns in both countries. We found similar levels of correspondence to AMF’s previous analysis.81 See this section of our grant page for further details.
Monitoring and evaluation
AMF funds in-country monitoring partners to monitor its campaigns. The main monitoring information we have seen is from AMF’s post-distribution monitoring (PDM),82 which tracks whether ITNs are in good physical condition, retained in households, and used as intended in the months and years after the campaign, as well as the proportion of people in the household protected by nets. We use this data to understand what proportion of distributed ITNs reach their intended recipients, are used by those recipients, and remain effective while they are in use.
Overview of post-distribution monitoring
AMF's PDMs are conducted by independent partners funded by AMF. These partners survey a sample of households in the areas targeted by a campaign to assess the presence, usage, and condition of ITNs over time. Typically, PDMs survey 1.5% of registered households and occur at 9 months, 18 months and 27 months after the campaign.
Our analysis focuses on three outcomes we can evaluate based on the data collected in PDMs:83
- Self-reported net usage: What proportion of household members report sleeping under any net found hanging by data collectors (AMF-distributed or not) the previous night?84
- Inferred usage (from net presence): As part of the PDM, data collectors assess what proportion of AMF-distributed nets are found hanging in households.85 We then use this figure to calculate an "inferred" usage rate (see below).
- Net condition: What physical condition are the households nets in (as classified by the data collector)?86
As of December 2023, we have reviewed results from 19 of the 22 large-scale campaigns that occurred from 2017-2021.87 As such, we are reasonably confident that we have seen a thorough picture of the impact of AMF's work in those years. We have not yet reviewed results from campaigns that AMF supported more recently, which means that the results presented below may not capture any differences in the outcomes achieved by those recent campaigns. See this spreadsheet for the results and methods of PDMs since 2017.
The table below summarizes the results from the PDMs we have reviewed. A more detailed summary of the PDMs is available below for both methodology (more below) and detailed results (more below).
| Survey period | ||||
|---|---|---|---|---|
| Outcome | 6-11 months | 12-17 months | 18-23 months | 24-30 months |
| Self-reported net usage (% of people sleeping under nets found hanging) | 83% avg88 | 70% avg | 69% avg | 60% avg |
| Inferred usage (Based on % AMF-distributed nets found hanging) | 68% avg | 63% avg | 62% avg | 56% avg |
| Net condition (% nets in at least "viable" condition) | 89% avg | 82% avg | 80% avg | 65% avg |
Methodology
AMF's PDMs survey households in the areas targeted by a campaign to assess the presence, usage, and condition of ITNs in those households. Typically, PDMs survey 1.5% of registered households and occur at 9 months, 18 months and 27 months after the campaign. We have focused on understanding the methodology used in the PDMs of AMF's recent campaigns in DRC (Équateur province, 2019), Guinea (2019), Ghana (2018), Malawi (2018), Togo (2017), Uganda (2017), and Zambia (2017). Full details of those PDMs are in the "Methods" sheets of this spreadsheet.
Although they are included in the results above, we have not reviewed the methodology used for more recent campaigns in DRC (2020 and 2021), Togo (2020), and Uganda (2020).89 The discussion that follows therefore does not apply to those campaigns, though AMF has informed us that the methodology used for those more recent campaigns has been largely similar.90 We have also not reviewed the methodology of surveys taking place since 2021.
Below, we summarize AMF's general PDM methodology and discuss methodological strengths and weaknesses. Overall, we believe that AMF's PDMs are designed to measure the key indicators of the success of a campaign, and the fact that respondents are selected randomly and ITNs can be directly observed increases the credibility of the results.
However, our confidence in the accuracy of these results is reduced by the fact that AMF only surveys households that were registered to receive nets during the relevant campaign (more on the registration process above), moderate to high sample attrition in several cases, the potential for respondent bias on self-reported measures, only moderate correspondence in results found by AMF's auditing procedure, and more positive findings about ITN durability over time than we would expect from other high quality net durability literature.91
- Respondent selection: AMF selects households to be surveyed during PDMs from the household-level data collected during registration. Because AMF only samples households that were registered to receive nets, its surveys do not capture households that might have been missed by the registration process. This means that the surveys do not provide information about what proportion of the target population was not registered at all (and therefore missed by the campaign).
AMF randomly selects villages and households from all regions or districts that were covered by the campaign of AMF-funded nets. AMF also randomly selects "spare" households that can be visited if households on the original list are unavailable.92
AMF's inclusion of all regions or districts and its random sampling of villages and households increase the likelihood that the sample of households it selects is representative of the population that received nets. However, AMF's sampling procedure results in households from smaller villages being overrepresented in the sample because, in almost all cases, AMF selects the same number of households per village.93 Because AMF has data from registration on the total number of households per village, it is possible to correct for this overrepresentation. AMF has shared results from some PDMs that are weighted by village size. Weighted results show slightly higher (1-5% across PDMs) proportions of nets found present and hanging in households compared with unweighted results.94 This suggests that AMF's sampling procedure results in a slight downward bias in results, at least for this outcome.Another concern is that sample attrition (i.e., households randomly selected to be interviewed not being interviewed) may bias results upward, as households that cannot be interviewed during PDMs may also have been less likely to be reached by the campaign; see footnote for AMF's response to this concern.95 In PDMs in Malawi and Zambia, around 60% to 65% of households selected to be interviewed were interviewed, and in the Équateur province of DRC, 67% were interviewed; we believe these figures suggest a high risk of bias in results from those countries.96 In Guinea, Togo, and Uganda, these figures are ~75% to ~85% of households selected to be interviewed, which we believe suggest a moderate risk of bias.97
We also note that because sampling is among households that were registered to receive nets, the survey is not designed to check what proportion of the total population was missed by the campaign, as many other surveys aim to.
- Survey design: AMF contracts with other organizations to implement PDMs ("PDM implementers"). AMF provides PDM implementers with a standard questionnaire,98
which AMF may adapt for each context. Data collectors are instructed to directly assess net presence, hang-up, and condition by observing nets in respondents' homes. They also ask respondents to report the number of ITNs received by the household during the campaign, to report nets that are taken down during the day but hung at night, and to answer additional questions about net usage during the previous night.
We believe that some of the responses collected through this survey are at relatively low risk of bias. The presence and condition of ITNs (both those found hanging and reported as taken down during the day but hung at night) are objective measures that data collectors can directly assess.99 However, self-reported responses are at greater risk of bias. Responses about ITN hang-up and usage during the previous night may be at risk of social desirability bias that leads respondents to overreport usage, though validation of these responses is possible through comparison with objective measures.100 Responses about the number of ITNs received by the household report on an event that occurred at least 9 months prior and thus may be at risk of recall bias. AMF has shared results from some PDMs that replace self-reported responses with data on the number of nets that households were registered to receive. Results using registered ITNs show slightly lower (2% to 8% across PDMs) proportions of distributed ITNs found present and hanging in households compared with results using self-reported ITNs.101 The direction of these differences is consistent with our expectation that more ITNs are registered than are actually received by households, as net need at times outstrips the number of nets procured, leading to rationing in the distribution.102 The magnitude of this difference suggests that recall bias is not a major concern.
- Survey implementation: The PDM implementer recruits data collectors and supervisors to conduct and oversee data collection. With one exception,103
PDM implementer organizations were not involved in the campaign, which suggests that they are unlikely to have a personal interest in survey outcomes. In multiple cases, however, data collectors and/or supervisors hired by the PDM implementer to conduct the survey were involved in the campaign, though in the PDMs they are typically assigned to survey different areas than those in which they supported the campaign.104
These individuals may have a personal interest in survey outcomes reflecting favorably on the campaign, such that results are biased upward; we have not seen evidence that this incentive influenced data collection and note it only as a possibility.
AMF selects 5% of surveyed households to be re-surveyed within one to seven days by a different data collector or supervisor who is blinded to the original results. Because data collectors are aware that their work will be audited, this procedure may encourage accurate data collection. It also provides a check on the accuracy of results. The first step in analyzing this data is to pair re-survey records with records from the original data collection using household identification numbers. Overall, AMF has paired around 85% of re-survey records with original records across all PDMs.105 AMF told us that records may not be paired for several reasons — most notably, because households that were unavailable for the original data collection may still be re-surveyed if their availability changes; this is consistent with high attrition in surveys (discussed above).106
The next step in analyzing this data is to check for correspondence between re-survey records and original records along several data points. We are particularly interested in correspondence levels for the number of ITNs that are present and hanging, which includes both ITNs found hanging by data collectors and ITNs that households report as being taken down during the day but hung at night. Across PDMs, exact correspondence on this number has ranged from 44% to 85%. Correspondence within +/- 1 (meaning re-survey records find either the exact same number of nets hanging, one more, or one fewer) has ranged from 78% to 92%.107 AMF notes that more recent PDMs (conducted in 2022 and 2023) show higher levels of correspondence, although we have not yet analyzed data from more recent surveys to assess this claim or understand what could be driving this difference.108
These correspondence rates are lower than we would have expected, given the seeming objectivity of this measure; they suggest that different data collectors may be assessing this measure differently, that households may be reporting differently on different days, or that these figures reflect a true change in net presence in a matter of days. Regardless of the explanation, these correspondence rates decrease our confidence in the accuracy of the original results. AMF notes that it considers these results acceptable according to its criteria.109
Detailed results
We define net usage as the proportion of people living in households that were targeted by an AMF campaign who subsequently sleep under a net, thereby benefiting from the protective effect against malaria.110 To understand the usage achieved by AMF's campaigns, we use two types of PDM data: self-reported data from respondents about their usage of all ITNs found hanging in households, and data about the presence of AMF-distributed ITNs in households, from which we can infer usage.
During household interviews, PDM data collectors ask respondents to report their net usage during the previous night by specifying how many people slept under each ITN found hanging in the household, including AMF-distributed ITNs and ITNs from other sources.111
This data provides a "reported" usage rate, defined as the proportion of people sleeping in the household the previous night who slept under any hanging net. See reported usage rates for different countries and time points in this spreadsheet, sheet "Results: Summary." In short:
- Reported usage is generally high 6-11 months post-distribution (i.e., as measured by that campaign’s first PDM), varying from 72% (Malawi 2018) to 94% (DRC Kongo Central 2020).
- Reported usage decreases over time. Across PDMs, average reported usage is 83% between 6-11 months post-distribution and 60% between 24-30 months post-distribution. This matches our expectation that ownership of usable ITNs decreases over time from the point of distribution, as nets wear out.
- PDMs conducted after Zambia's 2017 campaign found relatively low usage compared to other PDMs.112
During household interviews, PDM data collectors also ask respondents how many ITNs their household received from the relevant AMF campaign (by visually inspecting the net label),113 then classify each reported AMF net as either present and hanging (which includes both nets found hanging by data collectors and nets that households report as being taken down during the day but hung at night), present and not hanging, missing, or worn out.114 We use this data, and an estimate that on average each net covers 1.8 people,115 to calculate an "inferred" usage rate representing the usage provided by AMF-distributed nets found hanging. This measure captures a different outcome (usage from all nets versus usage from AMF-distributed nets). See inferred usage rates for different countries and time points in this spreadsheet, sheet "Results: Summary." In short:
- Inferred usage 6-11 months post-distribution (i.e., as measured by that campaign’s first PDM) varies from 57% (DRC Haut Lomami 2020) to 83% (Uganda 2017).
- Like reported usage, inferred usage decreases over time, from an average of 68% between 6-11 months post-distribution to an average of 56% between 24-30 months post-distribution.
- In almost all cases, reported usage from all ITNs is higher than inferred usage from AMF-distributed ITNs, suggesting that households use ITNs from other sources in addition to AMF-distributed ITNs and/or that more people sleep under nets than 1.8 on average.116 The difference between reported usage and inferred usage remains fairly consistent across PDMs for the same campaigns.
These two measures are subject to different potential sources of bias. On the one hand, reported usage is a more direct measure that explicitly asks households how they use ITNs, but it may be subject to social desirability bias that leads respondents to overreport usage.117 On the other hand, inferred usage is an indirect measure that relies on our assumptions about how households use ITNs, but it uses data that is at somewhat lower risk of bias. We see these data as providing cumulative evidence that, in general, a reasonably high proportion of targeted recipients sleep under ITNs over time.
Our expectation that ITN usage confers a protective effect against malaria requires that ITNs remain effective over time. To understand the effectiveness of AMF-distributed ITNs over time, we review ITN condition data from AMF's PDMs. AMF reports on whether each net found in a household is either in "very good," "good," "viable," or "worn out" condition.118 See the proportion of hanging nets in at least "viable" condition for different countries and time points in this spreadsheet, sheet "Results: Summary." In short:
- Across countries, PDMs conducted between 6-11 months found an average of 89% of nets in at least "viable" condition. Uganda (2017) had the highest rate of viability at 99%, and DRC (Tanganyika province, 2020) had the lowest at 62% for the 6-11 month range.
- For the campaigns that occurred between 2017 and 2021, we have seen results from eight PDMs conducted at 24-30 months post-distribution, which found lower rates of hanging nets in at least "viable" condition (an average of 65%).
- Across time, the average proportion of nets in at least "viable" condition decreases from 89% at 6-11 months to 82% at 12-17 months, 80% at 18-23 months, and 65% at 24-30 months. This matches our expectation that ITN condition decreases over time from the point of distribution.
These results imply more positive findings about ITN durability over time than we would expect from other high quality net durability literature. For comparison with independent studies measuring net durability over time, see the results summarized in this spreadsheet, “PermaNet 2.0 Field Study Data Inputs” sheet.
The measure where we see a major discrepancy is net retention. AMF’s PDMs report consistently high levels of net retention over time (over 90% up to 24 months post-distribution). This compares to an average of around 70% nets retained after 24 months in the independent studies we have assessed. Some (though not all) of the independent studies track net retention by enrolling and tagging study nets at baseline, and then follow up on the same cohort of nets over time. Our best guess is that this is a more accurate methodology than the method used in AMF’s PDMs, which rely on self-reports on the number of nets retained over time.
To reflect our higher level of confidence, we use the data on net durability from independent studies in our cost-effectiveness analysis to estimate the durability of ITNs distributed by AMF over time rather than the data from AMF’s PDMs (more in this section).
AMF reports that more recent surveys it has conducted (in 2022 and 2023) show significantly lower levels of retention than previous PDMs.119 We have not yet analyzed data from more recent surveys to assess this claim or understand what could be driving this difference.
How AMF’s monitoring feeds into our cost-effectiveness analysis
Overall, we believe that these results provide some signal that AMF-supported campaigns are reaching recipients as intended. However, our confidence in the accuracy of these results is reduced by the fact that AMF only surveys households that were registered to receive nets during the relevant campaign, moderate to high sample attrition in several cases, the potential for respondent bias on self-reported measures, only moderate correspondence in results found by AMF's auditing procedure, and more positive findings about ITN durability over time than we would expect from other high quality net durability literature. This means we have significant uncertainty about the precision of the data. AMF notes that it is engaging with GiveWell to discuss possible changes to its monitoring approach to address some of these concerns.120
We therefore only use our analysis of AMF’s PDMs in a limited way in our cost-effectiveness analysis. Specifically, we roughly adjust our cost-effectiveness estimate for AMF’s ITN program downwards to account for our level of confidence in AMF’s monitoring and evaluation.121
Instead, to assess the usage and condition of AMF’s ITNs over time, our cost-effectiveness analysis relies on estimates based on other sources of data or rough guesses:
- Net condition: ITN campaigns typically take place at three-year intervals, but ITNs degrade over time and on average provide less than three years of full protection over the distribution cycle. As of December 2023, we estimate that ITNs in AMF campaigns in most countries confer two years of effective coverage during each distribution cycle relative to the nets evaluated in previous studies.122
This estimate is based on independent studies that tracked, in real life conditions, the retention, physical survival (i.e., number and size of holes), and insecticide effectiveness at killing mosquitoes of two of the main brands of ITNs that AMF has purchased in the past.123
- One exception where we do use AMF data from PDMs is our adjustment for lower net durability (-17% as of December 2023) in DRC. This adjustment is based in part on evidence from an AMF PDM survey in one province in DRC in 2019.124
- Net usage: We roughly estimate that average usage rates for ITNs in AMF campaigns are 63% across all countries.125 This estimate is based on usage data from three studies in a meta-analysis of insecticide-treated nets, which found average usage rates of around 70%. We then adjust this estimate downwards because we expect that usage rates in contemporary campaigns would be lower than usage rates in randomized controlled trials (which included activities to encourage usage and guidance on how to hang nets properly).126
- Adjustment for pre-existing nets: Some people may receive ITNs in AMF campaigns when they already have a non-worn-out net available from previous campaigns. We account for this with an adjustment for pre-existing nets. As of December 2023, we estimate that this reduces the effectiveness of AMF’s ITN campaigns by 3% to 7% (varying by location).127
3. Qualitative assessment
In theory, our recommendations are maximizing for one thing: total improvement in well-being per dollar spent. This is what our cost-effectiveness estimates intend to capture.
In practice, there are costs and benefits that we do not observe and are not estimated in our models. We make qualitative assessments to account for these unmodeled costs and benefits. We then use these assessments alongside our cost-effectiveness estimates to inform our funding recommendations.
As one tool for thinking through and communicating about impressions we have that aren't captured in our cost-effectiveness estimates, we assess each top charity on eight dimensions on a four-point scale (“Stands out,” “Relatively strong,” “Average,” “Relatively weak”). We believe our top charities are exceptional relative to the majority of organizations and so these assessments are intended to capture differences among GiveWell top charities, rather than absolute rankings among all charitable organizations. Our latest assessment of AMF (for 2023) is in the table below.
| Dimension | What does this capture? | Assessment of AMF |
|---|---|---|
| Responses to our questions | When we ask the organization a question, do its answers generally either indicate that it has thought through the question before or show us why getting an answer is not important to understanding its work? | Average |
| Prioritization discussions | Do the organization’s explanations about how it allocates funding among different locations and program participants seem to be aimed at maximizing its impact per dollar? | Average |
| Self-improvement and attitude toward mistakes | Does the organization proactively share information with us and publicly about mistakes it has made? | Average |
| Role in field | Is the organization producing research aimed at informing policymakers or other implementers? Does it participate in global conversations about its field of work? | Average |
| Responsiveness | Does the organization send us information by mutually agreed-upon deadlines? Is it responsive to our emails? | Relatively weak |
| Giving us feedback | Does the organization catch our mistakes and let us know, thus improving our research? Does the organization make useful suggestions for how we could improve our research process and cost-effectiveness models? | Average |
| Quality of information shared | Have the documents that the organization has shared with us contained significant errors? Has the organization told us things that were inaccurate? Has the information provided been easy to interpret and use? Have the organization’s projections of when it would achieve its goals generally been accurate? | Average |
| Incorporating feedback from participants and last mile providers | How does the program collect feedback from program participants and from program implementers, i.e., those directly delivering the program? How does the program incorporate feedback to improve service delivery? | Not yet assessed128 |
Some of the main factors informing our assessment are:
Responses to our questions (average)
- AMF has generally engaged with and shared detailed responses to our questions. However, in some cases we have had concerns about the reliability of these responses.
- For example, our grants rely on best guesses of what would happen in a scenario without GiveWell-directed funding, which we refer to as "the counterfactual." One input into our view of the counterfactual to a given grant is what AMF tells us it believes the most likely counterfactual to be (which we aim to corroborate by having conversations with other program stakeholders and by reviewing the track record of previous campaigns in a given country). There have been cases in which we felt, after more investigation, that the situation was different or more nuanced than AMF had communicated to us. We see this as a concern because it directly impacts our analysis of the cost-effectiveness of AMF’s program (more here in our separate report on ITNs).
Self-improvement and attitude toward mistakes (average)
- We strongly value working with organizations that proactively bring negative updates (i.e., concerns or problems about the programs they support that might affect our view of those programs) to our attention. We perceive AMF as being somewhat hesitant to do so. Part of what informs this impression is we have perceived AMF to be less concerned than we are about issues we've identified in the data it collects (e.g., the lack of correspondence discussed above between original and revisit data in post-distribution monitoring).
- We perceive AMF as being less invested in improving its monitoring & evaluation or pursuing other routes to fill data gaps (e.g., conducting a costing study to gather information about other funders' contributions).
Role in field (average)
- We have heard from one partner organization that AMF played an important role in building production capacity for PBO nets.129 Our understanding of this feedback is that AMF was an early adopter of PBO nets relative to other ITN funders, and the scale of their PBO purchases encouraged manufacturers to start or scale up production.
Responsiveness (relatively weak)
- AMF has been more likely to submit information after the agreed upon date than our other top charities. In one case in 2022,130 we made a grant to AMF on the condition that it would provide us with certain information before signing an agreement with a national malaria program and it did not do so.
Quality of information shared (average)
- AMF generates a large volume of data about its campaigns and is transparent about sharing that data. This includes real-time access to AMF systems containing net purchase data, registration and distribution data and data from AMF’s post-distribution monitoring. However, we have sometimes found it difficult to interpret this data (e.g., because it lacked clear documentation) and have not always been confident in the quality of the data (see the section above for further details).
- As we discuss above, AMF has established processes for tracking other funders’ contributions to the campaigns it supports. It uses this information to determine whether it thinks that there is a genuine funding gap before it commits funding to ITN campaigns. On at least one occasion AMF has declined to fund a campaign because it was concerned that the impact of supporting the campaign would be to free up funding for another intervention (e.g., indoor residual spraying) rather than increasing the volume of ITNs delivered.131 Although we have not always agreed with AMF’s conclusions about the implications of this information, we find this process and the information AMF shares from it valuable. This is because our cost-effectiveness analysis aims to account for how AMF’s funding for a program might impact other actors’ spending. For more information about how we estimate these adjustments, see this section of our report on ITNs.
Giving us feedback (average)
- AMF has engaged with and given feedback on the cost-effectiveness models we use to evaluate its programs. However, our impression is that this feedback much more often seems to be aimed at increasing than decreasing estimated cost-effectiveness, which leads us to put less weight on it. For example, AMF has consistently disagreed with the downward adjustments we use to account for the impact on other actors’ spending (more here in our separate report on ITNs) and for the impact of its spending reducing the interval between campaigns rather than expanding coverage in a given campaign (more here). We haven't been able to reach agreement on the inputs we use for these adjustments in some locations.
Other factors
- In many conversations with national malaria programs and AMF's other partners, we have explicitly asked for feedback about AMF as a partner and have broadly heard positive feedback. We have, however, occasionally received feedback that AMF can be difficult for national malaria programs to work with, relative to other ITN funders. We have heard two main points of constructive feedback. Firstly, that AMF’s policy of funding only ITNs and not the costs to distribute those ITNs can cause delays and coordination problems (more), and secondly that its requirement to "backcheck" 5% of households registered to receive ITNs can make it difficult to work with, because it does not cover the costs of this procedure (more).132
- AMF is a small organization for its budget size. As of December 2023, it had 13 team members133 and was raising over $100 million per year.134 It does not have the types of support staff (particularly in finance and human resources) that many organizations rely on to identify and mitigate risks to the organization. It also employs fewer staff focused on monitoring, evaluation, and research intended to evaluate and improve its program. This organizational size and structure is notably different from GiveWell's other top charities.
4. What do you get for your dollar?
GiveWell recommends programs that we believe are cost-effective in the sense of saving or improving lives as much as possible for as little money as possible. We summarize the full reasoning behind our cost-effectiveness analysis for AMF in our separate report. In summary, as of December 2023, we think:
- It costs between $3,000 and $8,000 to save a life in countries where GiveWell currently supports AMF to deliver ITN campaigns.135
This equates to being 9x to 23x as cost-effective as direct cash transfers (GiveWell’s benchmark for comparing different programs). This is because:
- Malaria is a major driver of child deaths in countries where we fund free distribution of ITNs.
- ITNs provide strong protection against malaria and deaths caused by malaria.
- In addition to preventing childhood malaria deaths, we think ITNs provide additional benefits through protecting individuals above the age of five from malaria mortality and lead to long-term increases in income later in life.
- ITNs are relatively inexpensive to provide (approximately $4 to $6 each).136
See our report on ITNs for more details.
5. Previous AMF grants
6. Sources
- 1
- Long-lasting insecticidal nets (LLINs) are a subcategory of insecticide-treated net (ITN) that retain effective biological activity for at least 20 standard washes under laboratory conditions.
- “Long-lasting insecticidal net: A factory-treated mosquito net made of material into which insecticide is incorporated or bound around the fibres. The net must retain its effective biological activity for at least 20 WHO standard washes under laboratory conditions and 3 years of recommended use under field conditions.” WHO, Malaria Terminology 2021 Update, p. 17.
- Many of the ITNs that AMF supplies are LLINs. However, in recent years AMF has begun to purchase a larger number of ITNs containing additives designed to tackle insecticide resistance (piperonyl butoxide or chlorfenapyr - see our separate report on ITNs for further details). Our understanding is that these nets are not yet categorized as LLINs by the WHO because they have not demonstrated the durability required to be categorized as LLINs.
- Many of GiveWell’s research materials on this topic use the term “LLIN” rather than “ITN”.
- Long-lasting insecticidal nets (LLINs) are a subcategory of insecticide-treated net (ITN) that retain effective biological activity for at least 20 standard washes under laboratory conditions.
- 2
- 3
We include distributions since 2012 because this is when AMF shifted to its current model of larger-scale distributions.
- 4
Chad, Nigeria, and South Sudan are not included in the distributions spreadsheet. More information is available for the Nigeria and South Sudan distributions on each distribution’s GiveWell grant page (South Sudan, Nigeria (2022) and Nigeria (2023)). GiveWell did not fund AMF’s support for the Chad campaign, but further information is available at AMF, "Distributions," "Chad, 2023".
- 5
Created using MapChart.
- 6
WHO, World malaria report 2022, p. xxi.
- 7
“To achieve and maintain universal ITN coverage, countries should apply a combination of mass free net distribution through campaigns and continuous distribution through multiple channels, in particular through antenatal care (ANC) clinics and the Expanded Programme on Immunization (EPI). Mass campaigns are the only proven cost-effective way to rapidly achieve high and equitable coverage.” WHO, Guidelines for Malaria Vector Control, 2019, p. 39.
- 8
Our understanding is that this recommendation is based on evidence that ITN efficacy declines three years after distribution, suggesting that they should be replaced after that interval. Our review of the evidence has similarly led us to conclude that ITNs provide strong protection from malaria for roughly two years on average. See this section of our report on ITNs.
- 9
The countries we are aware of that have used a rolling approach in the past are DRC, Nigeria, and South Sudan. See our summary for DRC and Nigeria on this page, and for South Sudan on this page.
- 10
"Mass campaigns are the only proven cost-effective way to rapidly achieve high and equitable coverage. Complementary continuous distribution channels are also required because coverage gaps can start to appear almost immediately post-campaign due to net deterioration, loss of nets, and population growth…
…Continuous distribution through ANC and EPI channels should remain functional before, during and after mass distribution campaigns. School based distribution should be discontinued in campaign years to avoid over-supply of ITNs. In areas where school-based distributions are operating at scale and achieve high coverage, these distributions may even be sufficient to replace mass distribution campaigns.” WHO, Guidelines for Malaria Vector Control, 2019, pp. 39-40. - 11
“To achieve and maintain universal ITN coverage, countries should apply a combination of mass free net distribution through campaigns and continuous distribution through multiple channels, in particular through antenatal care (ANC) clinics and the Expanded Programme on Immunization (EPI). Mass campaigns are the only proven cost-effective way to rapidly achieve high and equitable coverage. Complementary continuous distribution channels are also required because coverage gaps can start to appear almost immediately post-campaign due to net deterioration, loss of nets, and population growth…
…Continuous distribution through ANC and EPI channels should remain functional before, during and after mass distribution campaigns. School based distribution should be discontinued in campaign years to avoid over-supply of ITNs. In areas where school-based distributions are operating at scale and achieve high coverage, these distributions may even be sufficient to replace mass distribution campaigns.” WHO, Guidelines for Malaria Vector Control, 2019, pp. 39-40. - 12
“To achieve and maintain universal LLIN coverage, countries should apply a combination of mass free net distribution through campaigns and continuous distribution through multiple channels, in particular through antenatal care (ANC) clinics and the expanded programme on immunization (EPI). Mass campaigns are the only proven cost-effective way to rapidly achieve high and equitable coverage. Complementary continuous distribution channels are also required because coverage gaps can start to appear almost immediately post-campaign due to net deterioration, loss of nets, and population growth.” WHO, Achieving and maintaining universal coverage with long-lasting insecticidal nets for malaria control, 2017, p. 1.
- 13
See WHO, World malaria report 2022, Annex 4 - C. Funding for malaria control for a summary of the level of support provided by different donors for malaria control in malaria endemic countries between 2019 and 2021.
- 14
In this context, we use the term “funding gap” to describe any funding shortfall for a malaria program that we don’t expect to be filled by other actors.
- 15
Funding gaps vary over time and by country. A detailed discussion of specific funding gaps we have previously filled is available in GiveWell’s published grant pages for previous grants to AMF. See the "Funding landscape" section of each grant page.
- 16
For example, this page summarizes a grant GiveWell made to AMF in 2021 for ITN campaigns in Nigeria, Uganda and Togo. The Togo and Uganda national malaria programs usually conduct nationwide campaigns every three years, but have historically not had enough funding to cover the entire population in each campaign. We believe that the impact of our funding to AMF was to increase the number of people who would be covered in these campaigns.
- 17
For example, see this spreadsheet for details of campaigns in 11 Nigerian states receiving support from the President’s Malaria Initiative (PMI). Columns L, Q and V show the intervals between campaigns taking place in the 2012-2020 period. In only one case (Kebbi state in 2018) was the campaign interval within the recommended 36 month period.
- 18
Note: AMF disputes that this is the impact of its funding in the longer term. AMF believes that when taking a longer term (over several funding cycles) and nationwide view of the situation, the second approach equates to the first; i.e., AMF funding increases the number of people who receive nets. AMF, comment on a draft of this review, November 13th, 2023.
- 19
Historically, when selecting locations for distributions, AMF consulted various sources, including the Alliance for Malaria Prevention's (AMP's) list of countries with significant net gaps, other malaria control funders, in-country technical advisors, the relevant national malaria control program (NMCP), implementing organizations, and the African Leaders Malaria Alliance. GiveWell's non-verbatim summary of a conversation with Rob Mather and Peter Sherratt, September 9, 2015.
- 20
"As it becomes involved in larger distributions, AMF is receiving a growing number of funding requests. As its funding increases, AMF aims to make more strategic investments by engaging in the planning cycles of countries where it has strong connections and experience." GiveWell's non-verbatim summary of a conversation with Rob Mather and Peter Sherratt, February 28, 2016
- 21
For example, AMF supported distributions in Papua New Guinea in each year from 2017-2020 and in both Togo and Uganda in 2017 and 2020. See this spreadsheet, "Detailed overview" sheet. As of February 2023, it is also planning to support distributions in Togo and Uganda in 2023. See AMF, "Distributions" (accessed February 23rd 2023).
- 22
This understanding is based on many conversations with AMF.
- 23
Rob Mather, AMF CEO, comment on a draft of a previous version of this review, November 2022.
- 24
This understanding is based on many conversations with AMF, and from following AMF's progress over time.
- 25
This summary is based on our analysis of AMF’s cost per net (see below), based on cost data we have received from AMF. Our 2018 cost per net analysis is available here. We updated this analysis in 2019, 2020, 2022 and 2023 but did not publish updated versions of the spreadsheet with the data we used and our calculations because we have not received permission to publish country-specific cost estimates we received from the Global Fund, which our calculations rely on.
Examples of AMF’s agreements with national ministries of health for previous distributions:
- "The non-net costs will be funded by the Ghana Malaria Global Fund Grant. These costs include those for shipping to Ghana, clearance, in-country transport, pre-distribution, distribution." AMF, Ghana distribution agreement, 2016 (unpublished).
- "The non-net costs will be funded by the Uganda Ministry of Health which may use funding from its Roll Back Malaria Partners. These costs include those for shipping to Uganda, clearance, in-country transport, pre-distribution, and distribution." AMF, Uganda distribution agreement, 2016, p. 2.
- "Post-Distribution Check-Ups… AMF will fund an NGO to run the process." AMF, Uganda distribution agreement, 2016, p. 5.
- AMF, Togo distribution agreement (redacted), 2017:
- "1) AMF will fund 2,413,250 LLINs.
2) The non-net costs will be funded by the MSPS which may use funding from The Global Fund or other sources." p. 7. - "Post-Distribution Check-Ups (PDCUs) will take place across all of the districts to monitor net use and condition. The results will be owned by Togo and shared with AMF. AMF will fund an NGO to run the process in full consultation with the MSPS. The MSPS will facilitate the check-ups." p. 10.
- "1) AMF will fund 2,413,250 LLINs.
- AMF, Papua New Guinea distribution agreement (redacted), 2017:
- "1) AMF will fund 1,159,400 extra-large LLINs for distribution in 2017.
2) The costs, with the exception of the purchase of the LLINs, will be borne by RCPM which may use dedicated funding from The Global Fund and other sources." p. 1. - "Post-Distribution Check-Ups (PDCUs) to assess correct net distribution, net use and condition of LLINs will take place across all of the districts to monitor net use and condition. The results will be owned by PNG but will be shared with AMF. AMF will fund a yet-to-be-decided NGO to run the process in full consultation with the NDoH and RCPM. RCPM will facilitate the check-ups." p. 4.
- "1) AMF will fund 1,159,400 extra-large LLINs for distribution in 2017.
- 26
"There was an exception to this between 2013 and 2015 in Malawi where AMF funded the $1.1 million costs of the distribution of 1.4 million nets in order not to miss a window of opportunity to distribute nets given no other funder could be found for the no-net costs and the rainy season was arriving that would make a net distribution difficult." Rob Mather, AMF CEO, comment on a draft of a previous version of this review, October 31, 2019.
- 27
AMF reports that it has covered monitoring costs in all cases since December 2015. AMF, comment on a draft of this review, November 14, 2023.
- 28
For a breakdown of AMF’s spending on previous campaigns, see this spreadsheet.
- 29
AMF, comment on a draft of this review, November 14, 2023.
- 30
See a more detailed discussion on this page.
- 31
This understanding is based on multiple conversations with AMF, national malaria programs and other funders over time.
- 32
AMF, comment on a draft of this review, November 14, 2023.
- 33
For a discussion of how far insecticide resistance affects ITN effectiveness, see our report on mass distribution of ITNs.
- 34
Rob Mather, AMF CEO, comment on a draft of a previous version of this review, October 31, 2019.
- 35
AMF, comment on a draft of this review, November 14, 2023.
- 36
See this blog post for more details on the time it takes for AMF-procured nets to go from purchase to distribution.
- 37
For a list of distribution partners for each distribution AMF has supported, see AMF, "Distributions" ("By whom" column). Accessed February 23rd, 2023.
- 38
Our understanding is that these staff and volunteers may also be involved in other types of public health campaigns, not just distribution of ITNs. Depending on the country, they may either be salaried community health workers or volunteers in receipt of stipends.
AMF told us that registration was previously carried out by AMF's distribution partners, but is now increasingly carried out by national health system staff. AMF's distribution partners continue to carry out monitoring of the registration process.
Rob Mather, AMF CEO, comment on a draft of a previous version of this review, November 12, 2018. - 39
AMF reports that this may also include other information that varies from country to country; e.g., national ID card number and telephone number. AMF, comment on a draft of this review, November 14, 2023.
- 40
For dates and further campaign-specific information, see AMF, "Distributions" ("Pre-distribution" section for each campaign).
- 41
AMF reports that, since the peak transmission of COVID-19 has decreased, each country has decided whether or not to continue with a combined process. This has resulted in approximately half of AMF’s programs continuing with registration and distribution combined. AMF, comment on a draft of this review, November 14, 2023.
- 42
AMF, comment on a draft of this review, November 14, 2023.
- 43
See our discussion of correspondence between the registration and backcheck data below.
AMF previously notified us of at least one country (Malawi) where this process was not being conducted consistently. See GiveWell’s supplementary information page on AMF for further information. - 44
For further discussion of this concern, see this section of the grant page for a grant GiveWell made to AMF to support campaigns in Nigeria in 2022, and Togo and Uganda in 2023.
- 45
“For example if the requirements cost an additional $200,000 to implement, and a net is budgeted at $2, then AMF would fund an additional 100,000 nets if filling the gap fully.” AMF, comment on a draft of this review, November 14, 2023.
- 46
AMF, comment on a draft of this review, November 14, 2023.
- 47
Our understanding is that AMF also asks partners to conduct process monitoring, whereby an independent partner monitors campaign planning and field activities to ensure they comply with processes required by AMF. AMF, comment on a draft of a previous version of this review, October 2020.
However, we have not seen details of the process or findings from this monitoring, and we do not know how consistently this type of monitoring is happening and what information AMF has learned from it. We therefore do not focus on process monitoring in the rest of this review.
- 48
AMF, comment on a draft of a previous version of this review, October 2020.
- 49
For a detailed discussion of insecticide resistance and how it affects ITN effectiveness, see this section in our ITN report.
- 50
A 2021 meta-analysis of PBOs noted: “Recently, two separate cluster‐randomized trials (cRCTs) in Tanzania and Uganda demonstrated that use of pyrethroid‐PBO nets can reduce parasite prevalence in children (Protopopoff 2018; Staedke 2020).” Gleave et al. 2021, p. 10.
Our understanding is that the Uganda RCT refers to the AMF-funded study. Staedke 2020 refers to an earlier published paper from the same study which investigated the impact of PBO nets vs conventional ITNs after 18 months. See Staedke et al. 2020. - 51
“Background
Long-lasting insecticidal nets (LLINs) are the foundation of malaria control but resistance of mosquito vectors to pyrethroids threatens their effectiveness. We embedded a cluster-randomised trial into Uganda's 2017–18 campaign to distribute LLINs. LLINs with piperonyl butoxide (PBO) reduced parasite prevalence more effectively than conventional LLINs (without PBO) for 18 months. Here, we report the final 25-month survey results.
Methods
LLINEUP was a cluster-randomised trial conducted in 48 districts in eastern and western Uganda. 104 health subdistricts (clusters) without ongoing or planned indoor residual spraying with pirimiphos-methyl (Actellic, Basel, Switzerland) were eligible for inclusion in the trial. Clusters were randomly assigned to PBO LLINs (PermaNet 3.0 or Olyset Plus) and conventional LLINs (PermaNet 2.0 or Olyset Net) with proportionate randomisation using STATA version 14.2. LLINs were delivered from March 25, 2017, to March 18, 2018. Between April 23, 2019, and Sept 13, 2019, community surveys were conducted in 50 randomly selected households per cluster; ten households per cluster were randomly selected for entomology surveys. Mosquitoes were collected in the morning from indoor surfaces of households using Prokopack aspirators. Due to COVID-19 restrictions, only 90 of the 104 clusters were surveyed at 25 months. The primary outcome was parasite prevalence by microscopy in children aged 2–10 years, assessed in the as-treated population, determined using the results from the 6-month household survey on the type of LLINs received in each cluster. This trial is registered with ISRCTN, ISRCTN17516395, and is now completed.
Findings
In the as-treated analysis, two clusters were excluded (no predominant LLIN received) and four were reassigned; 40 PBO LLIN clusters (30 PermaNet 3.0, ten Olyset Plus) and 48 non-PBO LLIN (36 PermaNet 2.0, 12 Olyset Net) were included. Parasite prevalence was 17·1% (506 of 2958 participants) in the PBO group and 19·8% (701 of 3534) in the non-PBO group (prevalence ratio adjusted for baseline 0·80 [95% CI 0·69–0·93], p=0·0048). Comparing within-treatment group parasite prevalence to baseline, parasite prevalence ratios were lower in the PBO groups at all timepoints, but the difference was greatest at 6 months (PBO LLINs parasite prevalence at baseline 28·8% [1001 of 3472, 95% CI 27·3–30·4] vs at 6 months 12·0% [361 of 3009, 10·9–13·2], prevalence ratio [PR] 0·43 [95% CI 0·36–0·52], p<0·0001; non-PBO LLINs parasite prevalence at baseline 25·4% [1015 of 4004, 24·0–26·7] vs 6 months 14·8% [526 of 3551, 13·7–16·0], PR 0·60 [0·54–0·68], p<0·0001) and 25 months (PBO LLINs parasite prevalence at 25 months 17·1% [506 of 2958, 15·8–18·5], PR 0·63 [95% CI 0·57–0·71], p<0·0001; non-PBO LLINs parasite prevalence at 25 months 19·8% [701 of 3534, 18·5–21·2], PR 0·79 [0·73–0·86], p<0·0001).
Interpretation
In Uganda, PBO LLINs outperformed pyrethroid-only LLINs for 25 months. WHO concluded that PBO LLINs are more effective against malaria than non-PBO LLINs when resistance to pyrethroids is high and issued a conditional recommendation suggesting PBO LLINs should be deployed in areas of pyrethroid resistance.” Maiteki-Sebuguzi et al. 2022, Abstract.
- 52
“Pyrethroid-PBO nets prequalified by WHO are conditionally recommended for deployment instead of pyrethroid-only LLINs where the principal malaria vector(s) exhibit pyrethroid resistance that is: a) confirmed, b) of intermediate level,12 and c) conferred (at least in part) by a monooxygenase-based resistance mechanism, as determined by standard procedures…” WHO, Guidelines for Malaria Vector Control, 2019, p. 37.
- 53
AMF, comment on a draft of this review, November 14, 2023. Note that we haven’t yet reviewed the protocol or findings from the updated studies.
- 54
AMF, comment on a draft of a previous version of this review, October 2020.
- 55
For calculations, see this spreadsheet, "Overall" column.
- 56
This includes the foreign exchange adjustment: $3,902,636 + $162,618 = $4,065,254. See here in the spreadsheet.
- 57
Note that the figures in this table are different to the estimates of AMF’s spending on ITN distributions in this spreadsheet. Our understanding is that the main reason for this is that this table includes costs that AMF commits to in a given financial year, even if the costs are not incurred until a subsequent year.
AMF notes that “The figures for net costs on the Financial Information page of the public site are taken from our global accounts for each financial year. As such these figures include accruals of net purchases that AMF has committed to via legal agreements but has not necessarily ordered and purchased and "expensed;" i.e., the cash has not gone from our account. These accruals will be included as costs in that financial year, the year the legal commitment is made to fund nets for a country, as accounting policies require us to do, but may be actually expensed in the following financial year, or even the year after that depending on timing.
Due to the timing that accruals are made, they are usually based on the best estimate for net costs at the time of the accrual and these typically change before actual payments are made after net selection and net price negotiations are finalized. In some distributions the number of nets may also be amended for example if information is provided closer to the distribution.
These changes are accounted for in subsequent financial years and so any given year will have a portion of actual spend, adjustments for previous accruals and future payments. In financial year 2022 there were a significant number of new agreements signed and so the net costs in the accounts are much higher than the actual spend that year due to accruals.” AMF, email to GiveWell, December 4, 2023 (unpublished).
Other factors that GiveWell thinks contribute to the differences between each summary:- The spending breakdown includes spending up to the end of the 2022 financial year (June 30, 2022).
- The spending breakdown includes some spending which did not go towards net purchases or non-net costs (e.g., AMF’s organizational costs).
- 58
This understanding is based on a comment from AMF on a draft of this review, November 14, 2023.
- 59
GiveWell, analysis of AMF’s cost per net, March 2023 (unpublished).
- 60
GiveWell, analysis of AMF’s cost per net, March 2023 (unpublished).
Note that this includes AMF’s research and organizational costs.
- 61
GiveWell, analysis of AMF’s cost per net, March 2023 (unpublished).
- 62
See this row in our cost-effectiveness analysis.
- 63
AMF, comment on a draft of this review, December 12th, 2023.
- 64
AMF, comment on a draft of this review, December 12th, 2023.
- 65
See AMF, "Distributions" ("Distribution" section for each distribution).
- 66
AMF notes that these data reflect the proportion of nets not distributed in the intended campaign, but most nets are retained for future (e.g., through “continuous distribution” of nets in health clinics) and so will eventually be used. AMF’s data indicates that less than 1% of purchased nets (0.5% as of December 2023) do not reach recipients as intended once this is taken into account. AMF, comment on a draft of this review, November 14, 2023 and email to GiveWell, December 19, 2023.
We haven’t investigated this in detail, and we don’t have a strong understanding of how AMF’s process for redistributing nets that weren’t distributed in the campaign works or how effective it is at reaching people with nets.
- 67
This understanding is based on many conversations with AMF over time.
- 68
If we think our grantees’ funding causes other actors to spend more on a program than they otherwise would we refer to this as "leveraging" (or “crowding in”) funding, and if we think our grantees cause other actors to spend less on a program than they otherwise would we refer to this as "funging", from “fungibility” (we also refer to this as “crowding out” funding).
As part of our adjustments, we estimate our best guess at the probability that other actors would fund the program if our grantee (in this case, AMF) did not. For example, if we use an adjustment of 25%, we believe that 25 cents of every dollar spent by the grantee would otherwise have come from other sources. Typically, the higher this probability, the larger the downward adjustment we make to a program's cost-effectiveness.
We also aim to account for our grantee causing other actors to spend more on a program than they otherwise would. We refer to this as “leveraging” funding. We don’t focus on this on this page because we think that AMF only leverages a very limited amount of funding from other actors (in-kind contributions from governments that might have been spent on another program in AMF’s absence, like staff time and office space).
We discuss our approach to these calculations in detail in our separate report on ITNs.
- 69
See WHO, World malaria report 2022, Annex 4 - C. Funding for malaria control for a summary of the level of support provided by different donors for malaria control in malaria endemic countries between 2019 and 2021.
- 70
“Our funding cycle runs in three-year periods that directly correspond with our donor Replenishment periods. The current funding period runs from 2020 through 2022.
In each funding period, the Global Fund allocates donor funds to eligible countries. Countries then apply for their funding after engaging in an inclusive consultation at the country level. After technical review and approval, countries implement their grants. Evaluation and oversight continues throughout implementation to monitor progress and performance.” Global Fund, "Funding Model"
Note: there is a discrepancy between the replenishment fundraising period dates and implementation dates. The fundraising cycles are always one year earlier than the implementation cycles (e.g., fundraising dates of '17-'19 correspond to implementation dates of '18-'20). For more information, see this page.
- 71
The malaria funding allocation is only one component of the Global Fund’s total allocation for countries, alongside grants for HIV and tuberculosis.
“The Global Fund allocates funding to countries to support HIV, TB and malaria programs and to build resilient and sustainable systems for health. These allocations are made every three years at the beginning of a new allocation period.
The total amount available for allocations to countries depends on the funding raised during the corresponding three-year Replenishment cycle.
Allocations to individual countries are calculated using a formula that is predominantly based on each country’s disease burden and economic capacity. They are refined to account for important contextual factors through a transparent and accountable qualitative adjustment process.” Global Fund, "Allocation funding"
- 72
This understanding is based on many conversations with AMF over time.
- 73
These dates refer to the implementation periods for the Global Fund cycle, not the fundraising periods. For more details on the distinction, see this page.
- 74
For example, AMF notified GiveWell that a large proportion of Togo’s malaria allocation from the Global Fund in the 2021-23 grant cycle was being spent on health systems strengthening, rather than programs specific to malaria (see this spreadsheet). This informed our analysis as follows:
- Our previous understanding had been that the Global Fund’s malaria allocation for Togo significantly increased between the 2018-20 and 2021-23 grant cycles. As a result, we assumed that the funding gap for ITNs in Togo would shrink in 2021-23 compared to 2018-20 without additional support from AMF.
- In fact, there was still a funding gap for 2021-23.
- Learning that this money was being spent on health systems strengthening projects made us more confident that the Togolese government would not have been able to fund the ITN campaign without funding from AMF.
- However, we still chose to assign a high (60%) probability that other actors would have replaced AMF’s funding in AMF’s absence. This was on the basis that AMF’s history of supporting ITN campaigns in Togo might have been one factor contributing to the Togolese government’s decision to prioritize health systems strengthening projects.
See this section of our grant page for the Togo campaign for further details on our reasoning.
- 75
See AMF, "Distributions" ("Pre-Distribution" section for each campaign).
- 76
See our discussion of this procedure above.
- 77
See the "Registration" section of this report.
- 78
I.e., the proportion of households where the backcheck and registration data agree on the same value for the same measure.
- 79
The analysis covers AMF-supported campaigns in six countries between 2017 and 2019 (Togo, Uganda, Zambia, Malawi, Guinea, Ghana). Of households which could be automatically matched, correspondence rates for the number of residents per household varied from 64% (Guinea, 2019) to 96% (Zambia, 2018). Correspondence rates for the number of ITNs required per household varied from 68% (Guinea, 2019) to 100% (Uganda, 2017). When comparing the registration and backcheck data using AMF’s preferred benchmark for data quality (do the registration and backcheck data record the same number of residents and ITNs required per household, + or - 1), correspondence rates across all campaigns are over 75% and in most campaigns are over 90%. AMF, 105% Registration, Findings and Actions, November 2019.
- 80
AMF notes that different data collectors might reach different conclusions during the registration and backcheck for a number of reasons, including speaking to different individuals, ambiguity in the concept of a “sleeping space”, and rapidly changing household composition over time. AMF, 105% Registration, Findings and Actions, November 2019.
- 81
Of records that could be matched, the backcheck found correspondence within +/- 1 (meaning the backcheck record for a household showed the same number of ITNs registered as the original record, one more, or one fewer) was 95% for ITNs in Uganda and 85% for ITNs in Togo. GiveWell, 2020 campaign registration data analysis (unpublished).
- 82
Our understanding is that AMF also asks partners to conduct process monitoring, whereby an independent partner funded by AMF monitors campaign planning and field activities to ensure they comply with processes required by AMF. However, we have not seen details of the process or findings from this monitoring, and we do not know how consistently this type of monitoring is happening and what information AMF has learned from it. We therefore do not focus on process monitoring in the rest of this review.
- 83
We also analyze net retention (i.e., what proportion of AMF-distributed nets are present in households over time). We don’t focus on this measure in our analysis because we think it is of secondary importance compared to the other measures, as our analysis of usage already factors in whether nets are present in the household and nets cannot be used unless they are present.
In addition, we have low confidence in the accuracy of the results from AMF’s monitoring on the number of nets retained in households. See the discussion here for more detail. - 84
See this spreadsheet, “Results: Net usage” sheet.
- 85
See this spreadsheet, “Results: Net presence” sheet.
- 86
See this spreadsheet, “Results: Net condition” sheet.
- 87
These include campaigns in DRC (2019, 2020, and 2021), Guinea (2019), Ghana (2018), Malawi (2018), Togo (2017 and 2020), Uganda (2017 and 2020), and Zambia (2017). PDMs have also been conducted for the 2017, 2018, and 2019 campaigns in Papua New Guinea, but we have not reviewed them in depth. We have not reviewed PDMs for the other campaigns AMF supported in 2021.
Although AMF supported distributions prior to 2017, we focus our review on results from PDMs conducted for distributions from 2017 onward, as we believe they are more likely to be indicative of what we can expect from future distributions. - 88
The averages reported in this table are a simple average from different campaigns, and are not weighted by the size of each campaign.
- 89
As of September 2022, we have seen the following results from each country:
- DRC (2019, 2020, and 2021). In DRC, distributions, and therefore PDMs, are conducted at the province level. Most scheduled PDMs have been completed. For 2019 campaigns, we have seen results from the 9- and 18-month PDMs in Équateur, and 9-month PDMs in Haut Katanga and Sud Ubangi. For 2020, we have seen results from the 9-month PDMs in Kongo-Central, Haut Lomani, Kinshasa, and Tanganyika. For 2021, we have seen the 9-month PDM from Haut Uele. As of this writing in September 2022, we have not yet seen results from the 9-month PDMs for the 2021 distributions in Ituri and Tshopo provinces of DRC that were completed in March and April 2022. See here.
- Guinea (2019): Scheduled PDMs have been completed. We have seen results from the 9-month, 18-month, and 27-month PDMs.
- Ghana (2018): Scheduled PDMs have been completed. We have seen results from the 9-month, 18-month, and 27-month PDMs.
- Malawi (2018): Scheduled PDMs have been completed. We have seen results from the 9-month, 18-month, and 27-month PDMs.
- Togo (2017 and 2020): In 2017, PDMs were delayed and were not conducted until 18 months post-distribution. See here. We have seen results from the 18-month and 24-month PDMs. For 2020, we have seen results from the 9-month PDM.
- Uganda (2017 and 2020): Scheduled PDMs have been completed. For 2017, we have seen results from the 6-month, 9-month, 12-month, 18-month, 24-month, and 30-month PDMs. For 2020, we have seen results from the 9-month PDM, but have not yet seen results from the remaining PDMs. See here for the status of the 18-month PDMs..
- Zambia (2017): We have seen results from the 12-month, 18-month, and 27-month PDMs.
See here for a list of the PDMs we have seen, and see the cell notes for details on delays in scheduled PDMs.
- 90
AMF, comment on a draft of a previous version of this review, June 2022.
- 91
See this section for more details.
- 92
AMF noted that these spare households are selected randomly. AMF, comments on a draft of a previous version of this review, June 2022.
- 93
See cell C4 on each of the "Methods" sheets in this spreadsheet. While smaller villages are overrepresented, the smallest villages are excluded from the sample: AMF excludes from selection any villages with fewer than a threshold number of households. In practice, this has led ~5% or less of households to be excluded from the sample in all countries except Togo, where 9.8% of households were excluded from the sample.
- 94
See this spreadsheet, sheet "Source: Allocated vs Distributed + Weightings," cells K10-19. We have not yet incorporated this analysis into this review, which reports unweighted results.
- 95
"Below we have shared a summary of our thinking about why households may not be interviewed, and how that relates to the likelihood that the household received nets at a distribution point.
Households not available for PDMs for the following reasons would not be systematically more or less likely to have been reached by the distribution:- Those that have moved or cannot be located in the village
- Those that are away visiting family
- Those at the market/ making social visits
Households not available for PDMs for the following reasons may be less likely to have been reached, with caveats:
- Those where HH members were at work during the day. If all HH members work every day, it may be that nobody was able to go to the distribution point to collect nets. However, NMCDs usually ensure that distribution points are open for multiple days, and early/late, to mitigate against this risk.
- Those where the only HH member has passed away. If the sole household member was elderly, it is possible that s/he was less likely to have travelled to the distribution point to collect a net.
If for any reason a particular village was less likely to be reached by the distribution (e.g., too far from the distribution point, or did not receive word about the date), then we would expect to see evidence of this in the households that we were able to survey." AMF, comment on a draft of a previous version of this review, October 2020.
- 96
- See cell D6 on each of the "Methods" sheets in this spreadsheet.
- An Ebola outbreak occurred at the time of the PDM in the Équateur province of DRC, which lowered the completion rate of surveys:
"AMF’s partners worked closely with the provincial health teams to identify which villages needed to be excluded from the survey so as to not put field staff at risk. 40 villages were excluded due to Ebola. Removing these villages, the completion rate was 79% (5,612 HHs reached out of smaller sample of 7,140, with 5.8% of household interviewed were spares, resulting in 74% of selected households in non excluded villages interviewed." AMF, comment on a draft of a previous version of this review, June 2022.
- 97
See cell D6 on each of the "Methods" sheets in this spreadsheet.
- 98
See example here: AMF, PDM data collection form, Uganda.
- 99
AMF told us that data collectors are instructed to directly observe and assess the condition of all ITNs that are present and hanging, which includes both ITNs found hanging by data collectors and ITN that households report as being taken down during the day but hung at night. Against Malaria Foundation, conversation with GiveWell, August 6, 2020 (unpublished).
- 100
"For our recent PDMs where data is collected electronically we have put in place data validation to mitigate against this. We ask partners to validate the information in Question 4 (self-reported responses about hang-up) with the objective measures from Question 3 (LLINs found hanging and or in use at night)." AMF, comment on a draft of a previous version of this review, October 2020.
- 101
For example: "This difference occurs as households report fewer nets received than registered (e.g. 20 nets hung divided by 25 self-reported nets = 80%, versus 20 nets hung divided by 26 registered nets = 77%." AMF, comment on a draft of a previous version of this review, October 2020.
AMF uses self-reported nets received as the denominator in its net presence results (see this spreadsheet, sheet "Results: Net presence"). Because AMF has data on the number of nets that households were registered to receive, it is possible to replace the self-reported figures with registration data. See this spreadsheet, sheet "Source: Allocated vs Distributed + Weightings," cells D10-D19. We have not yet incorporated this analysis into this review, which reports results that use self-reported nets as their denominator.
Separately, AMF has compared distribution data on ITNs received and self-reported PDM data on ITNs received. It found that across countries, the proportion of household records that agreed on this figure was 48% at 6 months and decreased to 37% at 30 months. Other findings included: "1. The % of households that report a number of nets within +/-1 of the number recorded during distribution is >70% at all time points. 2. The % of households that report the same number of nets as recorded in the distribution data reduces over time. 3. The % of households that report fewer nets received than the distribution data indicates increases over time." Against Malaria Foundation, responses to GiveWell questions, May 15, 2020 (unpublished).
- 102
AMF, comment on a draft of a previous version of this page, October 2020.
- 103
For the 2017 campaign in Togo, the PDM implementer was a branch of Togo's Ministry of Health and was involved in the distribution. See this spreadsheet, sheet "Methods: Togo (2017)," cell C10 for the PDM implementer, and this spreadsheet, sheet "Detailed overview," column "Distribution Partner," for the distribution partner. NMCP (National Malaria Control Program) and PNLP (Programme National de Lutte contre le Paludisme) are both acronyms referring to countries' national malaria control programs.
- 104
The cases are Malawi 2018, Uganda 2017, and Zambia 2017. See cell C10 on each of the "Methods" sheets for those countries in this spreadsheet.
- 105
See cell C9 on each of the "Methods" sheets in this spreadsheet. About 80% of records were paired for DRC (Équateur), Zambia, Uganda, Togo, and Malawi, and 90-95% were paired for Ghana and Guinea. We have summarized this as roughly 85% overall.
- 106
"The most common reason, accounting for ~2/3 of instances where we cannot match a re-visit record, is that the household was on the list for both main and re-visit surveys but was only surveyed for the re-visit.
To maximise the number of matching pairs, we could select the re-visit households from the main households surveyed, rather than the main households selected for the household lists. However, to do this we would have to receive, import and select re-visit households in a narrow window of time between main and re-visit data collection. Given the AMF time that would be required and the importance of prompt re-visit data collection, we decided that it would not be practical to make this part of our methodology." Against Malaria Foundation, responses to GiveWell questions, June 23, 2020 (unpublished).
AMF has also provided other reasons that records may not be paired: "Other reasons that account for the remaining ~1/3 of re-visit records that cannot be matched are:- Household ID recorded incorrectly: Where IDs are entered by data collectors/ clerks, an element of human error will mean there are instances where the main or re-visit ID is incorrect and therefore cannot be matched.
- Duplicate household IDs: Errors can have knock-on effects if they lead to multiple main households with the same ID within a village. Any re-visit record with this ID will remain unmatched, as there is no way to automatically determine which main household should be used for a matching pair.
- Data entered and imported to the wrong part of the DES: As mentioned in our discussions about registration data and matching, our standard code only matches households within a village, so any main or re-visit data entered/imported into the wrong part of the DES will inhibit matching. However, this situation is less likely during PDMs as the locations are exported initially from the DES.
- Data erroneously entered and imported as re-visit records: For Malawi PDM-09, main records were erroneously entered and imported as re-visit records, and as these households were only visited once, the code could not find a matching pair in the main data. These data have are being reimported and the error corrected. See next question for more details.
For electronic data collection, household lists are uploaded directly to the data collection tool, minimising the chance of reasons 3 and 4 occurring." Against Malaria Foundation, responses to GiveWell questions, June 23, 2020 (unpublished).
- 107
See cell C9 on each of the "Methods" sheets in this spreadsheet.
- 108
AMF, comment on a draft of this review, November 14, 2023.
- 109
AMF, comment on a draft of a previous version of this review, June 2022 (unpublished).
- 110
Note that we refer to this measure as "usage" in this report, but "coverage" in our accompanying spreadsheet with data on AMF’s PDMs. These refer to the same concept - the proportion of people sleeping under ITNs that are found hanging in households.
- 111
- "Please complete the following table for all nets found hanging in the household...How many slept under this net last night?" AMF, PDM data collection form, Uganda.
- "Households will also have other nets, for example received through routine distribution, which may be used to cover people at night but will not be counted in the presence tables...Information about these nets is captured in Question 3 on our PDM form and is used to calculate our reported sleeping space coverage and people coverage." Against Malaria Foundation, responses to GiveWell questions, June 23, 2020 (unpublished).
- Since sharing AMF, PDM data collection form, Uganda, AMF has updated its method for calculating usage rates. It now removes data abnormalities and uses as a denominator the number of people who slept in the household the previous night, rather than regular household members. AMF, Email to GiveWell, April 22, 2022 (unpublished).
- 112
See here. AMF told us that the Zambia campaign had insufficient ITNs, and thus the number of ITNs that could be distributed to households was capped (Against Malaria Foundation, conversation with GiveWell, November 20, 2019 [unpublished]). If households did not receive enough ITNs to cover all sleeping spaces, this may have contributed to the relatively low coverage rate measured in Zambia.
- 113
AMF, comment on a draft of this review, November 14, 2023.
- 114
See question 4 in AMF, PDM data collection form, Uganda.
- See full results in this spreadsheet, sheet "Results: Net presence."
- Other potential sources of evidence for ITN presence are AMF's household-level registration and distribution data. As described above, registration data shows the number of ITNs that were allocated to each household during a pre-distribution household census, while distribution data shows the number of ITNs actually distributed to each household during the distribution. AMF has collected both types of data for all large-scale distributions it has supported. To date, we have preferred to use PDM evidence to understand AMF's impact, as we believe that the informativeness of AMF's registration and distribution data is limited. This is because:
- Registration data captures ITNs allocated, rather than ITNs received. It thus provides only indirect evidence for ITN ownership.
- Distribution data provides direct evidence for ITN ownership, but unlike PDMs, it captures only one point in time. Additionally, AMF told us that it has fewer procedures in place to ensure high quality in distribution data than it does for registration data and PDM data (Against Malaria Foundation, conversation with GiveWell, June 4, 2020 [unpublished]). We are thus less confident in the reliability of this data.
- 115
This assumption is based on WHO guidance, which recommends that one net is required per 1.8 people for planning ITN campaigns. This is based on a target of distributing one net for every two people at risk, and then rounding up for households with an odd number of members (e.g., two nets for a household of three people).
“…Mass campaigns should distribute 1 ITN for every 2 persons at risk of malaria. However, for procurement purposes, the calculation to determine the number of ITNs required needs to be adjusted at the population level, since many households have an odd number of members. Therefore a ratio of 1 ITN for every 1.8 persons in the target population should be used to estimate ITN requirements, unless data to inform a different quantification ratio are available." WHO, Guidelines for Malaria Vector Control, 2019, p. 39.
- 116
This would be consistent with our analysis of AMF’s monitoring data, suggesting that approximately 2 people sleep under each hanging net on average (varying by country). See this section of our separate report on ITNs for further details.
- 117
We note that this measure only captures usage of nets found hanging, and therefore cuts out the possibility of false self reports from people who do not hang nets at all. We think this is likely to minimize social desirability bias to some extent. However, it still leaves the possibility that people may overreport how many household members sleep under each hanging net.
- 118
See this spreadsheet, "Results: Net condition" sheet.
- 119
AMF, comment on a draft of this review, November 14, 2023.
- 120
AMF, email to GiveWell, November 22, 2023.
- 121
See these rows in our cost-effectiveness analysis. As of December 2023, we adjust our cost-effectiveness estimate down by 4% to account for our level of confidence in AMF’s monitoring.
One further exception is that we use data from the PDMs to inform our adjustment for lower net durability in DRC. This is discussed in the "Net condition" summary above. - 122
For a detailed discussion of this adjustment, see our write up in our separate report on ITNs. Our calculations are available on this sheet of our cost-effectiveness analysis.
- 123
Note that AMF has since moved towards purchasing a higher proportion of next-generation nets, whose durability may be different to the ITNs we included in our analysis. AMF, comments on a draft of this review, November 14, 2023. We discuss this issue in detail in this section of our separate report on ITNs.
- 124
We also use data from a study of net survival in DRC with a longer-term follow up. Both sources imply net durability in DRC is lower than in other locations. See this spreadsheet for our calculations.
- 125
See this section of our accompanying report on mass distribution of ITNs.
- 126
The meta-analysis and details of the studies it summarizes are discussed in detail in our accompanying report.
- 127
See this section of our accompanying report on ITNs.
- 128
This was added to our qualitative assessment in 2023. We have not yet thoroughly assessed AMF on this measure.
- 129
PBO (piperonyl butoxide) is an additive to ITNs which aims to mitigate the impact of insecticide resistance. The WHO recommends that PBO nets should be distributed instead of standard LLINs in areas where mosquitoes exhibit certain kinds of insecticide resistance.
“…Pyrethroid-PBO nets prequalified by WHO are conditionally recommended for deployment instead of pyrethroid-only LLINs where the principal malaria vector(s) exhibit pyrethroid resistance that is: a) confirmed, b) of intermediate level,12 and c) conferred (at least in part) by a monooxygenase-based resistance mechanism, as determined by standard procedures…
…PBO acts by inhibiting certain metabolic enzymes (e.g. mixed-function oxidases) within the mosquito that detoxify or sequester insecticides before they can have a toxic effect on the mosquito. Therefore, compared to a pyrethroid-only net, a pyrethroid-PBO net should, in theory, have an increased killing effect on malaria vectors that express such resistance mechanisms. However, the entomological and epidemiological impact of pyrethroid-PBO nets may vary depending on the bioavailability and retention of PBO in the net, and on the design of the net (i.e., whether only some or all panels are treated with PBO).”
WHO, Guidelines for Malaria Vector Control, 2019, p. 37. - 130
GiveWell, "Against Malaria Foundation — Support for LLIN Campaign in South Sudan," published August 2022, updated January 2023.
- 131
This understanding is based on many conversations with AMF over time.
- 132
As discussed above, AMF reports that it is now more explicit about this requirement in initial discussions with each country, and aims to ensure that partners do not have to incur extra costs as a result of the procedure (e.g., because AMF will purchase additional nets to compensate for the costs). It also reports that 5 of 8 countries where it works have adopted the procedure nationwide (including in areas where AMF does not fund nets). AMF, comment on a draft of this review, November 14, 2023. We have not independently investigated or tried to corroborate this.
- 133
- 134
Revenue for the 2021 financial year (ending June 2021) was $107m, and revenue for the 2022 financial year (ending June 2022) was $121m. AMF, "Financial Information"
- 135
See this row in our cost-effectiveness analysis. We exclude Chad and South Sudan from this range, as (at the time of writing) we estimate that ITN programs in these countries are below our funding bar.
- 136
See these rows of our cost-effectiveness analysis for our cost per net calculations.