This is an archived version of this page. For more up-to-date information, see our most recent report on the evidence for LLINs from large-scale programs.
Published: November 2011
Funding for malaria control has increased substantially since 2004, making a large number of national scale-ups possible.1 In most cases it appears that these scale-ups have included significant funding spent on LLIN distribution but also (concurrently) significantly increased spending on other malaria control measures,2 making it difficult to isolate the impact of LLIN distribution.
We focus here on the case for large-scale successes in malaria control, though we address the role of LLIN distributions in passing.
Note that this is part of our broader review of mass distribution of long-lasting insecticide-treated nets to fight malaria.
Full review of GiveWell’s research on ITNs
As noted in our blog post, a GiveWell Research Analyst conducted a full review of the content of this page as well as the others related to LLINs (our review of the Against Malaria Foundation and report on long-lasting insecticide treated nets).
Reporting on large-scale successes
The World Malaria report3 provides
- Estimates of the coverage of malaria control interventions, by country - for example, page 20 estimates ITN coverage for each year 2000-2010 - for 44 countries in sub-Saharan Africa. (Coverage data is based on both delivery data and survey data.4 )
- Estimates of malaria cases5 and malaria deaths6 by country and by year.
The 2010 World Malaria Report synthesizes this data into a table showing (a) which countries have seen major reductions in malaria; (b) which countries have seen substantial (50%+ coverage) malaria control efforts.7
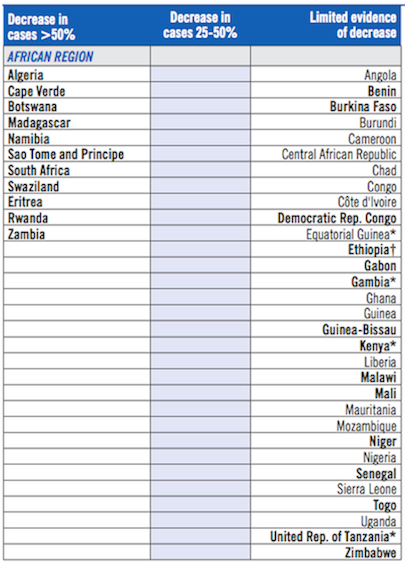
The countries in the left-hand column appear to be considered "successes" by the report: in each of these, the report is asserting that malaria control was significant and malaria fell substantially. The report's discussion of its methodology implies that it tries to assess data quality and appropriately infer causality in listing these.8 The report proceeds to discuss several of these "successes": for sub-Saharan Africa it discusses Eritrea, Ethiopia (listed in the right-hand column but noted for sustaining a low malaria burden since 20059 ), Rwanda, Madagascar, Sao Tome and Principe, and Zanzibar (a part of Tanzania, which is listed in the right-hand column).10 In general, the report appears to ascribe a very high degree of importance to ITN coverage.11
The profiles of high-burden countries provided at the end of the report12 provide information on funding allocated to ITN coverage vs. other malaria control measures, and on coverage of various malaria control measures by year. In most cases, funding allocated to ITNs is significant, but many malaria control measures at once are occurring and malaria data quality is unclear (more below), so it is difficult to say much about the relative contribution of ITNs. Rwanda, Senegal, and Ethiopia are cases where funding seems focused heavily on ITNs and where malaria appears to have declined (though Senegal is not listed as having a significant decline in malaria in the report's summary table, pictured above).
Malaria control failures?
In the World Malaria Report's summary table discussed above, there appear to be 12 countries listed as malaria control successes (left-hand column plus Ethiopia, which is listed in the right-hand column but noted for sustaining a low malaria burden since 2005).13 But there are also 15 countries where it appears that malaria control efforts have been strong,14 yet there is (to use the wording of the right-hand column header) "Limited evidence of decrease" in malaria burden.
These don't necessarily represent failures of malaria control efforts. For some of these countries, the lack of apparent decline in malaria could simply be a reflection of poor data. For others, the lack of an apparent decline in malaria could be a sign that something has gone wrong. The WHO does not appear to distinguish between the two: all countries for which there is "Limited evidence of decrease" are put in a single column.
We took our own rough look at the data provided by the report in order to see whether we could clearly distinguish between these two cases. We charted ITN coverage15 and malaria deaths16 for 2000-2009, for all countries in sub-Saharan Africa for which data in both categories is available. Our full set of charts17 and the Excel file used to produce them18 are available. In some of these charts, there is a lot of missing data, or wildly volatile data; or ITN coverage did not reach a high level. In others, it looks like malaria deaths fell substantially. But some look like they could be cases where a rapid scale-up in ITN coverage failed to result in a drop in malaria deaths - particularly Burkina Faso, Democratic Republic of the Congo, Malawi, Mali, Niger and Togo.
None of these countries are included in the profiles of high-burden countries provided at the end of the report,19 but 5 of the 7 are profiled in the previous year's report, and in 4 of these 5 cases (the exception being Democratic Republic of the Congo) the report speculates that increases in reported malaria burdens may reflect improved reporting rather than a failure of malaria control.20
As of this writing, we remain unclear on whether there are consistent criteria for distinguishing reliable from unreliable data, and thus for distinguishing (a) successes of malaria control, (b) failures of malaria control, and (c) cases where data is inconclusive. The World Malaria Report seems to group (b) and (c) together ambiguously, making it difficult to assess the overall track record of large-scale malaria control. We have contacted authors of the World Malaria Report about this issue and expect to discuss with them in a few weeks.
Update (October 4, 2012): On January 10, 2012 we spoke with Richard Cibulskis, co-author of the World Malaria Report and compiled notes from our conversation.21 He referred us to the 2011 World Malaria Report22 for more information.
Discussion of large-scale malaria control efforts based on smaller-scale studies
Another perspective on the overall track record of malaria control efforts comes from O'Meara et al. 2010, which discusses trends in malaria burden based on studies, rather than based on data from national reporting systems.23 A "dramatic decline in malaria transmission in The Gambia" is attributed primarily to ITNs; declines in malaria burden in Eritrea and Zambia are attributed to a combination of interventions including ITNs (though the Eritrea decline in burden was not accompanied by a decline in malaria mortality); and Burundi is noted as a case where "No additive benefit of bednets could be detected,"24 though we note that in the latter case, coverage of ITNs was very low over the time period discussed.25
Bottom line on the connection between ITN coverage and malaria burden
We find the available data to be easily consistent with the idea that scaling up ITN coverage often - or even always - results in a reduction in malaria burden in line with what small-scale studies would predict. However, we do not find this data to provide strong affirmative evidence of this idea. We believe we will improve our understanding of this topic when we speak with the authors of the World Malaria Report.
Update (October 4, 2012): On January 10, 2012 we spoke with Richard Cibulskis, co-author of the World Malaria Report and compiled notes from our conversation.26 He referred us to the 2011 World Malaria Report27 for more information.
Sources
- Cibulskis, Richard. World Malaria Report. Conversation with GiveWell (DOC), January 10, 2012.
- GiveWell. Country-level charts of ITN coverage vs. malaria mortality (DOC).
- GiveWell. Tabulation of ITN coverage vs. malaria mortality (XLS).
- O'Meara, Wendy Prudhomme et al. 2010. Changes in the burden of malaria in sub-Saharan Africa. Lancet 10(8): 345-355. Full text available with free registration www.thelancet.com/journals/laninf/article/PIIS1473-3099(10)70096-7/ (accessed November 25, 2011). Archived by WebCite® at http://www.webcitation.org/68LpzLNdQ.
- World Health Organization. Profiles: 31 high-burden countries (2009) (PDF).
- World Health Organization. World malaria report (2010) (PDF).
- World Health Organization. World malaria report (2011) (PDF).
- 1
See World Health Organization, "World Malaria Report (2010)," charts on Pg 13.
- 2
Ibid.; for some country-by-country breakdowns, see the Country Profiles on Pg 63-137 of the same document (World Health Organization 2010).
- 3
World Health Organization, "World Malaria Report (2010)."
- 4
"Household surveys are the preferred means of assessing whether or not sufficient ITNs have been delivered to cover populations at risk of malaria, although surveys are not conducted frequently enough to provide up-to-date estimates for most countries. Nationally representative household survey information for 2007–2009 is shown in Table 4.2. The surveys cover 21 countries in the WHO African Region representing 59% of the population at risk. National surveys are not undertaken as frequently outside Africa due to the more focalized distribution of malaria in other parts of the world …
In the absence of a recent household survey, it is possible to estimate ITN coverage by combining data from manufacturer reports on ITNs delivered to countries, NMCP reports on ITNs distributed within countries, and previous household surveys as described in the World Malaria Report 2009 and by Flaxman et al. (1). The advantage of such an approach is that it uses all available data to estimate ITN coverage for years in which there has been no survey.
The percentage of households owning an ITN, and children sleeping under an ITN, for 44 sub-Saharan African countries are shown in Table 4.3. The estimates are for 30 June of each year, including 2010. The estimate for 2010 assumes that all nets delivered by manufacturers by June 2010 have been distributed by NMCPs (the average lag between manufacturer delivery and distribution by MoHs estimated to be 5.2 months as noted above)." World Health Organization, "World Malaria Report (2010)," Pg 18-19.
- 5
World Health Organization, "World Malaria Report (2010)," Annexes 7B and 7C.
- 6
World Health Organization, "World Malaria Report (2010)," Annex 7D.
- 7
"Countries in bold show evidence of wide scale implementation of malaria control activities to >50% of the population at high risk." World Health Organization, "World Malaria Report (2010)," Pg 41
- 8
"The reported numbers of malaria cases and deaths are used as core indicators for tracking the progress of malaria control programmes – the working definition of a case of malaria is considered to be “fever with parasites” (1). The main sources of information on these indicators are the disease surveillance systems operated by ministries of health. Data from such systems have three strengths. First, case reports are recorded continuously over time and can thus reflect changes in the implementation of interventions or other factors. Secondly, routine case and death reports are often available for all geographical units of a country. Thirdly, they reflect the burden that malaria places on the health system. Changes in the numbers of cases and deaths reported by countries do not, however, necessarily reflect changes in the incidence of disease in the general population, because: (i) not all health facilities report each month, and so variations in case numbers may reflect fluctuations in the number of health facilities reporting rather than a change in underlying disease incidence; (ii) routine reporting systems often do not include patients attending private clinics or morbidity treated at home, so disease trends in health facilities may not reflect trends in the entire community; and (iii) not all malaria cases reported are confirmed by microscopy or RDT, so that some of the cases reported as malaria may be other febrile illnesses (2). When reviewing data supplied by minis- tries of health in malaria-endemic countries, the following strategy was used to minimize the influence of these sources of error and bias … [goes on to list several methods of assessing data quality] …
In establishing a causal link between malaria disease trends and control activities, one should consider what the disease trends would have been without application of the control activities and then assess whether the decrease in malaria observed is greater than that expected without control activities. A realistic view of what would have happened without control activities (i.e. counterfactual) cannot be established from the data currently available; however, it can be expected that, without a change in control activities, the malaria incidence might fluctuate in response to short-term climate variations but would otherwise show little change, as improved living conditions, environmental degradation or long-term climate change have only gradual effects (although there may be local exceptions). Thus, a plausible link with control efforts can be established if the disease incidence decreases at the same time as control activities increase, if the magnitude of the decrease in malaria incidence is consistent with the magnitude of the increase in control activities (a 50% decrease in the number of cases is unlikely to occur if malaria control activities cover only 10% of the population at risk) and if the decreases in malaria incidence cannot readily be explained by other factors.
Countries and territories for which there is evidence from good quality surveillance data of a large, sustained decrease (e.g. > 50% or > 25%) in the number of cases since 2000 are presented in Table 6.1 by WHO Region. Information on the scale of malaria control interventions is also summarized, to identify countries with preventive programmes covering > 50% of the population at high risk and countries that undertake extensive case detection and treatment. Countries in which there is evidence of both a sustained decrease in cases since 2000 and extensive control activities are highlighted as providing evidence of an impact of malaria control activities. Selected high-burden countries in the WHO African Region are discussed individually. For other WHO Regions, the results of the analysis are shown in a standard set of graphs, as described in Box 6.1, section 6.3." World Health Organization, "World Malaria Report (2010)," Pg 39-40.
- 9
"The number of reported cases and admissions has remained low since
2005." World Health Organization, "World Malaria Report (2010)," Pg 41. - 10
World Health Organization, "World Malaria Report (2010)," Pg 42-45.
- 11
- Eritrea: " The reduction in disease burden is associated with the scale-up of malaria control efforts in the country. More than a million ITNs were distributed over the years 2000–2006, and in 2004 about 80% of households living in areas at high risk for malaria owned a net. The NMCP delivered another 564 000 LLINs during 2007–2009, enough to cover 31% of the population at high risk, complemented by focal IRS ..." World Health Organization, "World Malaria Report (2010)," Pg 41.
- Ethiopia: "The lower levels of admis- sions and deaths after 2004 are associated with an expansion in the malaria control programme; more than 25 million ITNs were delivered between 2005 and 2009 targeting 40 million people at high risk. The NMCP also undertakes IRS, which has increased in scale to protect 28 million in 2008 from a base of between 2.8 and 6 million from 2002 to 2007. ACTs were made available to all public facilities in 2004 and to community levels through health extension workers in 2007; these workers are mandated to diagnose malaria using RDTs and to treat confirmed malaria patients with ACTs. It is not known whether the lower levels of hospital admissions and deaths after 2004 would have occurred without these malaria interventions, but the major malaria epidemics of the past seem to have been avoided in the last 5 years. A slight increase in malaria admissions was recorded in 2009. World Health Organization, "World Malaria Report (2010)," Pg 41.
- Rwanda: " There was a 25% increase in the number of patients tested in 2009, but this is smaller than the 77% increase in confirmed malaria cases, and the slide positivity rate increased from 18% in 2008 to 25% in 2009. National-level rainfall and temperature anomalies were not associated with the resurgences4. A substantial proportion of LLINs were distributed 2–3 years ago and it is possible that the effectiveness of LLINs has become reduced with ageing of nets.
In response to the resurgence in uncomplicated malaria cases and to meet the universal LLIN coverage targets, the NMCP started mass distribution of new LLINs to selected districts according to malaria risk mapping (two per household), providing 184 000 in December 2009 and 581 000 in March 2010. In April 2010, a further 1.6 million new LLINs were distributed to all children < 5 years of age nationwide during a measles vaccination campaign. As a result of these initiatives the resurgence in malaria cases appears to have been reversed. From October to December 2010, another 2.1 million LLINs will be distributed to ensure that all households have two LLINs and that further increases in malaria cases and deaths are avoided." World Health Organization, "World Malaria Report (2010)," Pg 42.
- Sao Tome and Principe: " Until 2008, the data show a strong association between interventions and impact (5). However, in 2009 the number of confirmed malaria cases increased from 1647 to 3893, a 140% increase since 2008. Malaria-related admissions rose from 850 to 950 (up 44%) and malaria-related deaths from 16 to 23 (up 44%). The increase in 2009 followed a year when IRS had not been carried out, although the percentage of households owning at least one ITN remained high in 2009 (76% from a national survey). Once the increase in cases was detected by the surveillance system, emergency IRS was implemented and malaria cases decreased during the second half of 2009." World Health Organization, "World Malaria Report (2010)," Pg 44.
- Zambia: " Household ITN ownership declined from 69.8% in 2008 to 50% in 2010 in Luapula province, but remained relatively high in Eastern province (74.8% in 2008 and 76.1% in 2010), so decreasing ITN coverage does not account for the malaria resurgence observed in both provinces. A large proportion of nets were delivered 2–3 years before the resurgence and it is possible that their effectiveness has deteriorated owing to decay of insecticide and physical deterioration of nets. Rainfall increased in both provinces in the quarter prior to the resurgence. The impact of malaria control on malaria admissions, cases and deaths was less in Luapula and Eastern provinces than in other provinces before the resurgence." World Health Organization, "World Malaria Report (2010)," Pg 44.
- Zanzibar: "The dramatic decrease in the number of admissions for malaria in Zanzibar was associated with high coverage of antimalarial interventions. The decrease could also be due in part to improved diagnosis of cases as RDTs began to be more widely used from 2005. Other evidence for an impact of malaria interventions comes from a detailed investigation in one district, where among children < 5 years there were substantial reductions in P. falciparum prevalence, malaria-related admissions, blood transfusions, crude mortality and malaria- attributed mortality following the introduction of ACTs in 2003 (6)." World Health Organization, "World Malaria Report (2010)," Pg 45.
- 12
World Health Organization, "World Malaria Report (2010)," Pg 63-137.
- 13
"The number of reported cases and admissions has remained low since
2005." World Health Organization, "World Malaria Report (2010)," Pg 41. - 14
"Countries in bold show evidence of wide scale implementation of malaria control activities to >50% of the population at high risk. For high burden African countries Djibouti, Somalia and Sudan ITN coverage was derived from a model as described in Section 4.1." World Health Organization, "World Malaria Report (2010)," Pg 41.
- 15
From World Health Organization, "World Malaria Report (2010)," Pg 20.
- 16
From World Health Organization, "World Malaria Report (2010)," Annex 7D.
- 17
GiveWell, "Country-Level Charts of ITN Coverage vs. Malaria Mortality."
- 18
GiveWell, "Tabulation of ITN Coverage vs. Malaria Mortality."
- 19
World Health Organization, "World Malaria Report (2010)," Pg 63-137.
- 20
- Benin: not profiled
- Burkina Faso: "The numbers of reported cases and deaths have increased consistently in recent years, but it is not known if this reflects a real increase in malaria burden or improved reporting." World Health Organization 2009, Pg 78.
- Democratic Republic of the Congo: "Almost none of the 5 million reported suspected malaria cases in 2008 … are confirmed. The number of malaria deaths reported by the programme was 18928 in 2008 alone. The programme delivered a total of about 11.2 million LLINs during 2006-2008, adequate to protect about 37% of the population. IRS was begun in 2008 in selected districts, covering only 83000 people at risk. The programme delivered a total of 1.7 million ACT treatment courses in public facilities in 2008, covering only 32% of the treatment needs in those facilities. Funding for malaria increased from US$ 20 million in 2005 to over US$ 50 million in 2008, mainly from the World Bank and the Global Fund, with about US$ 2 million annually from the Government." World Health Organization 2009, Pg 96.
- Malawi: "The numbers of malaria cases and deaths reported through the surveillance system were either stable or showed an increasing trend. It is not known whether this is due to improved reporting or an increased incidence." World Health Organization 2009, Pg 117.
- Mali: "The number of reported suspected malaria cases has increased in recent years, and the number of reported deaths increased more than twofold between 2001 and 2008. It is not known whether the increase was due to improved reporting or to an increase in incidence." World Health Organization 2009, Pg 120.
- Niger: "The numbers of reported cases and deaths fluctuated over the period 2001-2008, mostly showing increasing trends, probably due to better reporting." World Health Organization 2009, Pg 129.
- The Gambia: not profiled.
- Togo: not profiled.
- 21Richard Cibulskis, conversation with GiveWell, January 10, 2012.
- 22World Health Organization, "World Malaria Report (2011)."
- 23
"The burden of malaria in countries in sub-Saharan Africa has declined with scaling up of prevention, diagnosis, and treatment. To assess the contribution of specific malaria interventions and other general factors in bringing about these changes, we reviewed studies that have reported recent changes in the incidence or prevalence of malaria in sub-Saharan Africa. Malaria control in southern Africa (South Africa, Mozambique, and Swaziland) began in the 1980s and has shown substantial, lasting declines linked to scale-up of specific interventions. In The Horn of Africa, Ethiopia and Eritrea have also experienced substantial decreases in the burden of malaria linked to the introduction of malaria control measures. Substantial increases in funding for malaria control and the procurement and distribution of effective means for prevention and treatment are associated with falls in malaria burden. In central Africa, little progress has been documented, possibly because of publication bias. In some countries a decline in malaria incidence began several years before scale-up of malaria control. In other countries, the change from a failing drug (chloroquine) to a more effective drug (sulphadoxine plus pyrimethamine or an artemisinin combination) led to immediate improvements; in others malaria reduction seemed to be associated with the scale-up of insecticide-treated bednets and indoor residual spraying." O'Meara et al. 2010, abstract.
- 24
- Eritrea: "A time-series analysis by Nyarango and co-workers showed that the scale-up of ITNs and indoor residual spraying was associated with a reduction in malaria cases but not with a decline in case fatality, whereas an expansion of community health-worker training was temporally associated with the decline in case fatality but not with the reduction in malaria cases." O'Meara et al. 2010.
- "In neighbouring Burundi, routine health-facility reporting from the Karuzi province showed an epidemic peak of clinically diagnosed malaria in 2001, against a background of low but stable monthly incidence of cases.19 Between 2002 and 2005, annual indoor residual spraying interventions in the province had only a small effect on parasite prevalence. Prevalence in children less than 9 years old declined from 64% to 40%, but the latter figure was not always significantly different from the control group over the 3 years of intervention. No additive benefit of bednets could be detected, and indoor residual spraying in the lowland areas did not reduce prevalence of infection in adjacent highlands." O'Meara et al. 2010.
- "The Zambian National Malaria Control Programme has achieved substantial success in scaling up the use of ITNs, indoor residual spraying, and intermittent preventive treatment in pregnancy with sulphadoxine plus pyrimethamine. ITN ownership increased substantially from 22% in 2004, to 38% in 2006, and 62% in 2008. Between 2006 and 2008, paediatric malaria parasite prevalence declined by 53% and moderate to severe anaemia by 69%. A report from a single outpatient facility showed a remarkable decline in the proportion of febrile cases with malaria, from 40% in 2003 and 84% in 2004 to less than 1% in 2008." O'Meara et al. 2010.
- "Compelling evidence for a dramatic decline in malaria transmission comes from The Gambia where surveillance at five health facilities across the country showed a 50—85% decline in the prevalence of slide-confirmed malaria among outpatients and a 25—90% decline in malaria-related hospital admissions. The trend persisted over 7 years with an apparent contribution from ITN coverage, which increased three-fold to 49% over the surveillance period. The observed reductions were before the introduction of ACTs. The number of outpatient cases declined before the number of inpatient cases did." O'Meara et al. 2010.
- 25
The period discussed is 2002-2005 (Ibid.) World Health Organization 2010 estimates that 6-12% of households owned at least one ITN over this period (Table 4.3, Pg 20).
- 26
Richard Cibulskis, conversation with GiveWell, January 10, 2012.
- 27
World Health Organization, "World Malaria Report (2011)."