Published: December 2012. Updated: September 2013
The December 2012 version of this report is available here.
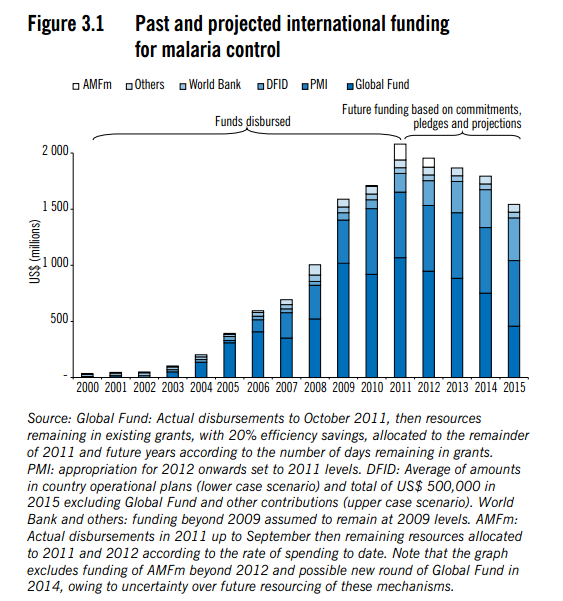
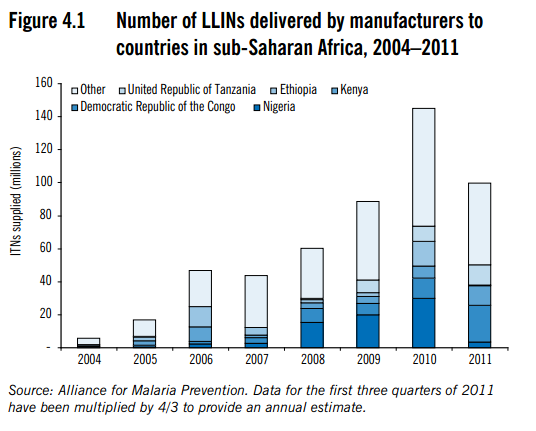
Funding for malaria control, including LLIN distributions, has increased substantially since 2004.1
This page addresses the question of how strong the evidence is that this scaleup has led to a decline in the burden of malaria. It focuses on the question of the general scaleup of malaria control, though when it is possible to discuss the impact of LLINs alone we do so.
Note that this is part of our broader review of mass distribution of long-lasting insecticide-treated nets to fight malaria.
We initially published this page in December 2012. In August 2013, we searched for new evidence that would change our conclusions, closely examining the 2012 World Malaria Report and looking for relevant articles published since our initial report.2 None of the publications we found substantially changed our conclusions, so we have not incorporated them into the text below, though we did make a few other modifications to the page.3
Table of Contents
Evidence from continent-level data
The 2011 World Malaria Report and Murray et al. 2012 are two major recent estimates of malaria mortality trends in Africa. Despite using different methodologies and reaching quite different estimates of overall malaria mortality, both reports conclude that mortality from malaria increased until approximately 2004 and has since fallen.4 This is roughly when malaria control efforts began to be scaled up more quickly.5
However, we do not regard this is as strong evidence of the impact of malaria control efforts, because:
- the coincidence of scale-up and fall in prevalence is not precise6
- the estimates of malaria mortality are very uncertain. Both the WHO and the Murray et al. confidence intervals seem to be compatible with an increase in malaria deaths since 2004 rather than a decline.7
- both estimates are built on complicated models that we have not vetted. The WHO model in particular appears to assume the impact of malaria control in estimating the share of child deaths due to malaria, so using this model to show that malaria control had an impact may be circular.8
- the WHO and Murray et al. confidence intervals for over-five mortality do not overlap, indicating that at least one of the models must be off the mark with respect to that population.9
On the whole, continent-level data do not convincingly show a relationship between the scale-up of malaria control and a fall in malaria mortality, or even a clear trend in malaria mortality.
Evidence from country-level data
Chapter 7 of the 2011 World Malaria Report (World Health Organization 2011) assesses the impact of malaria control, with a focus on Africa.10 It discusses four different sub-regions of Africa, citing a mix of smaller-scale studies and trends in country-level data;11 this section focuses on the latter, and smaller-scale studies are discussed in a later section.
The report analyzes country-level data in a variety of ways to evaluate changes in malaria prevalence and implementation of malaria control in sub-Saharan Africa. Our approach was to try to determine the relationship between prevalence and control.
The report lists 12 African countries that are believed to have seen a substantial decrease in malaria cases between 2000 and 201012 (first two columns of the table below); 2 countries in which malaria cases are believed not to have risen or fallen more than 25% (third column); and 28 countries for which there is insufficient data to determine what has happened to the malaria burden.
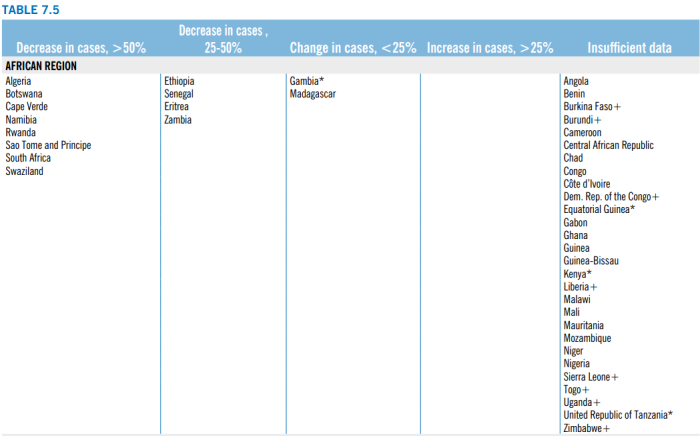
Unfortunately, we have not been able to determine precisely how the report makes these determinations. It refers to the previous year's report for details on its methodology,13 and the previous year's report sketches guidelines for interpreting the data provided by Ministries of Health.14 However, it is not entirely clear how to apply the guidelines to the data provided on each country in order to arrive at the same conclusions as the report. For example, when looking at the country profile for Guinea-Bissau,15 it appears to us that the criteria for considering the data meaningful are met: annual blood examination rate data is available and fairly stable from 2005 on, and confirmed cases are available from 2005 on and don't seem to have fallen, despite a scale-up in LLIN coverage. Yet (as shown above) the WHO lists this as a country where the data is insufficient to say what has happened to malaria cases. On the flipside, Zambia16 appears to have no data on confirmed cases of malaria, yet it is listed (in the table above) as a country for which malaria cases are confirmed to have fallen 25-50%.
In addition to the question of where malaria burdens have fallen vs. risen, there is the question of whether these changes coincided with LLIN coverage, with other forms of malaria control, or with neither of these. Unfortunately, it is difficult to answer this question on a country-by-country basis. The report's Country Profiles17 provide sets of charts with figures related both to malaria burdens and malaria control measures, but as discussed above, we aren't able to determine how to interpret the malaria burden charts in a way that reaches the conclusions shown in the chart above.
We have spoken with the primary author of the report in an attempt to understand how to interpret the data it provides, but it appears that many of the decisions are made informally and the reasoning is not made fully explicit in the report.18
While there are a couple of countries for which the data seems to imply that malaria control was impactful (e.g., a couple of countries showing a decline in cases coinciding with the scale-up in control efforts),19 overall we do not find this data to provide strong evidence regarding trends in malaria burden or the impact of malaria control. At the same time, we acknowledge the possibility that scholars with more context on data-quality-related issues and individual countries' histories may rightly consider the data convincing.
Evidence from smaller-scale studies
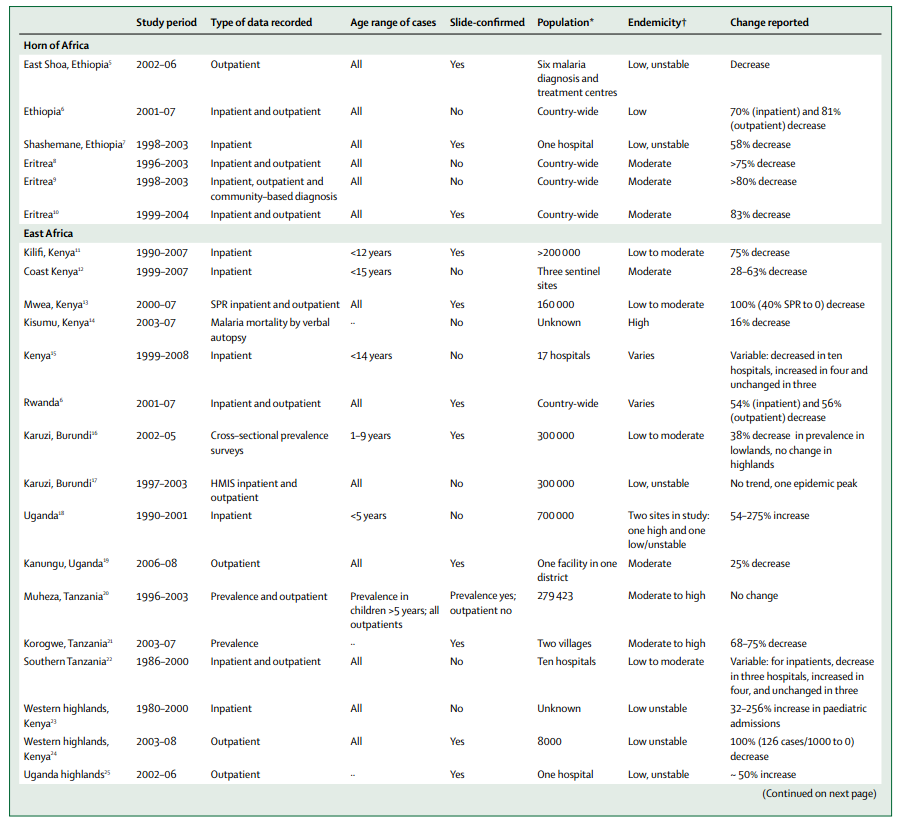
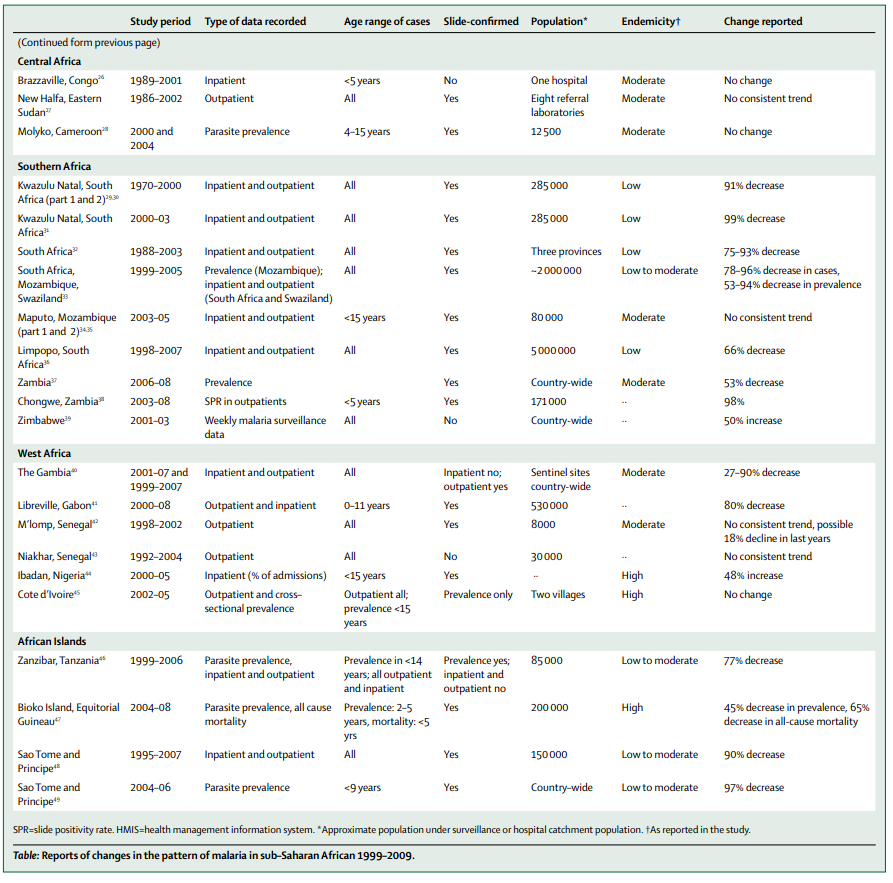
As discussed above, the World Malaria Report states that country-level data varies in quality, making it hard to interpret. In addition to discussing country-level data, the report also cites ten smaller-scale studies that focus on smaller regions, but may collect more reliable data.20 In addition, when we spoke to the primary author of the report, he referred us to three other papers that discuss trends in the burden of malaria and the connection to malaria control measures.21 We found the most useful of these to be O'Meara et al. 2010, which discusses 46 studies that "have reported recent changes in the incidence or prevalence of malaria in sub-Saharan Africa"22 . We first discuss O'Meara et al. 2010, then give briefer notes on the other papers found in the World Malaria Report and referred to in our conversation with its lead author.
Note that these studies are all studies of malaria trends, not the impact of insecticide-treated nets. For the latter, see our full writeup on LLINs. As discussed at that page, studies on the impact of insecticide-treated nets are older (mostly from before 2000), more rigorous in terms of isolating impact (they randomly assign some people to receive LLINs and others not to and assess differences in the two groups), and possibly less representative of everyday conditions (since they look at programs that are implemented and randomized for the purpose of the study). By contast, these smaller-scale studies are trying to pick up malaria trends without specifically looking for the impact of (or running special study-centric versions of) malaria control.
O'Meara et al. 2010
O'Meara et al. 2010 attempts a comprehensive review of studies that report at least 2 years of malaria burden data from the time period 2000-2010 (with a few other stipulations).23 As the summary table on pages 547-54824 shows, the majority of these studies show a substantial decline in malaria burden (as assessed by a variety of different measures). By our tally, out of 44 studies shown in the table, 27 show a decrease in malaria burden while 4 show an increase (the other 13 show no change/inconclusive); of the 27 showing a decrease, 25 show at least a 25% decrease, 22 show at least a 50%+ decrease, 14 show at least a 75% decrease and 6 show at least a 90% decrease. (Note that all of these refer to the more pessimistic end of the range, i.e., the lower-magnitude decline in malaria burden, given in the table. In addition, of the 4 increases, 3 are 50%+, suggesting that malaria cases may be volatile and large changes can't necessarily be confidently attributed to control efforts.)
It is less clear what role malaria control (and LLINs in particular) played in these improvements. The review provides a few approaches to this question:
1. Charts for seven of the cases discussed in the review.
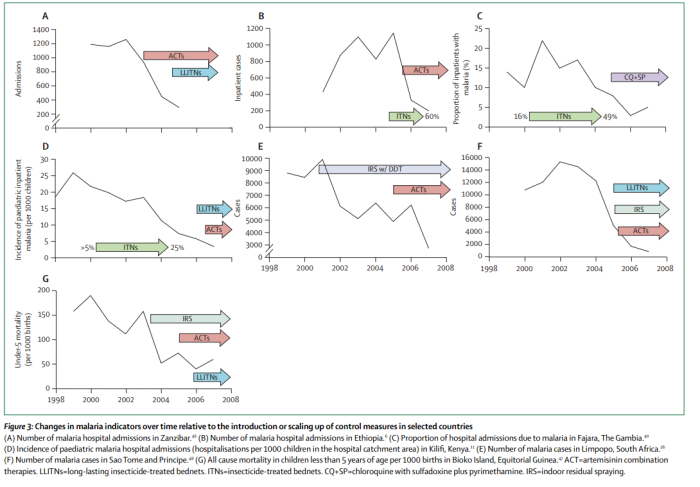
It appears to us that there are reasonable cases for the impact of insecticide-treated nets in Ethiopia (B), the Gambia (C), and possibly Kenya (D). We are not clear on how these cases were chosen to be featured.25
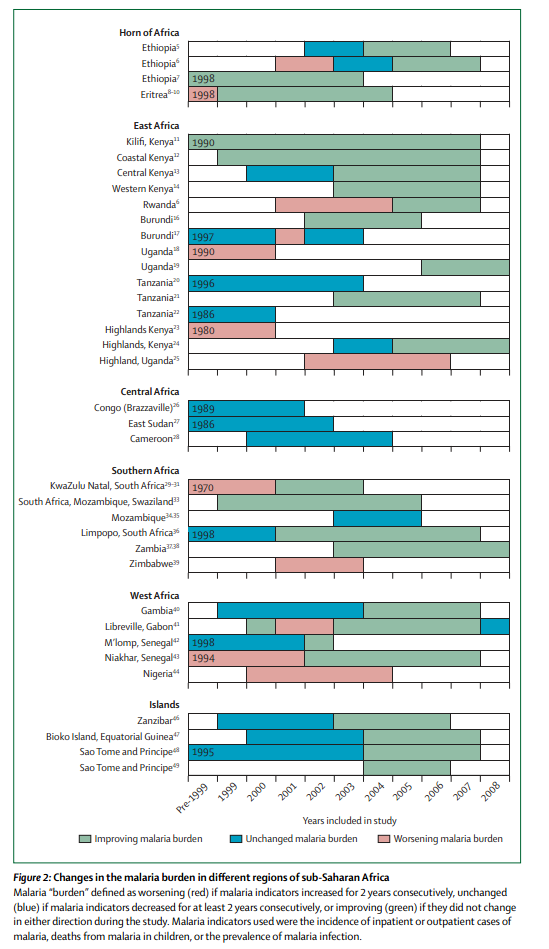
2. A visual summary of the timing improvements that suggests a loose clustering around the time of global malaria control scaleup. As the chart at the top of this page shows, malaria control began scaling up worldwide around 2004, and the following chart from O'Meara et al. 2010 provides some weak evidence that progress improved around that time:26
3. Discussions of a few cases. The text of the review asserts timing-based arguments for the impact of ITNs in Rwanda, Gambia, Zambia and Sao Tome, though it also lists multiple cases in which the observed decline in malaria appeared specifically not to be attributable to ITNs.27
The paper also lists significant caveats to its analysis:28
We must bear in mind the limitations in using published scientific literature to assess the progress of ongoing malaria control programmes. Some of the reports in this Review might be biased towards presenting data that reflect well on the outcome of a control programme (to justify investments) or even presenting data that suggest the malaria burden is worsening (to encourage further investment into malaria control); maintenance of the status quo is unlikely to result in publication in the scientific literature. For example, three studies from Kenya show exciting reductions in the burden of malaria, but data from 17 hospitals reveal that there are many areas where malaria is not declining. Many of the reports we have reviewed are limited in time and geographic scope, and therefore might not accurately reflect nation-wide trends. Most of these reports rely on clinical diagnosis of malaria at a health facility. We cannot account for the effect of changes in access to care or use of health services on incidence measured at the facility.
The authors additionally note:29
On the basis of current models of malaria transmission, we would not expect partial coverage with ITNs and the introduction of ACTs to result in the substantial changes in malaria incidence seen in areas with moderate transmission. Alternative explanations for these changes should be considered.
After considering several other potential hypotheses, the authors to do not reach a firm conclusion about what might explain the large observed declines.
Other smaller-scale studies
- D'Alessandro et al. 1995, one of the five high-quality RCTs showing the effectiveness of ITNs discussed on our main page on the effectiveness of ITNs , was a study of a national ITN program in The Gambia.30
The study found a 25%, statisticially significant reduction in child mortality in the areas that received ITNs compared to the control.31
There are reasons to doubt the relevance of the study to national-level ITN distribution campaigns today. The study took place more than two decades ago in 1992,32 and it is possible that the researchers influenced the implementation of the national program within the research areas, since they were apparently responsible for randomizing the treatment vs. control areas.33
On the other hand, data from the study indicates that the researchers did not cause the intervention to be unusually rigorous. ITN usage was fairly low in the trial,34 and the intervention was undertaken by the Gambian government, not by the researchers.35 In addition, the intervention failed in one out of the five areas, perhaps partially due to low net usage.36
The authors claim that the areas they chose to study were fairly representative of the country as a whole, though they were not randomly chosen from all areas where the ITN program was carried out.37
On the whole, we believe that the study provides fairly strong evidence that the national program in The Gambia was successful, though we cannot rule out the possibility that the small number of sample sites were unrepresentative of impacts in other parts of the country. Furthermore, it is not clear how far the results from this one program can be generalized.
- The World Malaria Report states that country-level data varies in quality, creating obstacles to interpreting it. In addition to discussing country-level data, the report also cites ten smaller-scale studies that focus on smaller regions, but may collect more reliable data.38
Six match references from O'Meara et al. 2010, discussed in the previous section. Of the other four,
- Pardo et al. 2006 looks at a one-year (2004-2005) decrease in malaria cases on the Island of Bioko, an area covered by other studies discussed in O'Meara et al. 2010.
- Beiersman et al. 2011 compares 1999 and 2009 data from 8 villages in Burkina Faso and reports that (a) ITN use went from 22% to 73%; (b) its measure of malaria prevalence fell 22.8%.
- Okiro et al. 2011 reports that malaria admissions rose in four of five studied hospitals in Uganda between 1999-2009. (O'Meara et al. 2010 also includes a study describing an increase in malaria burden in Uganda over a different time period.)39
- Regarding the final study, the World Malaria Report writes, "An evaluation of malaria programmes in United Republic of Tanzania (mainland) from 1999 to 2010 found a 45% decline in the under-five mortality rate, and a 50% decline in severe anaemia prevalence in children 6–59 months of age following a 36-fold increase in ITN use among children under 5 years."40 The study is listed as "forthcoming" in the references and we were unable to find it.
- Steketee and Campbell 2010 pulls together data from studies, national survey data, and organization and country reports,41
and argues that the burden of malaria in many countries appears to have declined contemporaneously with malaria control scaleup efforts:42
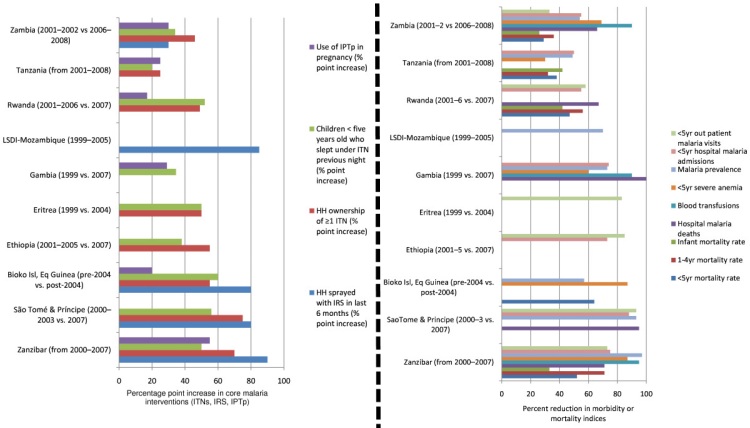
However, it provides little discussion of the question of whether such changes can be attributed to malaria control (or to particular aspects of malaria control). With the exception of a discussion of the Island of Bioko (also discussed in other sources that we examine above), it does not discuss patterns of malaria burden prior to scaleups in control efforts, and with the exception of a brief and informal discussion43 it does not address the possibility of alternative explanations for declines in malaria burden.
- Lim et al. 2011 analyzes country-level survey data,44 using regression analysis to find the protective efficacy of a household (or person's) use of an insecticide-treated net while attempting to adjust for other factors (such as malaria burden) that might affect this relationship.45 It concludes that nets have a substantial (real-world) protective effect.46 We are inclined to be skeptical of this study's findings because we doubt that the data and methods it used are sufficient to adjust for selection bias (we believe that people sleeping under nets are likely to be different from people not sleeping under nets in multiple ways that can't fully be captured in observable data).
Bottom line on the connection between ITN coverage and malaria burden
Available data and studies appear to show some cases of apparent malaria control success, and also seem to indicate that the overall burden of malaria in Africa is more likely to be falling than rising. However, in most cases it is difficult to link changes in the burden of malaria to particular malaria control measures, or to malaria control in general, and the data remains quite limited and incomplete, such that we cannot confidently say that the burden of malaria has been falling on average.
We can imagine that a malaria scholar, with more context than we have on the strengths and weaknesses of different data sets and the histories of malaria control in different areas, could have a higher degree of confidence in the idea that malaria control efforts (and ITNs in particular) have contributed to major declines in the burden of malaria.
Sources
- Beiersmann C et al. Falciparum malaria in young children of rural Burkina Faso: comparison of survey data in 1999 with 2009. Malaria Journal, 2011, 10:296. doi:10.1186/1475-2875-10-296.
- Cibulskis, Richard. Conversation with GiveWell (DOC), January 10, 2012.
- D'Alessandro et al. (1995). Mortality and morbidity from malaria in Gambian children after introduction of an impregnated bednet programme. Vol. 345, Issue 8948. doi:10.1016/S0140-6736(95)90582-0.
- GiveWell. Country-level charts of ITN coverage vs. malaria mortality (DOC).
- GiveWell. Tabulation of ITN coverage vs. malaria mortality (XLS).
- Lim et al. 2011. Net Benefits: A Multicountry Analysis of Observational Data Examining Associations between Insecticide-Treated Mosquito Nets and Health Outcomes. PLOS Medicine. http://www.plosmedicine.org/article/info%3Adoi%2F10.1371%2Fjournal.pmed…
- Murray, C. J. et al. (2012). Global malaria mortality between 1980 and 2010: a systematic analysis. The Lancet, 379(9814), 413-431.
- Okiro EA et al. Increasing malaria hospital admissions in Uganda between 1999 and 2009. BMC Medicine, 2011; 9: 37.
- O'Meara, Wendy Prudhomme et al. 2010. Changes in the burden of malaria in sub-Saharan Africa. Lancet Infectious Diseases 10(8): 345-355. Full text available with free registration www.thelancet.com/journals/laninf/article/PIIS1473-3099(10)70096-7/ (accessed November 25, 2011). Archived by WebCite® at http://www.webcitation.org/68LpzLNdQ.
- Pardo G et al. Impact of different strategies to control Plasmo dium infection and anaemia on the island of Bioko (Equatorial Guinea). Malaria Journal, 2006, 5:10. doi:10.1186/1475-2875-5-10.
- Steketee and Campbell 2010. http://www.malariajournal.com/content/9/1/299
- World Health Organization. Profiles: 31 high-burden countries (2009) (PDF).
- World Health Organization. World malaria report (2010) (PDF).
- World Health Organization. World malaria report (2011) (PDF).
- World Health Organization. World malaria report (2012) (PDF).
- 1
World Health Organization, "World Malaria Report (2011)," Pgs 15 and 27.
- 2
Using Google Scholar, we searched for any reviews of malaria prevalence in sub-Saharan Africa published in 2013. We also searched for "systematic review" within the papers citing some of the publications that most informed our original page: the World Malaria Report 2011, O'Meara 2010, and Steketee and Campbell 2010.
We found the following relevant reviews:
- Fullman, N., Burstein, R., Lim, S. S., Medlin, C., & Gakidou, E. (2013). Nets, spray or both? The effectiveness of insecticide-treated nets and indoor residual spraying in reducing malaria morbidity and child mortality in sub-Saharan Africa. Malaria journal, 12(1), 62.
- Korenromp, E. L., Hosseini, M., Newman, R. D., & Cibulskis, R. E. (2013). Progress towards malaria control targets in relation to national malaria programme funding. Malaria journal, 12(1), 18.
- Cohen, J. M., Smith, D. L., Cotter, C., Ward, A., Yamey, G., Sabot, O. J., & Moonen, B. (2012). Malaria resurgence: a systematic review and assessment of its causes. Malar J, 11(1), 122.
- Tusting, L. S., Willey, B., Lucas, H., Thompson, J., Kafy, H. T., Smith, R., & Lindsay, S. W. (2013). Socioeconomic development as an intervention against malaria: a systematic review and meta-analysis. The Lancet.
- 3
The 2012 World Malaria Report's assessment of changes in the malaria burden in Africa is very similar to the 2011 report (see Table 7.5 from the 2011 report, discussed in "Evidence from country level data" below; see Table R.1 on page 66 of the 2012 report). In particular, both reports emphasize that the national-level data that they draw on is too poor to draw conclusions about change in malaria prevalence for most countries. The 2012 report uses the exact same list of guidelines for assessing trends in malaria incidence as the 2011 Report (see "Evidence from country level data" below for the 2011 Report guidelines; see pages 64 and 65 of the 2012 Report for its guidelines).
In general, poor data quality makes new analyses of malaria prevalence in sub-Saharan Africa presented in the 2012 report hard to interpret. For example, Figure 8.9 on page 61 of the 2012 report seems to show that malaria decline in African countries is directly related to investment in control, but "the estimated numbers of cases and deaths in Africa are derived from a model which relies on changes in intervention coverage to predict changes in case incidence and mortality rates." Pg 62. Since the model appears to assume the impact of malaria control, it cannot be used as evidence of that impact.
The other papers that we have reviewed since initial publication of this page have also not substantially changed our views:
- Fullman et al. 2013 uses similar data sources and analysis techniques to Lim et al. 2011 (discussed below in "Other Smaller-Scale Studies" ). However, it is less focused on ITNs than Lim et al. 2011 and thus less relevant.
- Korenromp et al. 2013 explores the relationship between spending on malaria control and reductions in malaria prevalence, but only for countries outside of sub-Saharan Africa. The data presented on sub-Saharan Africa speaks only to inputs, not to health outcomes.
- Cohen et al. 2012 shows a linkage between cessation of control efforts and malaria resurgence in countries outside of sub-Saharan Africa. The data on sub-Saharan Africa refers only to experts' opinions on the causes of resurgence and does not make a convincing case that resurgence is often caused by slackening of control efforts.
- Tusting et al. 2013 argue that general socioeconomic development causes malaria rates to drop. We find this conclusion intuitively very likely on the basis of the lower rates of malaria mortality in more-developed countries vs. less-developed countries, so this paper does not materially affect our view.
We did update the page by incorporating the section on continent-level data and discussing D'Alessandro et al. 1995.
- 4
-
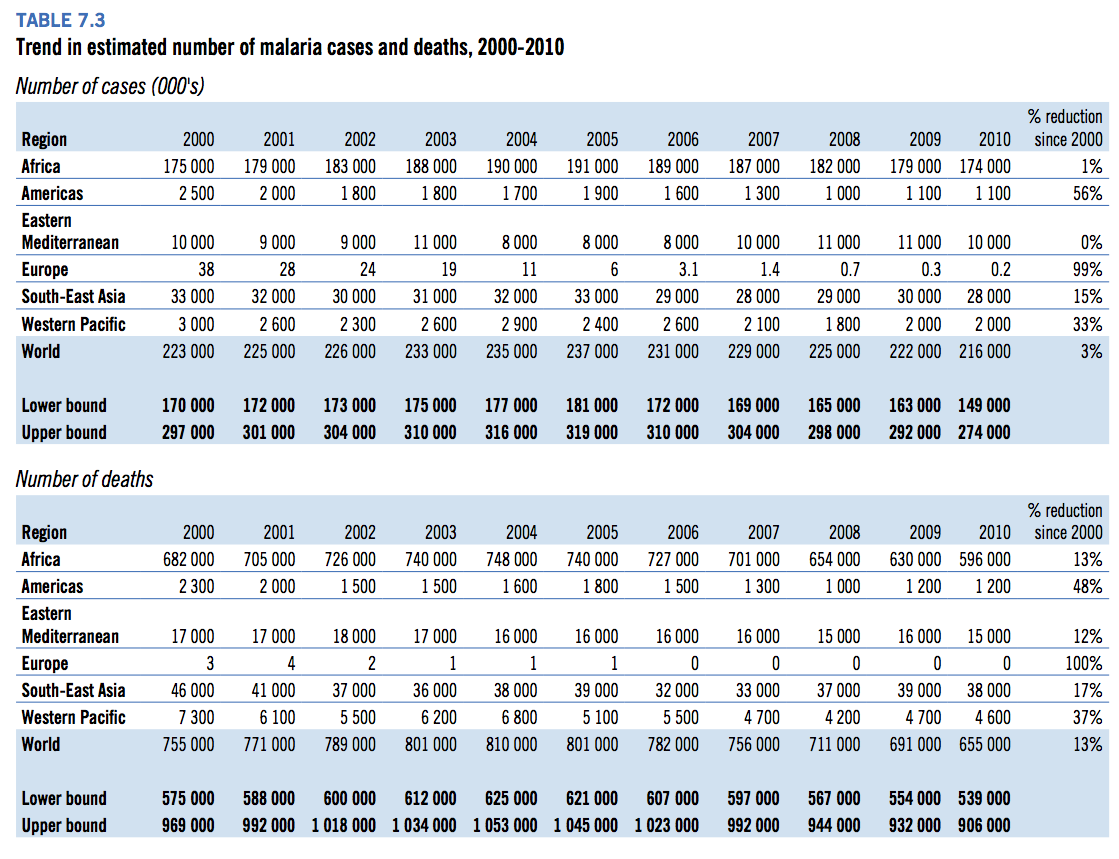
World Health Organization 2011, Table 7.3, Pg. 74. - "Malaria deaths in African children younger than 5 years increased by about three times from 377,000 ([95% uncertainty interval] 182,000–602,000) in 1980 to a peak of 1,047,000 (716,000–1,479,000) in 2004. Accelerated decreases in the past 5 years translate into 699,000 (415,000–1,112,000) deaths in 2010. Malaria deaths in individuals aged 5 years or older in Africa show a similar pattern with deaths increasing from 116,000 (62,000–230,000) in 1980 to 569,000 (422,000–867,000) in 2006. Since 2006, malaria deaths in those aged 5 years or older in Africa have also decreased at a similar rate to deaths in children younger than 5 years; in 2010 there were 435,000 (307,000–658,000) malaria deaths in those aged 5 years or older in Africa." Murray et al. 2012, Pg 421.
-
- 5

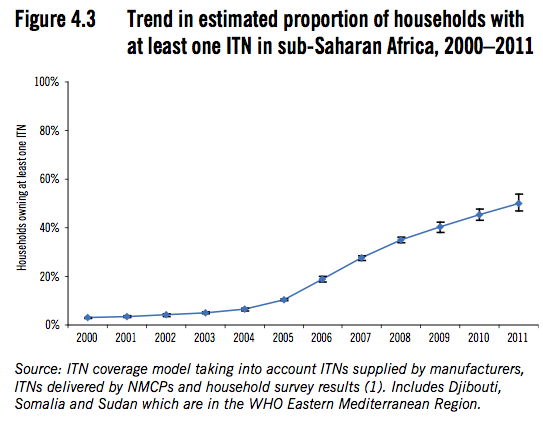
World Health Organization 2011, fig 3.1, pg 15; fig. 4.3, Pg 28.
- 6
In the figures presented in the last footnote, the malaria control scale-up seems to start sometime between 2002 and 2005, but does not hit its peak until considerably later.
- 7
- World Health Organization 2011, Table 7.3, Pg. 74.
- "Malaria deaths in African children younger than 5 years increased by about three times from 377,000 ([95% uncertainty interval] 182,000–602,000) in 1980 to a peak of 1,047,000 (716,000–1,479,000) in 2004. Accelerated decreases in the past 5 years translate into 699,000 (415,000–1,112,000) deaths in 2010. Malaria deaths in individuals aged 5 years or older in Africa show a similar pattern with deaths increasing from 116,000 (62,000–230,000) in 1980 to 569,000 (422,000–867,000) in 2006. Since 2006, malaria deaths in those aged 5 years or older in Africa have also decreased at a similar rate to deaths in children younger than 5 years; in 2010 there were 435,000 (307,000–658,000) malaria deaths in those aged 5 years or older in Africa." Murray et al. 2012, Pg 421.
- 8
"Child malaria deaths were estimated using a verbal autopsy multi-cause model (VAMCM) developed by the WHO Child Health Epidemiology Reference Group (CHERG) to estimate causes of death for children aged 1–59 months in countries with less than 80% of vital registration coverage. The VAMCM is a revised model based on work described elsewhere (20, 21). The VAMCM derives mortality estimates for malaria, as well as 7 other causes (pneumonia, diarrhea, congenital malformation, other neonatal causes, injury, meningitis, and other causes) using multinomial logistic regression methods to ensure that all 9 causes are estimated simultaneously with the total cause fraction summing to 1. The regression model is first constructed using the study-level data and then populated with year 2000–2010 country-level input data to provide time-series estimates of causes of death in children aged 1–59 months. Deaths were retrospectively adjusted for coverage of ITNs and use of Haemophilus influenzae type b vaccine. The bootstrap method was employed to estimate uncertainty intervals by re-sampling from the study-level data to estimate the distribution of the predicted percent of deaths due to each cause." World Health Organization 2011, Pg 73.
- 9
"Estimates differing from those calculated by WHO in 2011 (1) have been published this year by Murray et al (2). Wide uncertainty ranges accompany both sets of estimates, and with one exception – for deaths in people older than 5 years in Africa – these ranges overlap, so that in most settings the estimates cannot be regarded as significantly different (Figure Box 8.2). Finding a large number of malaria deaths in people older than 5 years in Africa, relative to those younger than 5 years, is unexpected in stable endemic areas, since partial immunity to malaria generally develops at an early age and protects most older children and adults against severe disease and death. In Africa, much lower adult-to-child death ratios have been found when the cases had been confirmed microscopically (3). Moreover, the proportion of malaria deaths occurring over 50 years of age has been observed to be considerably smaller in a wide range of settings (4). Verbal autopsy, which was used to assign cause of death in children in Africa in both sets of estimates for children, and for all ages in the Institute for Health Metrics and Evaluation (IHME) estimates is an imprecise estimator of malaria mortality since it cannot distinguish severe malaria from other severe febrile illnesses." World Health Organization 2012, pg 59.
- 10
World Health Organization, "World Malaria Report (2011)," Chapter 7 - Pgs 51-78. Pgs 52-59 deal specifically with the African region (as the World Health Organization defines it).
- 11
- Central Africa: "While there was no evidence of any decrease in malaria cases or deaths in nationally reported data from Equatorial Guinea, the prevalence of childhood infection on the Island of Bioko dropped from 40% in 2004 to 22% in 2005 after the combined implementation of ITNs (44% of children slept under an ITN) and IRS (78% of houses sprayed) (3). In Gabon, a study carried out in the general hospital of Libreville found that the slide positivity rate decreased from 45% in 2000 to 15% in 2008. It was also reported that introduction of IPTp in Gabon was associated with a reduction of 84% in maternal P. falciparum infection between 2004 and 2006 (4). Such selective studies, however, do not allow general conclusions to be drawn about trends in malaria throughout the subregion.
"The percentage of the population potentially covered by ITNs delivered was high (>70%) in 2010 in Burundi, Central African Republic, the Democratic Republic of Congo and Equatorial Guinea (Fig.G). Of these countries, all except the Democratic Republic of Congo have at least moderately good access to ACTs (Fig.H). Although progress appears to have been made in delivering interventions within the subregion it has not been possible to evaluate the impact of these efforts because the quality of routinely collected data is generally poor, the parasitological confirmation rate is low, and there are few alternative sources of information such as population-based surveys or specific studies of the impact of interventions. Following substantial investments in malaria control in this subregion, greater emphasis needs to be placed on monitoring and evaluation." World Health Organization 2011, Pg 52.
- West Africa: "Between 2000 and 2010, the number of confirmed malaria cases in Algeria and Sao Tome and Principe, reported through their national surveillance systems, decreased by more than half (Figs.D, E). For all other countries in this subregion, attempts to evaluate malaria trends are based on time series of hospital admissions and deaths (Figs D, E, F) because there are few data on parasitologically confirmed malaria cases in health facilities. Cape Verde and Senegal (box 7.1C) have reported reductions in hospital admissions (Figs.D, E), and Guinea Bissau in hospital deaths, but in all other countries the numbers of admitted cases have been rising ( Figs. D, F). These striking upward trends are almost certainly due to improved reporting or access to health services, and as a result, cross-country comparisons of routinely collected data do not show a link between the coverage and the impact of interventions. In 2010, the number of ITNs delivered could potentially have protected more than half of the populations at high risk in Burkina Faso, Gambia, Guinea, Liberia, Mali, Mauritania, Sierra Leone, Senegal and Togo, and yet there is no evidence of reductions in malaria burden as reported through the routine health information system ( Fig.G).
"Apart from Senegal ( box 7.2), the strongest associations between interventions and impact are seen in data from two small island countries, Cape Verde and Sao Tome and Principe (Fig. e). The diagnostic testing effort in Sao Tome and Principe is high: the ABER exceeds 30% on average, far greater than in other countries in this subregion ( Fig.C). Cape Verde and Sao Tome and Principe both use IRS at high coverage, and in Sao Tome and Principe IRS is used together with ITNs. In addition, a more detailed evaluation in Sao Tome of malaria cases, admissions and deaths, and of malaria infection rates, has linked malaria decline to the intense use of IRS, ITNs and ACTs ( 5, 6).
"Two other special studies in Burkina Faso and Gambia have pointed to some additional successes in malaria control. In Gambia, a retrospective study carried out at four sites found reductions in the slide positivity rate, and in the proportions of hospital admissions and deaths due to malaria over the period 2003–2007 ( 7). And a malaria survey in a rural area of northwestern Burkina Faso reported a 27% decline in rates of parasitaemia in 2009 compared to 1999 following an increase in ITN coverage from 22% to 73% (8). Many more special studies of this kind are needed to gain a full understanding of the effects of malaria control in this and other African subregions. Continued strengthening of routine health information systems is also necessary." World Health Organization 2011, Pg 54.
- East Africa: "Between 2000 and 2010, malaria admissions to hospitals and health centres with inpatient services declined by more than half in Rwanda, United Republic of Tanzania (Zanzibar) and Zambia, but by smaller proportions in Eritrea, Ethiopia, Kenya, Madagascar and Mozambique ( Figs. D, E). The four remaining countries/ areas (the Comoros, Malawi, Uganda, United Republic of Tanzania (mainland) reported increases in malaria admissions (Figs. D, F). As could be expected, the trends in hospital deaths were similar to the trends in hospitalized cases ( Fig. d).
"The declines in malaria admissions and deaths seen in nationally aggregated hospital data are consistent with published studies of data from health facilities in Eritrea, Ethiopia, Rwanda, and United Republic of Tanzania (Zanzibar) (9,10,11). In coastal areas of Kenya (Kilifi, Msambweni), district hospitals have reported that malaria cases declined among all paediatric admissions by 8%–63% between 1999 and 2007 (12). The observed increase in malaria admissions in Uganda agrees with an independent study, which found that hospitalizations increased by 47%–350% between 1999 and 2009 in four of five health facilities studied (13). An evaluation of malaria programmes in United Republic of Tanzania (mainland) from 1999 to 2010 found a 45% decline in the under-five mortality rate, and a 50% decline in severe anaemia prevalence in children 6–59 months of age following a 36-fold increase in ITN use among children 5 years ( 14). During this period, climatic conditions favourable for malaria transmission persisted, and there were no additional sustained increase in other child survival interventions, suggesting that the improvements in child health indicators observed could be plausibly linked, at least in part, to the scale-up of malaria control activities.
"ITNs are the principal method of vector control in this subregion. A relatively high coverage of ITNs in Madagascar, Rwanda, and United Republic of Tanzania (mainland and Zanzibar, Fig.G) might explain why cases declined substantially between 2000 and 2010 (box 7.3 ). But this association has not been observed in the Comoros (Figs. F, G). Mozambique had the lowest reported coverage of ITNs and IRS, and yet malaria admissions were falling between 2007 and 2010. Deeper investigations are needed to understand these inconsistencies." World Health Organization 2011, Pg 56.
- Southern Africa: "Against the background of seasonal variations in malaria burden, Botswana, Namibia, South Africa and Swaziland reported significant declines in malaria cases over the decade 2000–2010, albeit with some fluctuations from year to year (Fig. e). Case reports from Zimbabwe have been inconsistent over the past decade, varying between a minimum of 34 000 and a maximum of 250 000 cases ( Fig. F). The increases since 2008 might be explained by improvements in diagnosis (both microscopy and RDTs). Whatever the explanation, it appears that malaria is not declining in Zimbabwe." World Health Organization 2011, Pg 58.
- Central Africa: "While there was no evidence of any decrease in malaria cases or deaths in nationally reported data from Equatorial Guinea, the prevalence of childhood infection on the Island of Bioko dropped from 40% in 2004 to 22% in 2005 after the combined implementation of ITNs (44% of children slept under an ITN) and IRS (78% of houses sprayed) (3). In Gabon, a study carried out in the general hospital of Libreville found that the slide positivity rate decreased from 45% in 2000 to 15% in 2008. It was also reported that introduction of IPTp in Gabon was associated with a reduction of 84% in maternal P. falciparum infection between 2004 and 2006 (4). Such selective studies, however, do not allow general conclusions to be drawn about trends in malaria throughout the subregion.
- 12
Pg 77. The table doesn't explicitly state that it refers to these years, but the graphic on the following page implies that it does.
- 13
"The reported numbers of malaria cases and deaths are used as core indicators for tracking the progress of malaria control programmes (the working definition of a case of malaria is considered to be “fever with parasites” (1)). The main sources of information on these indicators are the disease surveillance systems operated by ministries of health … Changes in the numbers of cases and deaths reported by countries do not, however, necessarily reflect changes in the incidence of disease in the general population, because: (i) not all health facilities report each month … When reviewing data supplied by ministries of health in malaria-endemic countries, the following strategy was used to minimize the influence of these sources of error and bias … Further description of the procedures used is provided in the World Malaria Report 2010. The aim is to exclude data-related factors, such as incomplete reporting or changes in diagnostic practice, as explanations for a change in the reported incidence of disease. Even so, trends in health facility data may not reflect changes in the entire community. The conclusion that trends inferred from health facility data reflect changes in the community has more weight if (i) the changes in disease incidence are large (ii) coverage with public health services is high and (iii) interventions that promote a reduction in cases, such as use of ITNs, are delivered throughout the community and not restricted to health facilities." World Health Organization 2011, Pgs 51-52.
- 14
"When reviewing data supplied by ministries of health in malaria-endemic countries, the following strategy was used to minimize the inluence of these sources of error and bias:
- Focusing on confirmed cases (by microscopy or RDT) to ensure that malaria, and not other febrile illnesses, are tracked. For high-burden countries in the WHO African Region, where little case confirmation is undertaken, the numbers of malaria admissions (inpatient cases) and deaths are reviewed because the predictive value of diagnosis undertaken for an admitted patient is considered to be higher than outpatient diagnosis based only on clinical signs and symptoms. In such countries, the analysis may be heavily inluenced by trends in se vere malaria rather than trends in all cases.
- Monitoring the number of laboratory tests taken. It is useful to measure the annual blood ex amination rate, which is the number of parasitological tests (by microscopy or RDT) undertaken per 100 people at risk per year, to ensure that potential diferences in diagnostic efort or completeness of reporting are taken into account. To discern decreases in malaria incidence, the annual blood examination rate should ideally remain constant or be increased.In countries progressively reducing their malaria endemicity, the population at risk also reduces, becoming limited to residual and new foci where malaria transmission is present, or where there is potentially a high risk due to receptivity. In addition, it is useful to monitor the percentage of suspected malaria cases that were examined with a parasite-based test. When reviewing the number of malaria admissions and deaths, the health facility reporting rate (the proportion of health facilities that report) should remain constant and should be high, i.e. > 80%.
- Monitoring trends in the malaria (slide or RDT) positivity rate. This rate should be less severely distorted by variations in the annual blood examination rate than trends in the number of conirmed cases.
- Monitoring malaria admissions and deaths. For high-burden African countries, when the number of malaria admissions or deaths is being reviewed, it is also informative to examine the percentage of admissions or deaths due to malaria, as this proportion is less sensitive to variation in reporting rates than the number of malaria admissions or deaths.
- Monitoring the number of cases detected in the surveillance system in relation to the total number of cases estimated to occur in a country. Trends derived from countries with high case detection rates are more likely to relect trends in the broader community. When examining trends in the number of deaths, it is useful to compare the total number of deaths occurring in health facilities with the total number of deaths estimated to occur in a country.
- Examining the consistency of trends. Unusual variation in the number of cases or deaths that cannot be explained by climate or other factors, or inconsistency between trends in cases and in deaths, can suggest deficiencies in reporting systems.
- Monitoring changes in the proportion of cases due to P. falciparum or the proportion of cases occurring in children < 5 years of age. While decreases in the incidence of P. falciparum malaria may precede decreases in P. viva x malaria, and there may be a gradual shift in the proportion of cases occurring in children < 5 years, unusual luctuations in these proportions may point to changes in health facility reporting or to errors in recording.
The aim of these procedures is to rule out data-related factors, such as incomplete reporting or changes in diagnostic practice, as explanations for a change in the incidence of disease and to ensure that trends in health facility data relect changes in the wider community. The conclusion that trends inferred from health facility data relect changes in the community has more weight if: (i) the changes in disease incidence are large, (ii) coverage with public health services is high, and (iii) interventions promoting change, such as use of ITNs, are delivered throughout the community and not restricted to health facilities." World Health Organization 2010, Pgs 39-40.
- 15
World Health Organization 2011, Pg 125.
- 16
World Health Organization 2011, Pg 183.
- 17
World Health Organization 2011, Pgs 81-184.
- 18
" When we try to judge the reliability of the data, overall, in terms of assessing trends, we try to focus on confirmed malaria cases - we don't consider the "presumed fevers" as malaria. We try to make sure the diagnostic effort is consistent - the number of patients tested is reasonably consistent over time. We try to look at subnational data. We also do a cross check between admissions for malaria and reported deaths and we look for inconsistencies; if there are inconsistencies we make queries; if we can't resolve them we may decide the data is inconclusive. We also get informal evidence about the quality of the surveillance systems over time. I know certain countries very well, while other colleagues know others and we also have a sense of whether the data can be trusted or not. So there are some judgment calls … In most cases the assessment of trends is quite straightforward but there are a few borderline cases in which a decision needs to be made one way or another. We try to be on the conservative side; if there's any room for doubt we say there is insufficient evidence. We do take notes, but it would probably be difficult to recover the precise chain of thought that went into every decision." Cibulskis 2012.
- 19
See charts for Namibia (World Health Organization 2011, pg. 145) and Rwanda (World Health Organization 2011, pg. 157).
- 20
From World Malaria Report 2011, Pgs 52-56.
- "While there was no evidence of any decrease in malaria cases or deaths in nationally reported data from Equatorial Guinea, the prevalence of childhood infection on the Island of Bioko dropped from 40% in 2004 to 22% in 2005 after the combined implementation of ITNs (44% of children slept under an ITN) and IRS (78% of houses sprayed) (3). In Gabon, a study carried out in the general hospital of Libreville found that the slide positivity rate decreased from 45% in 2000 to 15% in 2008. It was also reported that introduction of IPTp in Gabon was associated with a reduction of 84% in maternal P. falciparum infection between 2004 and 2006 (4)"
- "Two other special studies in Burkina Faso and Gambia have pointed to some additional successes in malaria control. In Gambia, a retrospective study carried out at four sites found reductions in the slide positivity rate, and in the proportions of hospital admissions and deaths due to malaria over the period 2003–2007 ( 7). And a malaria survey in a rural area of northwestern Burkina Faso reported a 27% decline in rates of parasitaemia in 2009 compared to 1999 following an increase in ITN coverage from 22% to 73% (8). Many more special studies of this kind are needed to gain a full understanding of the effects of malaria control in this and other African subregions"
- "The declines in malaria admissions and deaths seen in nationally aggregated hospital data are consistent with published studies of data from health facilities in Eritrea, Ethiopia, Rwanda, and United Republic of Tanzania (Zanzibar) (9,10,11). In coastal areas of Kenya (Kilifi, Msambweni), district hospitals have reported that malaria cases declined among all paediatric admissions by 8%–63% between 1999 and 2007 (12). The observed increase in malaria admissions in Uganda agrees with an independent study, which found that hospitalizations increased by 47%–350% between 1999 and 2009 in four of five health facilities studied (13). An evaluation of malaria programmes in United Republic of Tanzania (mainland) from 1999 to 2010 found a 45% decline in the under-five mortality rate, and a 50% decline in severe anaemia prevalence in children 6–59 months of age following a 36-fold increase in ITN use among children under 5 years (14). During this period, climatic conditions favourable for malaria transmission persisted, and there were no additional sustained increase in other child survival interventions, suggesting that the improvements in child health indicators observed could be plausibly linked, at least in part, to the scale-up of malaria control activities."
- 21
"There have been some broad evaluations done as well. One was done by Steve Lim and colleagues published in PLos Med in 2011. Others by Rick Steketee, published in the Malaria Journal in 2010 and O'Meara and others in the Lancet in 2010. The Lim paper came up with effects of ITNs comparable to those seen in randomized controlled trials." Cibulskis 2012.
- 22
O'Meara et al. 2010, abstract.
- 23
"We searched the National Library of Medicine’s Medline database with the Medical Subject Headings 'Africa South of the Sahara', 'Malaria/epidemiology', 'Malaria/mortality', 'Malaria/prevention and control', and 'Malaria/transmission', omitting papers that contained the keywords 'Malaria/immunology'. The search was limited by restricting retrieval to articles published in the past 10 years. Our last search was done on March 29, 2010. The search identified 1528 publications. Articles were included if they reported at least 2 years of data on malaria-specific indicators (clinical or slide diagnosed case numbers, incidence, prevalence, or malaria-specific mortality) in a population of more than 1000 people. Cross-sectional studies reporting a single timepoint, those involving only pregnant women, intervention studies covering 1 year or less of follow-up, and entomological studies without any clinical or parasitological components were excluded. Also excluded were studies published in the selected time frame but which did not report data from the period 1999–2009. The titles for each citation were screened and 297 were selected for review of their abstracts. Screening of the abstracts yielded 82 publications for full review. After reviewing the full texts, 46 studies that fully met the inclusion criteria were identified." O'Meara et al., Pg 553.
- 24
- 25
The authors note, “Many reports attribute decreases in malaria morbidity to specific interventions, although the causal link between the decline and the intervention is more convincing in some cases than in others (figure 3). In several reports, the decline began before the specific intervention was deployed, or the decline was already underway at the beginning of the study period, suggesting that factors not investigated contributed to the decline. This is highlighted in the two reports from the coast of Kenya, one of which shows an association between ITN distribution and a decline in admissions of children with malaria to hospital whereas the other shows substantial changes in prevalence of malaria infection before the decline in admissions and the distribution of ITNs. Similarly, in The Gambia and Zanzibar, the decline in malaria began before ITNs were rolled out. In Eritrea and Ethiopia, a substantial outbreak occurred from late 2002 to 2005, 60 thus declines in malaria incidence back to historical levels were already underway as interventions were introduced in 2005 and 2006. In other reports, the temporal association with the introduction of specific interventions is compelling, particularly in the data from the northern provinces of South Africa and Bioko Island.” Pgs 551-552.
- 26
Note that in the figure legend but not in the figure, the descriptions of "unchanged" and "improving" were accidentally swapped.
- 27We list quotes that discuss either an implied failure of control (malaria burden holding steady or rising), an implied success of LLINs/vector control, or a case in which malaria burden declined in a way that was not clearly attributable to LLINs. We do not list quotes that simply discuss cases in which malaria burdens fell, without discussing the timing of control measures. All quotes from O'Meara et al. 2010.
Instances in which there was a decline in malaria burden, but not one whose timing suggests a strong role for LLINs:
- Bioko: "The Bioko Island Malaria Control Project was launched in 2003 and combined bi-annual indoor residual spraying programmes with the introduction of ACTs and scale-up of the use of intermittent preventive treatment in pregnancy. Distribution of long-lasting insecticidal bednets started much later, in 2007. After 4 years of intensive vector control and improved case management, sporozoite rates were reduced by ten times, leading to a decline in cross-sectional prevalence of malaria parasitaemia in children from 42% to 18%, and a 50% reduction in the prevalence of fever. A remarkable 70% reduction in all-cause mortality in children age less than 5 years was reported in this intervention time interval." Pgs 550-551.
- Burundi: "In neighbouring Burundi, routine health-facility reporting from the Karuzi province showed an epidemic peak of clinically diagnosed malaria in 2001, against a background of low but stable monthly incidence ofcases.Between 2002 and 2005, annual indoor residual spraying interventions in the province had only a small eff ect on parasite prevalence.Prevalence in children less than 9 years old declined from 64% to 40%, but the latter fi gure was not always signifi cantly diff erent from the control group over the 3 years of intervention. No additive benefit of bednets could be detected, and indoor residual spraying in the lowland areas did not reduce prevalence of infection in adjacent highlands." Pg 547.
- Ethiopia: " Surveillance from 2000–07 demonstrated a 70% reduction in both outpatients with slide-confi rmed malaria and children less than 5 years old admitted to hospital for malaria. Outpatient malaria cases were already declining at the beginning of the surveillance period, before mass-distribution of ITNs and treatment with ACTs were introduced in late 2005." Pg 546.
- Eritrea: "Reports from Eritrea paint a similar picture … Between 1998 and 2004, substantial reductions in routinely reported clinical malaria cases were described following a scale-up of control measures … It is very likely that the massive scale-up of ITNs, indoor residual spraying, community-based management of fevers, and environmental management of mosquito breeding sites all contributed to these results. However, the incidence of malaria was already declining at the beginning of the surveillance period, before these interventions were introduced. Graves and colleaguesshowed that malaria cases increased between 1996 and 1998 before beginning to decline in 1999; although the increase in cases could have been due to improved reporting practices. A time-series analysis by Nyarango and co-workers showed that the scale-up of ITNs and indoor residual spraying was associated with a reduction in malaria cases but not with a decline in case fatality, whereas an expansion of community health-worker training was temporally associated with the decline in case fatality but not with the reduction in malaria cases." Pg 546.
- Coastal Kenya: " Since the mid-1990s, parasite prevalence in the Kilifi district has declined progressively from 35% to less than 1%. Prevalence declined by 30% before any change in the incidence of malaria admissions was recorded. Although ITN use has increased concurrently with the decline in paediatric admissions,12 the prevalence of malaria infection declined from 35% to 10% before ITN coverage reached 25%, and before the introduction of ACTs." Pg 546.
- Highland Kenya: "More recent data from a few villages in highland Kenya show success of government efforts to control malaria. Malaria incidence declined from roughly 100 cases per 1000 people per year in 2003 to no cases at all in 2008.Because ITN coverage was less than 25%, this success is probably attributable to sequential rounds of indoor residual spraying covering 70–95% of households." Pg 549.
- Zanzibar: "On Zanzibar, an 87% decline in parasite prevalence was mirrored by a 75% decline in clinically diagnosed malaria outpatient visits and hospital admissions. Review of monthly clinical cases of malaria in children less than 5 years of age showed that the downward trend began about 1 year after the introduction of ACTs, and before the widespread distribution of ITNs. The number of cases dropped from more than 1500 per month to fewer than 100 per month before the initiation of ITN distribution campaigns. Changes in diagnostic practices might have had an effect on these figures. The timing of the decline (2005 to 2006) is similar to that of other reports from the region." Pg 550.
Instances in which there was a decline in malaria burden whose timing does suggest a strong role for LLINs:
- Rwanda: “In Rwanda, data from 20 facilities representing every district in the country showed a decline of more than 50% between 2005 and 2007 in both inpatient and outpatient slide-confirmed malaria cases.6 Before 2005, the number of cases had been increasing annually, but began to decline shortly before or at the same time as mass distribution of long-lasting insecticidal bednets and the use of ACTs in 2006–07.”
- The Gambia: “Compelling evidence for a dramatic decline in malaria transmission comes from The Gambia where surveillance at five health facilities across the country showed a 50–85% decline in the prevalence of slide-confirmed malaria among outpatients and a 25–90% decline in malaria-related hospital admissions.47 The trend persisted over 7 years with an apparent contribution from ITN coverage, which increased three-fold to 49% over the surveillance period. The observed reductions were before the introduction of ACTs. The number of outpatient cases declined before the number of inpatient cases did.”
- Sao Tome: "On Sao Tome, surveillance data between 1995 and 2007 showed malaria outpatient consultations and hospital admissions declined by 80–90% in both adults and children after introduction of indoor residual spraying, ACTs, and long-lasting insecticidal bednets in 2004. Indoor residual spraying on Sao Tome resulted in a reduction of paediatric parasite prevalence from 30% to less than 1%, a greater reduction than indoor residual spraying programmes in Burundi, where prevalence fell from 50% to 40%, and in Mozambique, where prevalence fell from 65% to 20%." Pg 551
- Zambia: “The Zambian National Malaria Control Programme has achieved substantial success in scaling up the use of ITNs, indoor residual spraying, and intermittent preventive treatment in pregnancy with sulphadoxine plus pyrimethamine. ITN ownership increased substantially from 22% in 2004, to 38% in 2006, and 62% in 2008.43,44 Between 2006 and 2008, paediatric malaria parasite prevelance declined by 53% and moderate to severe anaemia by 69%.44 A report from a single outpatient facility showed a remarkable decline in the proportion of febrile cases with malaria, from 40% in 2003 and 84% in 2004 to less than 1% in 2008.45”
Elsewhere, however, the authors note elsewhere that, “in The Gambia and Zanzibar, the decline in malaria began before ITNs were rolled out.”
- 28
O'Meara et al. 2010, Pg 553.
- 29
O'Meara et al. 2010, Pg 553.
- 30
"...the Government of The Gambia, with support from WHO, initiated a National Insecticide Impregnated Bednet Programme (NIBP) with the objective of introducing this form of malaria control into all large villages in The Gambia over a 2-3 year period. The UK Medical Research Council laboratories were asked to evaluate the impact on childhood mortality and malaria morbidity in order to determine whether the results achieved in the controlled trial could be reproduced in a nationwide programme." Pg. 479.
- 31
"Overall, a 25% reduction in mortality in children aged 1-9 years (p = 0.04) was seen in treated villages (table 3)." Pg. 481.
- 32
"In June-July, 1992, the NIBP was implemented in about half (221) of the PHC villages." Pg. 480.
- 33
"At the beginning of 1991, five areas were chosen as sentinel sites (figure 1) to reflect the varied cultural and ecological settings within The Gambia.7 Within these areas, 104 PHC villages were identified and the project was discussed with villagers. The villages were then paired by size (1983 national census) within each area. The intervention was implemented in one randomly chosen village in each pair (treated village) in June-July, 1992, and in the other the following year. A census of the villages under surveillance was done in March-May, 1992. During the census, the numbers of children born and children surviving were collected from women of reproductive age, and the number of beds with hanging nets recorded." Pg. 480.
- 34
"...it is likely that in treated villages only about 60% of children 1-4 years old slept under a treated net, a figure well below that found in the controlled trial." Pg. 482.
- 35
"In 1981, The Gambian Government initiated a national Primary Health Care (PHC) programme; all villages with a population of 400 or more were invited to join the scheme. Each participating village selected a village health worker and a traditional birth- attendant who received 6 and 8 weeks’ training, respectively. In June-July, 1992, the NIBP was implemented in about half (221) of the PHC villages. Dipping of bednets was organised by Regional Health Teams and done by a village health worker assisted by a traditional birth-attendant and the head of the women’s group, supervised by community health nurses. Before the intervention, people were asked to wash their nets. 40 mL insecticide (20% permethrin) needed to treat each net was poured into a large plastic bowl and 2 litres of water added to give a permethrin concentration on nets of about 200mg/m2." Pg. 480.
- 36
"The intervention was not successful in area 5, particularly in children 1-2 years old. No evidence of insecticide resistance was found but, in the pre- intervention year, area 5 had the highest entomological inoculation rate, mainly because of the very high sporozite rate in A gambiae in this area.7 A subsequent observational study (unpublished) has shown low usage of nets by children in this area. These two factors may partly explain the lack of impact on mortality and morbidity in area 5." Pgs. 482-3.
- 37
"At the beginning of 1991, five areas were chosen as sentinel sites (figure 1) to reflect the varied cultural and ecological settings within The Gambia. Within these areas, 104 PHC villages were identified and the project was discussed with villagers. The villages were then paired by size (1983 national census) within each area. The intervention was implemented in one randomly chosen village in each pair (treated village) in June-July, 1992, and in the other the following year." Pg. 480.
- 38
From World Malaria Report 2011:
- "While there was no evidence of any decrease in malaria cases or deaths in nationally reported data from Equatorial Guinea, the prevalence of childhood infection on the Island of Bioko dropped from 40% in 2004 to 22% in 2005 after the combined implementation of ITNs (44% of children slept under an ITN) and IRS (78% of houses sprayed) (3). In Gabon, a study carried out in the general hospital of Libreville found that the slide positivity rate decreased from 45% in 2000 to 15% in 2008. It was also reported that introduction of IPTp in Gabon was associated with a reduction of 84% in maternal P. falciparum infection between 2004 and 2006 (4)" Pg 52.
- "Two other special studies in Burkina Faso and Gambia have pointed to some additional successes in malaria control. In Gambia, a retrospective study carried out at four sites found reductions in the slide positivity rate, and in the proportions of hospital admissions and deaths due to malaria over the period 2003–2007 ( 7). And a malaria survey in a rural area of northwestern Burkina Faso reported a 27% decline in rates of parasitaemia in 2009 compared to 1999 following an increase in ITN coverage from 22% to 73% (8). Many more special studies of this kind are needed to gain a full understanding of the effects of malaria control in this and other African subregions" Pg 54.
- "The declines in malaria admissions and deaths seen in nationally aggregated hospital data are consistent with published studies of data from health facilities in Eritrea, Ethiopia, Rwanda, and United Republic of Tanzania (Zanzibar) (9,10,11). In coastal areas of Kenya (Kilifi, Msambweni), district hospitals have reported that malaria cases declined among all paediatric admissions by 8%–63% between 1999 and 2007 (12). The observed increase in malaria admissions in Uganda agrees with an independent study, which found that hospitalizations increased by 47%–350% between 1999 and 2009 in four of five health facilities studied (13). An evaluation of malaria programmes in United Republic of Tanzania (mainland) from 1999 to 2010 found a 45% decline in the under-five mortality rate, and a 50% decline in severe anaemia prevalence in children 6–59 months of age following a 36-fold increase in ITN use among children less than five years of age (14). During this period, climatic conditions favourable for malaria transmission persisted, and there were no additional sustained increase in other child survival interventions, suggesting that the improvements in child health indicators observed could be plausibly linked, at least in part, to the scale-up of malaria control activities." Pg 56.
- 39
"In contrast to the largely encouraging reports from Kenya and Rwanda, data from a highland and a lowland area in western Uganda showed steadily increasing numbers of malaria cases and deaths in district hospitals from 1991 to 2000, with a two-fold to four-fold overall increase in the number of children admitted to hospital with the disease. A slight decline in the proportion of positive blood films was seen in a single facility in an area of moderate transmission in Uganda after one round of indoor residual spraying in 2007. 14 months after indoor residual spraying, the proportion of blood films that tested positive began to increase, suggesting that trends are easily reversed if control measures are not sustained." O'Meara et al. 2010, Pgs 547-8.
- 40
World Health Organization 2011, Pg 56.
- 41
"National survey data, published literature, and organization or country reports produced during 2000-2009 were reviewed to assess available malaria financing, intervention delivery, household or target population coverage, and reported health benefits including infection, illness, severe anaemia, and death." Steketee and Campbell 2010, Abstract.
- 42
Steketee and Campbell 2010, Figures 5 and 6.
- 43
"Factors that could offer alternative explanations for the suggested link between malaria control scale-up and malaria morbidity and mortality reductions might include: 1) variations in rainfall and temperature; 2) broad socio-economic change; 3) changing HIV conditions; 4) other child health interventions discussed previously that might account for the differences; and/or 5) biologic changes in the malaria-vector-human cycle that is making malaria infection and illness less virulent. Many of the studies address and account for rainfall and temperature patterns and demonstrate that these are not plausible explanations of marked reductions in malaria during this time interval in most African countries. In Ethiopia, weather patterns are thought to have contributed to a substantial malaria epidemic from 2003 through 2005, so some of the findings there may be accounted for by this earlier period with high malaria as a comparison time for more recent scale-up and impact; however, this is not the case for other country settings. Some socio-economic change certainly occurred in Bioko Island with the growth of the oil industry, and improved copper prices in the 2005 through 2008 interval may have contributed indirectly in Zambia--but again, such socio-economic improvements occur in many countries but are not likely to explain the dramatic reduction in childhood mortality documented in the setting of SUFI. HIV rates have not dropped consistently across these countries, but improved treatment with anti-retroviral drugs may have contributed partially to the improved child survival and reductions in fever and malaria incidence and prevalence." Steketee and Campbell 2010. Pgs 11-12.
- 44
"We considered all demographic and health surveys (DHS) and malaria indicator surveys (MIS) from sub-Saharan Africa countries conducted since 2000 for which the unit-record data were available. Prior to 2000, ITN ownership and use in sub-Saharan Africa was universally low [13]. We included only surveys that collected data on the health outcomes of interest (child mortality or parasitemia prevalence) as well as information on ITN ownership and use (including when the ITN was received or purchased, and when it was retreated) and all covariates specified in the analyses. We excluded the Ghana DHS conducted in 2003 as no child deaths were observed in the small number of households that owned ITNs. The results on the association between ITNs and child mortality are based on 29 DHS in 22 sub-Saharan African countries, while the results on the association between ITNs and parasitemia prevalence are based on 6 MIS and one DHS from seven sub-Saharan African countries." Lim et al. 2011. Pg 2.
- 45
"We used matched logistic regression to assess the individual-level association between household ITN ownership or use in children under 5 years of age and the prevalence of parasitemia among children using six malaria indicator surveys (MIS) and one demographic and health survey. We used Cox proportional hazards models to assess the relationship between ITN household ownership and child mortality using 29 demographic and health surveys." Lim et al. 2011. Pg 2.
- 46
"The pooled relative reduction in parasitemia prevalence from random effects meta-analysis associated with household ownership of at least one ITN was 20% (95% confidence interval [CI] 3%–35%; I2 = 73.5%, p0.01 for I2 value). Sleeping under an ITN was associated with a pooled relative reduction in parasitemia prevalence in children of 24% (95% CI 1%–42%; I2 = 79.5%, p0.001 for I2 value). Ownership of at least one ITN was associated with a pooled relative reduction in mortality between 1 month and 5 years of age of 23% (95% CI 13–31%; I2 = 25.6%, p>0.05 for I2 value)." Lim et al. 2011. Pg 6.