This page is an interim review. We have published a more recent version of this review here.
Living Goods is applying to be a 2014 top-rated charity. Here we discuss what we have learned so far and our major outstanding questions.
More information: What is our evaluation process?
Published: October 2014
Summary
What do they do? Living Goods runs a network of Community Health Promoters (CHPs) who sell health and household goods door-to-door in their communities in Uganda and Kenya and provide basic health counseling. Living Goods also provides consulting and funding to other organizations to run similar networks in other locations.
Does it work? The main evidence for Living Goods’ impact is a randomized controlled trial that found that the program caused a 25% reduction in under-5 mortality. The full details of this study are not yet publicly available. Living Goods collects ongoing monitoring data on various aspects of its programs; we have limited confidence in the quality of this data, which raises questions about our ability to learn about the impact of future work. We do not know how effective Living Goods’ work with its partners has been.
What do you get for your dollar? We estimate that Living Goods' cost per life saved will be roughly $11,000 in 2014-2016. Making assumptions that we would guess are particularly optimistic about Living Goods, we estimate the cost per life saved at about $3,300. Pessimistic assumptions lead to an estimate of $28,000 per life saved. Our work on this model is ongoing.
Is there room for more funds? Living Goods is seeking about $9 million per year for the next 4 years to scale up its program in Uganda, up from $3.3 million raised in 2013. It is currently in discussions with a number of its core funders who have expressed interest in backing the scale up. No funds have been committed at this stage. If all proposals to core funders are successful, Living Goods will have a gap of approximately $2 to 3 million per year. Living Goods is also seeking additional funding to co-fund partners to start networks in other countries.
What are GiveWell’s next steps? Living Goods is a contender for a GiveWell recommendation. We plan to continue our review process of Living Goods to try to answer our remaining questions.
Table of Contents
- Summary
- Why we are publishing this page
- Our investigation process
- What do they do?
-
Does it work?
- Do the products that CHPs sell improve health and save lives?
- What does the randomized controlled trial of Living Goods’ program say about its impact?
- What does Living Goods’ ongoing monitoring say about its impact?
- Has Living Goods’ work with partners had an impact on those projects and have those projects improved or saved lives?
- Do the products that CHPs sell provide economic benefits?
- Possible negative or offsetting impact
- What do you get for your dollar?
- Room for more funding?
- Major questions for further investigation
- Sources
Why we are publishing this page
As we mentioned in our plan for 2014, a key research priority for this year is actively pursuing investigations of promising charities. This page is intended to update our followers on Living Goods’ application and what we've learned so far.
Our investigation process
We first considered Living Goods in 2009 and noted that it stood out for subjecting its program to a rigorous evaluation. In 2012, we spoke with Living Goods to get an update on its work and its RCT (conversation notes). Living Goods told us at that time that the results from the RCT were not going to be reliable due to spillover of the intervention into control locations and incorrect matching of the treatment area and the treatment survey area – issues that reduce the statistical power of the study.1
In 2014, Living Goods informed us that the results of the RCT were available and that the effect on mortality was large enough to overcome the problems with statistical power. This year, we have spoken with Living Goods twice (notes from May 2014 here and forthcoming for July 2014) and reviewed documents that it sent us in response to our questions about the RCT, financial statements and budgets, product offerings and sales records, metrics reports, accuracy checks on CHP reports, CHP selection process, CHP dropout rates and profitability, and program performance.
We also met with Living Goods in September 2014 and have not yet incorporated what we learned during that meeting into this review. We plan to conduct a site visit to Living Goods' program in Uganda in October 2014 and then publish a final review for 2014 that incorporates additional information from the meeting, site visit, and documents.
Previous version of this page here.
What do they do?
Living Goods has two main activities:
- Running a network of agents who sell health and other products door-to-door in Uganda and Kenya and who provide some basic health services.
- Consulting with other organizations on issues related to running similar agent-based systems in other locations and funding some of these projects.
We discuss each of these more below.
Running a network of Community Health Promoters
Living Goods describes its network of agents as follows:2
Recruiting and training
Living Goods recruits new CHPs through referrals from existing CHPs, community groups, other NGOs, and religious and local leaders.3
Criteria for new CHPs include: ability to spend two hours per day on CHP activities, 25-45 years old with 7 or more years of schooling, active in her community, fluent in local language and able to read and communicate in basic English.4
Candidates are asked to complete an interview to test their communication skills and engagement,5
attend a two week training course in health and business, and pass a test at the end of the course. Training covers diagnosis, treatment, and recognizing danger signs that require referral to health facilities, as well as business and sales skills.6
Those who pass the test are required to invest about $30 in initial supplies; Living Goods offers 6-month loans to cover part of the investment.7 Living Goods provides CHPs with a “business-in-a-bag,” which includes uniforms and promotional materials, and a phone.8 Living Goods also provides ongoing in-service training for CHPs.9
Products
In Uganda, CHPs sell preventative health goods (fortified foods, mosquito nets, malaria prophylaxis, vitamins and minerals), treatments (malaria treatments, ORS and zinc, antibiotics, deworming pills, medicines for pain, coughing, and colds), reproductive health goods (delivery kits, menstrual pads, contraceptives), hygiene goods (soap, diapers, toothpaste, toilet paper), and household goods that Living Goods has selected because, in Living Goods’ words, they “have a proven economic benefit and may contribute to improved health” (cookstoves, solar lighting and power, water treatment), among other products.10
CHPs are expected to have medicines for diarrhea (ORS), pneumonia (amoxicillin), and malaria (ACTs) in stock at all times.11
The sales data Living Goods has shared with us is sales to CHPs, from Living Goods branches, rather than sales by CHPs to clients.12 Living Goods notes that both types of products offered and margins can change quickly13 – margins given are from July 2014 and may not reflect long-term trends. It is our understanding that "CHP margins" in the table below are those set by Living Goods; we don't know if they are followed in practice. Living Goods told us that it strongly discourages CHPs from selling at prices other than those set by Living Goods and that CHPs typically follow the price guidelines.14
Sales by product in Uganda between January 2011 and August 2014 (quantities/size per unit vary)15
| Product type | Sales (USD) | % of total sales | Units sold | Living Goods margins | CHP margins |
|---|---|---|---|---|---|
| Soap | $229,379 | 24.9% | 324,381 | 1-13% | 4-24% |
| Cookstoves | $204,434 | 22.2% | 51,843 | 0-25% | 11-31% |
| Fortified food | $89,109 | 9.7% | 243,718 | 4-19% | 6-11% |
| Malaria treatments | $65,760 | 7.1% | 93,284 | 23% | 33% |
| Solar lighting and power | $62,455 | 6.8% | 3,041 | -40-30% | 2-46% |
| Delivery kits | $57,137 | 6.2% | 18,115 | 20% | 10% |
| Diapers | $36,027 | 3.9% | 16,771 | 10% | 9% |
| Pain, cough & cold | $34,579 | 3.8% | 35,442 | 9-37% | 8-66% |
| Menstrual pads | $27,826 | 3.0% | 20,652 | 7-17% | 8-12% |
| Contraception | $25,673 | 2.8% | 42,327 | 20-33% | 28-44% |
| ORS and zinc | $13,829 | 1.5% | 74,419 | 10-26% | 7-33% |
| Deworming | $10,874 | 1.2% | 6,588 | 36% | 48% |
| Mosquito nets | $8,397 | 0.9% | 2,579 | 12-24% | 7-23% |
| Antibiotics | $8,190 | 0.9% | 6,990 | 25% | 44% |
| Other (e.g. vitamins and minerals, fuel, water treatment, toothpaste) | $47,817 | 5.2% | 97,303 | 0-75% | 5-100% |
| Total | $921,486 | 100.0% | 1,037,453 |
Living Goods’ program in Kenya is newer,16 smaller, and offers fewer products. CHPs in Kenya do not currently offer treatments, which are key to Living Goods’ goal of reducing child mortality. They do offer mosquito nets, fortified foods, contraceptives, and delivery kits, though these account for a small portion of sales to date. Living Goods told us that its focus in Kenya is on selling “durables that deliver proven economic impact” such as high-efficiency cookstoves and solar lights.17
Sales by product in Kenya between July 2013 and July 201418
| Product type | Sales (USD) | % of total sales | Units solds |
|---|---|---|---|
| Cookstoves | $29,780 | 56.5% | 2,155 |
| Solar lighting and power | $11,064 | 21.0% | 476 |
| Water filters | $3,196 | 6.1% | 598 |
| Menstrual pads | $1,578 | 3.0% | 1,095 |
| Business materials | $1,494 | 2.8% | 963 |
| Diapers | $1,447 | 2.7% | 386 |
| Fortified food | $1,349 | 2.6% | 15,384 |
| Other (e.g. fuel, contraception, delivery kits, mosquito nets) | $2,807 | 5.3% | 3,786 |
| Total | $52,715 | 100.0% | 24,843 |
Health services
In addition to going door-to-door selling products, CHPs are asked to:
- Provide households with advice on topics including nutrition, family planning, hygiene, and use of preventative tools such as bed nets, water treatment, clean stoves, and solar lights.19
- Evaluate the health of children in the household and diagnose illnesses, using the Integrated Community Case Management (ICCM) system.20
- Give their phone number to clients and respond to calls when asked to provide treatment.21
- Track pregnancies and make 2-3 visits during pregnancy to provide education and vitamins, check for risk factors, sell delivery kits, and encourage women to use health facilities for antenatal and delivery care. CHPs receive small financial incentives for registering pregnancies and making pre- and post-natal visits.22
- Visit mothers shortly after they give birth and once more in the first week to “ensure proper newborn care practices.”23
- Hold community events to provide health education, at least twice per month.24
Oversight
CHPs are overseen by Branch Managers. Branch Managers are expected to visit or talk to each CHP at least once per month25
and collect data from CHPs on pregnancy registrations, treatments provided to children under 5, and other activities.26
Based on these reports and sales records, Branch Managers are asked to rank CHPs, occasionally give bonuses to top performers, provide coaching to medium and low performers, and dismiss the lowest performers.27
Criteria for high performance includes over $63 of product purchases, 7 or more registered pregnancies, 13 or more malaria treatments and 6 or more diarrhea treatments per month.28
Field Supervisors are responsible for supervising Branch Staff and monitoring the performance of Living Goods branches. They are expected to be in touch with branch management daily and visit branches frequently to answer questions, listen to challenges, and help find solutions to problems. Living Goods looks for Field Supervisors that have backgrounds in sales, health education, and community outreach.29
Living Goods has also stated that it “uses randomized follow-ups to improve quality control and monitoring of treatments."30 We have not seen more information on this and Living Goods told us that it does not maintain records from these follow-ups.31
Partnerships
Living Goods has worked intensively with BRAC in Uganda and provided consulting services to PSI, The Clinton Foundation, and Marie Stopes International.32
BRAC partnership
Living Goods began, in 2008, as a partnership with BRAC to operate a network of CHPs in Uganda, and in 2009 launched a directly-managed network of CHPs using the same model.33
Living Goods has provided both technical and financial support, totaling over $2 million, to BRAC for the CHP program.34
It is our understanding that the BRAC- and Living Goods-managed programs operate similarly,35
though Living Goods notes some differences in focus (see footnote for details).36
The impact study discussed below includes both BRAC and Living Goods branches.
Other partnerships
As of 2014, Living Goods is actively working with one additional organization: PSI. It previously worked with PSI in Mozambique and is now working with PSI in Myanmar. In 2014, Living Goods began working with PSI Myanmar to provide “high-touch technical assistance to PSI to design and implement a replication of our Uganda model beginning in two townships.” PSI Myanmar will pay Living Goods $200,000 over three years for its work, which Living Goods expects to cover most of its costs for the project.37
Living Goods has also provided technical assistance to Marie Stopes International, which was working to create a community health worker network in Kenya,38 and to the Clinton Foundation, to help design a pilot in Peru for an entrepreneurship program.39
Living Goods has three full-time staff members who focus on partnerships. A couple additional staff allocate a percentage of their time to this as well.40
Spending breakdown
We have seen expenditure data for Living Goods for 2012 and 2013 and a budget for 2014.41 Both of the tables below exclude the cost of goods. In both 2012 and 2013, Living Goods fully recovered the cost of goods (and made a margin – see third table below), and it expects to in 2014 as well. When the cost of goods are included in the total for 2012 and 2013, it accounts for 7% of expenditures in those years.
Expenditures by type (in millions)
| 2012 | 2013 | 2014 | % of expenditures 2012-2014 | |
|---|---|---|---|---|
| US-based expenses | $1.17 | $1.71 | $1.27 | 41% |
| Country-level expenses | $0.90 | $1.20 | $2.07 | 41% |
| Branch Offices and Transport | $0.11 | $0.20 | $0.23 | 5% |
| Marketing and Promotion | $0.12 | $0.11 | $0.13 | 4% |
| Training | $0.05 | $0.04 | $0.03 | 1% |
| Sub-Grant to BRAC | - | - | $0.36 | 4% |
| Capital Expenditures | $0.08 | $0.20 | $0.14 | 4% |
| Total | $2.43 | $3.46 | $4.22 | 100% |
Expenditures by program (in millions)
| 2012 | 2013 | 2014 | % of expenditures 2012-2014 | excluding unallocated | |
|---|---|---|---|---|
| Uganda | $0.59 | $0.78 | $1.26 | 26% | 45% |
| Kenya | $0.00 | $0.49 | $0.79 | 13% | 22% |
| Partnerships | $0.69 | $0.47 | $0.81 | 19% | 33% |
| Unallocated (primarily US-based operations) | $1.16 | $2.14 | $1.36 | 42% | N/A |
| Total | $2.43 | $3.87 | $4.22 |
Margin on goods sold
| 2012 | 2013 | Total | |
|---|---|---|---|
| Cost of goods | $172,726 | $264,263 | $436,989 |
| Wholesale sales revenue | $261,586 | $373,017 | $634,603 |
| Damages, expired, and write downs | $13,394 | $34,274 | $47,668 |
| Final margin | 29% | 20% | 24% |
Living Goods organizational structure
Living Goods’ staff consists of about 5 US-based staff, about 35 staff on country-level teams in Uganda and Kenya, 2 field supervisors, and a Branch Manager and Assistant Branch Manager at each of eight branches in Uganda and one Branch Manager in Kenya.42 Country-level staff include staff specializing in training, product development, sales, health impact, logistics, technology, finance, talent, monitoring, and partnerships.43
Does it work?
To evaluate Living Goods’ impact, we considered:
- Do the health products that CHPs sell improve health and save lives?
- What does the randomized controlled trial of Living Goods’ program say about its impact?
- What does Living Goods’ ongoing monitoring say about its impact?
- Has Living Goods’ work with partners had an impact on those projects and have those projects improved or saved lives?
- Do the products that CHPs sell provide economic benefits?
Do the products that CHPs sell improve health and save lives?
Living Goods says that it “aim[s] to reduce under-five mortality by focusing on an ICCM+ approach, [which] includes quality treatments for pneumonia, diarrhea, malaria, encouraging prevention and healthy behaviors, and improving maternal and newborn health, especially in the perinatal period.”44 We have not completed recent evidence reviews for artemisinin-combination therapy (ACT) for malaria (older review of the program here), antibiotics to treat pneumonia or oral rehydration salts to treat diarrhea, but we believe that there is relatively strong evidence to support these programs. We have not researched the efficacy of interventions for newborn conditions. Living Goods told us that it focuses on newborn conditions in particular because it has found that a large portion of child deaths occur in the first month of life and that there are interventions that can significantly reduce this mortality.45
CHPs also sell deworming medications and mosquito nets, on which we have completed evidence reviews and believe to be effective. However, the manner in which these products are distributed (one-off purchases rather than community-wide distributions) may affect their impact. In addition, these products account for a small portion of Living Goods’ sales.
Other products and services may also contribute to health, but we have not reviewed the evidence on their impact. Such effects might include improved maternal health from pregnancy support and post-natal visits, reduced indoor air pollution and injuries resulting from use of cookstoves and solar lighting, improved nutrition from the use of fortified foods and vitamins and minerals, and reduced infections from the use of delivery kits and soap for handwashing.
Note that evidence that the products CHPs supply improve health would not be sufficient to demonstrate Living Goods’ impact, because households might obtain the products from other sources in the absence of CHPs. However, this evidence helps provide context on whether the results discussed in the next section are plausible.
Living Goods notes that the drugs it sells are free in public facilities, but that clients may prefer to buy from CHPs because of the cost of traveling to facilities and possibility that the facility will be out of the medicine. According to Living Goods, clients may also be reluctant to buy drugs from other private providers because of the risk of getting a counterfeit medicine.46 Living Goods sent us a study conducted at the midline of its RCT that claims that both availability of counterfeit drugs and drug prices decreased at private retailers in areas where CHPs worked.47 Additional results on these potential effects will be made available when the full RCT is published. We have not yet reviewed the midline study or vetted other claims about how and why consumers choose to obtain medicine.
What does the randomized controlled trial of Living Goods’ program say about its impact?
Researchers conducted a cluster-randomized controlled trial (RCT) of the CHP program in Uganda between 2011 and 2013. The study included both villages served by CHPs managed by Living Goods and villages served by CHPs managed by BRAC.48 The researchers have published an abstract on the study, and shared a more in-depth report with us. The more in-depth report is not yet cleared for publication because the authors are seeking publication in an academic journal.49 The report we have seen is not a full write-up; it lacks details such as a description of the baseline survey, analysis of sample attrition, and confidence intervals for results. We plan to publish a review of the study once the authors have published the full report.
The study included 214 rural villages and surveyed 8119 households. It found that the program reduced under-five mortality by 25%. The authors note:50
We find these results highly promising, however we have not fully vetted the results and note that the strongest programs we have considered are backed by multiple studies, while there has only been one rigorous study of the Living Goods program. In addition, from the information we have seen, we have the following concerns:
- It is our understanding that child mortality rates were not measured at baseline. It is possible that there were differences in mortality rates between treatment and control groups from the start. While randomization and the sample size makes this unlikely, researchers often conduct baseline surveys for RCTs to compare key variables, in order to check that randomization successfully created comparable groups.
- It appears that villages may have been carefully selected for inclusion in the sample (i.e. the list that was then divided into treatment and control) and that only a selection of Living Goods and BRAC branches were considered for the list. While this shouldn’t bias the results of the study, it could affect how replicable the results are in other locations.
- With such a program it is not possible to hide from participants whether or not they received the intervention and outcome measures rely on self-reports of events that may have occurred a few years in the past. Those who knew they were part of the program (because they had interacted with a CHP) may have been influenced to give more positive answers. However, this effect is less likely to impact mortality reports than questions on more subjective or less memorable events.
- We don’t know whether surveyors knew which villages were treatment villages. We would guess that it was not possible to keep this knowledge from the surveyors since questions included whether the household had received services from a CHP.
What does Living Goods’ ongoing monitoring say about its impact?
Living Goods reports on such metrics as number of malaria and diarrhea treatments provided, % of malaria and diarrhea cases followed up within 2 days, number of pregnancy registrations, % of pregnant women delivering in a facility or with trained help, % of women visited in the first 48 hours after giving birth, and % of referral cases followed up. It reports these metrics for both its directly-managed network and for the BRAC network. We have seen data for January 2012 through June 2014.51
We put limited weight on these metrics because:
- The data for these metrics are self-reported by CHPs, who are evaluated on their performance on such metrics and provided financial incentives for certain behaviors,52 which may incentivize them to inflate their reports.
- There is some evidence that CHPs are inflating the data. Living Goods told us that the main way it checks the accuracy of these reports is to compare the number of malaria and diarrhea treatments it sells to CHPs, to the number of malaria and diarrhea cases that CHPs report treating.53 In January to June 2014, CHPs reported 12% more malaria treatments than Living Goods sold to CHPs and 29% more diarrhea treatments than Living Goods sold.54 Living Goods notes that because dosages vary by the age of the patient and CHPs may choose to stock up on key treatments, over a short time frame, these figures may not fully match.55
- It appears that Living Goods calculates the % of cases followed up as the total number of follow up visits reported divided by the total number of treatments provided. As a result, this rate can exceed 100%. The rate of cases of malaria and diarrhea followed up was over 100% in every month from February to June 2014, reaching a maximum of 133% in April.56
In addition, Living Goods publishes annual “stakeholder reports” which report, at a high level, on organization and program progress. A few interesting notes from the 2013 report:
- In BRAC’s network "under five diarrhea and malaria treatments and sales per CHP fell due to procurement challenges in the second half of the year that affected pricing."57
- Living Goods "developed credit products for both consumers and agents, with an impressively high repayment rate of over 99%."58 We do not know how the repayment rate was calculated.
- Living Goods conducted surveys of CHPs in both Uganda and Kenya, and reported a selection of positive results.59 Living Goods sent us additional information about the CHP surveys, but we have not yet reviewed it.
Has Living Goods’ work with partners had an impact on those projects and have those projects improved or saved lives?
As discussed above, the RCT on Living Goods’ program includes an evaluation of the BRAC program that it has provided technical and financial assistance to. We have not seen information on whether Living Goods’ work with other partners has been impactful (nor do we know what portion of its total budget is spent on non-BRAC partnerships, though the total partnerships budget was 28% of programs in 2012-2014).60
Do the products that CHPs sell provide economic benefits?
Some Living Goods products, such as cookstoves and solar energy products, may provide economic benefits to customers by, for example, saving them money on fuel. Living Goods sent us estimates of how much customers who buy cookstoves and solar energy products save, but we have not yet reviewed these estimates.
Possible negative or offsetting impact
- Are some CHPs harmed by the program? CHPs take on financial risk by joining the program. Living Goods estimates that its CHP turnover rate is about 20-30% per year, and that 70-80% of CHPs who leave chose to drop out of the program, while the rest are asked to leave.61
- Does Living Goods divert skilled labor from other areas? CHPs are fairly well-educated and well-connected members of their communities. Would they have been adding value to their communities in other ways if they were not spending time as a CHP? Given the part-time nature of their work, we would guess that this is not a major concern.
What do you get for your dollar?
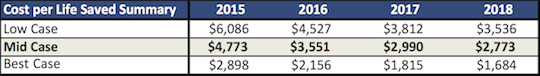
Living Goods' estimates
Living Goods has provided estimates of its future cost-per-life saved based on the lives saved per CHP in the RCT and modeling of future costs and numbers of CHPs. These estimates are based on Living Goods Uganda-specific budgets for 2015-2018 and the number of Living Goods-managed agents it expects to have each year. The "mid case" uses the overall mortality reduction estimated by the RCT (25.5%), which includes both Living Goods and BRAC branches, while the "low case" seeks to account for possible reductions in impact during scaling (using 20% for the impact on mortality), and the "best case" uses the mortality reduction observed for 2013 (42%).62
Our adjustments to Living Goods' estimates
Living Goods shared the details of how it calculated its estimates, and we think they are largely reasonable with a few caveats. There are a few additional assumptions we make in our estimates of Living Goods cost effectiveness:63
- Living Goods has included only those costs that it incurs within Uganda.64 We have included Living Goods' full budget, minus expected program revenue.65 These additional costs support the program directly and indirectly. The budget Living Goods provided does not include costs of the Kenya program, so these are missing from our model.
- Living Goods' estimates rely on an estimation of the lives saved per CHP based on the 2012 under-5 mortality rate in Uganda. Under-5 mortality fell quickly in Uganda from 2009 to 2012.66 If this trend continues, lives saved per CHP will likely be lower in the future. In some of our scenarios, we have assumed that mortality, in the absence of Living Goods' program, will continue to fall over the next four years.
- We have added an adjustment for contamination of the RCT due to CHPs visiting control group households. This contamination could cause the RCT to underestimate the effect of the intervention.
- We have added an adjustment for our subjective guess on whether the RCT results would be replicated if another RCT was done on the scale up program. This adjustment aims to capture both the strength of our belief in the accuracy of the RCT results as well as in the likelihood that Living Goods and BRAC will be able to replicate the results at a greater scale and in somewhat different locations (though still within Uganda).
- We have varied, across scenarios, the number of years we include in the estimate. Since Living Goods expects its cost per CHP to decline as it scales, it is more conservative to only include costs and benefits for the next 1-2 years than it is to include all 4 years.
Two GiveWell staffers have entered parameters for the various assumptions to derive "pessimistic," "base case," and "optimistic" estimates of Living Goods' cost per life saved (similar in concept to Living Goods' "low case," "mid case," and "best case"). The two staffers used somewhat different assumptions but generated similar estimates:
- Pessimistic: About $28,000 per life saved
- Base case: About $11,000 per life saved
- Optimistic: About $3,300 per life saved
Details in this spreadsheet. Our work on this model is ongoing, and we plan to ask Living Goods for some additional information that will help us improve the model (details in footnote).67
Note that the estimate does not take into account any other potential benefits of the program, such as improved health in non-fatal cases or economic benefits. The estimate focuses on under-5 mortality because this was the primary outcome examined by Living Goods’ RCT. We do not have enough information about Living Goods’ effects on other health outcomes to confidently include them in our analysis.
Marginal cost per life saved
The figures discussed above estimate the average cost per life saved by the Living Goods program. This approach is consistent with our approach to estimating cost effectiveness for our top charities (though is at an earlier stage) and seeks to deal with issues of "leverage" by treating all donor funds the same.
Another approach, and the one that Living Goods favors, would be to attempt to calculate a marginal cost per life saved by excluding costs that Living Goods expects to incur regardless of the number of CHPs it supports, namely, headquarters costs and the costs of supporting the partnership team. For simplicity, we assume that all costs incurred within Uganda are variable and that they increase linearly with the number of CHPs supported. In reality, there are likely some in-country costs that increase non-linearly (e.g. a single country director may be required regardless of the number of CHPs, or additional branches may be further from Living Goods' main office, increasing transportation costs for field managers to oversee each branch as the number of CHPs grows).
With these assumptions, we estimate a base case of $7,500-8,500 per life saved.68 As noted above, this estimate is not directly comparable with cost effectiveness estimates we have created for other charities.
Room for more funding?
Scaling up in Uganda
Having recently completed the RCT, Living Goods is now aiming to rapidly scale-up the networks of CHPs directly managed by Living Goods and managed by BRAC, from about 1,000 CHPs (400 Living Goods, 600 BRAC) to 6,500 CHPs (2,500 Living Goods, 4,000 BRAC).69
In total, it is seeking funding to support a budget of about $10.3 million per year, including costs incurred by BRAC. It expects to raise some of this from partnership consulting fees and margins on goods sold to CHPs, leaving an estimated $8.9 million per year that would need to be supported by donor funding.70 In 2012 Living Goods raised $2.8 million, and in 2013 it raised $3.3 million from donors.71 Living Goods told us that it believes there is a decent chance it will reach two-thirds of its funding target for the first year through agreements with funders who have supported its work in the past, but the money has not yet been secured and the funding need will grow each year.72 It is actively seeking funding from new donors to fill the gap.73
Uganda scale-up budget 2015-2018 (in millions)74
| Expenditures | Program revenue | Donor funding needed | |
|---|---|---|---|
| Living Goods Uganda | $10.25 | $1.01 | $9.24 |
| BRAC Uganda | $18.37 | $1.27 | $17.10 |
| Partnerships | $5.60 | $3.25 | $2.35 |
| Other (primarily US-based) | $7.03 | $0.00 | $7.03 |
| TOTAL | $41.25 | $5.53 | $35.73 |
Living Goods expects its scale-up in Uganda to be similar to its past work in the country.75 Differences may include:
- A greater number of agents per branch.76
- An increased focus on nutrition products and nutrition education.77
- Work by BRAC on improving the quality of local health facilities, particularly for delivery care, through training, checklists, and new protocols.78
Living Goods has also noted a couple of ways in which the setting it is working in has changed since the start of the project: bednet coverage is 2-3 times higher and the market price of malaria treatment has been reduced.79 Under-5 mortality in Uganda, according to the World Bank, decreased from 83 per 1,000 live birth in 2009 to 69 in 2012.80
Replication seed fund
Living Goods has told us that scaling up in Uganda is its top priority, but that it is also interested in creating a “seed fund” for replications of its program by partners. If it received sufficient funding for its scale-up, it may allocate unrestricted funds to the replication seed fund.81 Living Goods has proposed creating a seed fund of $15 million to provide co-funding for programs in three countries that would reach 3-5 million people per country; it estimates that the full cost of a new country program would be $10-15 million,82 so its support would cover 33-50% of the total. It expects that having a seed fund would improve its ability to negotiate and launch new projects.83
It plans to target countries based on:84
- Need/impact: high child mortality rates driven by malaria, diarrhea, respiratory infections, and neonatal conditions; high rates of counterfeit drugs; high drug prices; low rates of use of water filters, clean cookstoves, and solar lights.
- Economics/sustainability: reasonable household purchasing power, and large (over 15 million) populations with high population density.
- Governance: low security risk and a government that will allow the program to sell medicines.
- Current partner presence: Living Goods would prefer to work with partners it already has relationships with in other countries.
Based on these criteria, Living Goods is most strongly considering partnerships in Nigeria, India, Ghana, Zambia, Kenya, and Myanmar.85 Possible partners include PSI, Society for Family Health Nigeria (an organization founded by PSI), Management Sciences for Health, CARE, BRAC, Save the Children, and Plan International.86
Major questions for further investigation
- Can we increase our confidence in the impact of Living Goods’ past work? In order to improve our understanding of and confidence in Living Goods’ track record, we would be interested in better understanding:
- Are Living Goods staff carrying out randomized follow-ups with clients, and if so, what are they finding?
- Does the RCT have methodological problems that undermine the results?
- Where would clients obtain health products from in the absence of CHPs? What would the quality of these products be?87 Are there products they would not have had access to?
- Are Living Goods products consistently high quality?
- How effective are cookstoves, fortified food, solar lighting, and delivery kits at improving health? Do cookstoves and solar lighting provide economic benefits?
- What have been the outcomes of past partnerships, both in terms of Living Goods’ effect on the projects and the projects’ effects on the populations served?
- How much money do CHPs lose on average when they leave the program and how does the loss affect them?
- Will future work be as impactful as past work? How has child health and access to health goods and services changed in Uganda since the start of the RCT? How similar will replications outside of Uganda be to the program that was studied with the RCT and how similar will the new contexts be to that of Uganda?
- Will we be able to learn about the impact of future work? How will Living Goods evaluate the CHP program going forward? Do CHP reports provide accurate information on program progress? How will partner projects, including BRAC in Uganda and PSI in Myanmar, be monitored and evaluated, and will Living Goods be able to share this information with us?
- How cost effective is the CHP program? We have a a few detailed questions for Living Goods that will help us improve our cost effectiveness model.
- Will Living Goods’ funding gap be filled by other funders? How likely is it that Living Goods receives full funding for its scale-up from other sources? Will BRAC raise funds for its portion of the scale-up?
- We also have a few specific questions about how the program works.
- What portion of past spending on partnerships was on the BRAC partnership versus other partnerships?
- How are CHP incentive payments structured?
- Why is Living Goods working in Kenya? Will it be able to sell medicines there in the future? Is it planning to scale-up that program?
- What are the “credit products” that Living Goods offers?88
Sources
- 1
“LG noted in a document it sent that there have been some issue with the RCT it is currently conducting. We asked about this, and LG told us that there were both changes in the geographic footprint of the model and some flaws in the RCT survey strategy which are rendering the results not reliable from an evaluative point of view.
1. Spillover: Control sites were found to have experienced about 1/3 as much of the exposure to LG as treatment sites.
2. Service area for each agent: They had to guess service areas for each agent when they started and their guesses were quite different from how the program evolved. The RCT was designed with service areas that were much larger in terms of number of households and geographic area than agents are actually able to cover. For example: a significant number of survey-defined areas included 200-400 households, and subsequent research shows that the number of households in a given agent's area is closer to 100. Researchers are concerned that any attempts to ameliorate this effect would compromise randomization.
3. Treatment population not matched to treatment area: LG did a GPS tracking exercise on how far and where agents worked and compared this data to data from the RCT. They found that 80% of the homes actually served by agents were within 500 meters of agents' homes. However, 50% of households in surveyed in the RCT were over 1.2 km from agents homes.
4. There is also some agent activity that is in neither in control or treatment sites, constituting
impacts that will not be detected.”GiveWell's non-verbatim summary of a conversation with Chuck Slaughter, July 20, 2012.
- 2
Email from Chuck Slaughter, Founder and President, Brad Presner, Director of Analytics, and Lisa McCandless, Director of Development, Living Goods, October 6, 2014 - 3
“Recruitment activities include:
1. Mapping out areas where gaps exist or where we should expand CHP
coverage.
2. Meeting with LCs, women’s groups, other NGOs, religious and local leaders to get referrals for CHP candidates.
3. Explaining and distributing CHP candidate referral forms to existing CHPs.
4. Assist Field Supervisors and Training Team with oral interviews,administering exams, and explaining requirements to CHP candidates.”
Living Goods Draft Branch Management Handbook, Pg 8. - 4
“Criteria Over the years, Living Goods has found successful CHPs share a few key traits. As you run recruitment activities with local leaders, here are the characteristics you will look for in CHP candidates:
1. Ability to dedicate 2 hours per day to sales and education activities for Living Goods. Keep in mind women with very young children might not be able to dedicate enough time.
2. Minimum 7 years of schooling.
3. 25-45 years old.
4. Fluent in local language(s).
5. Able to read/communicate in basic English.
6. Married (or no other plans to move soon).
7. Friendly, active, and known in her community with connections in social or women’s groups.
8. Previous work experience or training in health or business skills is desired (but not mandatory).
9. Ability to pass a basic math/reading test in English."
Living Goods Draft Branch Management Handbook, Pg 8. - 5
“There are no right answers to these questions. The most important aspects of the interview arise from the interaction. Does this person communicate well? Does she understand the questions and respond appropriately? Has she demonstrated genuine interest in the work and the competence to carry it out?” Living Goods CHP Interview Guide.
- 6
“Every Living Goods agent receives 2-3 weeks of initial health and business training. Agents are trained on all key health topics, including diagnosing, treating and recognizing danger signs for referral. Agents are also trained on important aspects of running a business such as managing working capital, calculating profit, and record-keeping. Finally, agents are trained in best practice sales skills, counseling, and communication.” Living Goods Training & Coaching.
“To operate as a Living Goods CHP, applicants must:
- Attend two weeks of training and pass the test at the end
- On passing the test, invest UGX 82,000 in the tools and initial inventory to build their business. A 6-month loan is available, with a UGX 25,000 deposit required up-front to get commodities worth 54,000 UGX and a phone worth 270,000 UGX.
- Commit to spending at least 2 hours per day visiting households in their zone.”
- 7
“To operate as a Living Goods CHP, applicants must:
- Attend two weeks of training and pass the test at the end
- On passing the test, invest UGX 82,000 in the tools and initial inventory to build their business. A 6-month loan is available, with a UGX 25,000 deposit required up-front to get commodities worth 54,000 UGX and a phone worth 270,000 UGX.
- Commit to spending at least 2 hours per day visiting households in their zone.”
Living Goods CHP Profile and Expectations, Pg 1.
According to Google, UGX 82,000 was worth USD 31.48 on September 4, 2014.
- 8
“Living Goods equips CHPs with:
- Free training for 2 weeks on health and business.
- A business-in-a-bag with tools and branding materials
- A touch phone to support the CHP’s health work
- A start-up loan for the purchase of initial products, to be repaid over 6 months
- Ongoing Stocking of products at Living Goods branches
- On-going training as they work”
Living Goods CHP Profile and Expectations, Pg 1.
“Our business-in-a-bag provides micro-entrepreneurs with all the tools they need to launch a thriving Living Goods franchise. Their startup kit includes a branded duffle bag, uniforms, signs for their home store, a display locker, and basic health and business tools. Couple that with a robust two-week training course and ongoing marketing and mentoring support and you have an army of motivated agents bringing life-changing products to the doorsteps of the poor.” Living Goods Business-In-A-Bag.
- 9
“After initial training, Living Goods will provide in-service trainings for CHPs. This is an excellent opportunity for Branch Staff to expand their own learning as well as check in with CHPs on challenges and successes.” Living Goods Draft Branch Management Handbook, Pg 9.
“Agents also attend one day of training every month to review key health or business topics, discuss operational issues, hear about new policies and learn about new product offerings.” Living Goods Training & Coaching.
- 10
- Living Goods Ugandan Monthly Sales
- Email from Chuck Slaughter, Founder and President, Brad Presner, Director of Analytics, and Lisa McCandless, Director of Development, Living Goods, October 6, 2014
- 11
“It is your responsibility to hold your branch’s CHPs to these standards:
1. 100% stocking of essential items (ORS + zinc, amoxicillin, ACTs)...”
Living Goods Draft Branch Management Handbook, Pg 9. - 12
- “For sales data, Branch Staff can run reports on performance directly from the POS. The IT team will also communicate with you on the purchase performance of CHPs each month.” Living Goods Draft Branch Management Handbook, Pg 9.
- The document later explains that the POS is the system that branches use to record sales to CHPs. Living Goods Draft Branch Management Handbook, Pg 14.
- Living Goods confirmed that the sales data represents sales from Living Goods to CHPs in Email from Chuck Slaughter, Founder and President, Brad Presner, Director of Analytics, and Lisa McCandless, Director of Development, Living Goods, October 6, 2014.
- 13
- Chuck Slaughter, conversation with GiveWell, July 29, 2014.
- Email from Chuck Slaughter, Founder and President, Brad Presner, Director of Analytics, and Lisa McCandless, Director of Development, Living Goods, October 6, 2014
- 14
Email from Chuck Slaughter, Founder and President, Brad Presner, Director of Analytics, and Lisa McCandless, Director of Development, Living Goods, October 6, 2014
- 15
- Data from Living Goods Ugandan Monthly Sales, summarized in sheet ‘Analysis by GiveWell.’
- Living Goods provided a list of sales for 974 products, many of which are listed multiple times. Based on the names, we categorized these into product type. We believe that we have categorized correctly for a large portion of the products, but we may not have been fully accurate. For 0.55% of sales, we were not confident enough to guess a category. We have converted from Ugandan shillings to US dollars.
- Note: Units may be misleading for products that are sold in larger packets. For example, in one product, 1 unit contains 10 ORS dosages. Some food products come in larger packaging in which 1 unit may contain 10 or 30 smaller packets. (Email from Chuck Slaughter, Founder and President, Brad Presner, Director of Analytics, and Lisa McCandless, Director of Development, Living Goods, October 6, 2014)
- Data on sales margins from Living Goods Product List (July 2014).
- 16
“Over the last four years we built a network in Uganda of over 1,000 sales agents and are on our way to establishing a self-funded system for fighting disease and poverty in the developing world. With Uganda on the road to sustainability, we were ready to take what we learned and open a second country - Living Goods Kenya began operating in 2013.” Living Goods Where We Work.
- 17
Email from Chuck Slaughter, Founder and President, Brad Presner, Director of Analytics, and Lisa McCandless, Director of Development, Living Goods, October 6, 2014
- 18
Data from Living Goods Kenya Monthly Sales, summarized in sheet ‘Analysis by GiveWell.’
Living Goods provided a list of sales for 82 products. Based on the names, we categorized these into product type. We believe that we have categorized correctly for a large portion of the products, but we may not have been fully accurate. For 2.3% of sales, we were not confident enough to guess a category. We have converted from Kenya shillings to US dollars.
- 19
“BRAC and LG agents go house-to-house, teaching families better health practices across the core impact areas noted above. Agents evaluate and advise homes on nutrition, family planning, hygiene practices, use of key preventative methods including bed nets, water treatment, clean stoves, and solar lights.” Living Goods-BRAC Draft Scale Up Concept Note (August 2014), Pg 4.
- 20
“During household visits agents check children’s health and use ICCM guided assessment to address any illness.” Living Goods-BRAC Draft Scale Up Concept Note (August 2014), Pg 4.
Details on ICCM at WHO/UNICEF Integrated Community Case Management.
- 21
“Agents provide all clients with their mobile phone number so customers may reach them promptly when a child is ill or they need health commodities.” Living Goods-BRAC Draft Scale Up Concept Note (August 2014), Pg 4.
- 22
“As noted above, agents seek to identify and register and support pregnancies. LG and BRAC provide small financial incentives for each registration and for key pre and post-natal visits. CHPs make two to three ante natal visits to educate the expectant moms, check for danger signs and risk factors, encourage ANC checks at health centers, promote the use of iron folate and a healthy diet, prophylaxis for malaria, and help clients plan for their delivery and newborn care. We sell clean delivery kits to help prevent sepsis.” Living Goods-BRAC Draft Scale Up Concept Note (August 2014), Pg 5.
- 23
“As the majority of reported deaths are occurring in the first month, we will place a particular emphasis on post-natal visits and proper newborn care as noted above. Agents must visit the new moms as soon as possible after the delivery, and once more in the first week. We provide a free cozy cap to every new mom who notifies their CHP when they are in labor or within 24 hours of the birth to help ensure the PNCs happen promptly.” Living Goods-BRAC Draft Scale Up Concept Note (August 2014), Pg 5.
“As they do now, agents will register pregnancies as early as in term as possible, provide basic ante natal care and encourage ANC visits at public health centers, deliver maternal vitamin supplements, help all mothers deliver in proper facilities, and importantly, ensure proper newborn care practices.” Living Goods-BRAC Draft Scale Up Concept Note (August 2014), Pg 3.
- 24
“Agents provide community health education through regular community health talks, especially leveraging connections with local community groups, schools, places of worship, and support from local leaders and council members.” Living Goods-BRAC Draft Scale Up Concept Note (August 2014), Pg 4.
“It is your responsibility to hold your branch’s CHPs to these standards:...
2. Carry out at least 2 community events each month.” Living Goods Draft Branch Management Handbook, Pg 9. - 25
“The Branch Manager and Assistant Manager should meet with or talk to each CHP in their branch at least once a month.” Living Goods Draft Branch Management Handbook, Pg 9.
- 26
“It is your responsibility to hold your branch’s CHPs to these standards:
3. Properly report health data (pregnancy registrations, under 5
treatments, etc.) each month.” Living Goods Draft Branch Management Handbook, Pg 9. - 27
Living Goods Draft Branch Management Handbook, Pg 10-13.
- 28
Living Goods Draft Branch Management Handbook, Pg 10. 165,000 UGX converted to USD with Google.
- 29
Email from Chuck Slaughter, Founder and President, Brad Presner, Director of Analytics, and Lisa McCandless, Director of Development, Living Goods, October 6, 2014
- 30
Living Goods-BRAC Draft Scale Up Concept Note (August 2014), Pg 2.
- 31
Chuck Slaughter, conversation with GiveWell, July 29, 2014.
- 32
“In addition to BRAC, Living Goods has helped three other major multi-national NGOs pilot variations of the Living Goods model: Population Services International, The Clinton Foundation and Marie Stopes. To support these and future collaborations we have created a separate, robust division to drive our influence and partnerships strategy. We have assembled a highly capable five-person team with deep experience across public health, business, partnerships, consulting, and communications (see appendix for bios).” Living Goods Draft Replication Strategy (September 2014), Pg 1.
- 33
“BRAC and Living Goods have worked together since 2008 to build this entrepreneurial community health worker (CHW) model in Uganda. LG launched its own network of CHPs in Uganda in 2009 as an engine of innovation to deepen the impact and sustainability of the model.” Living Goods-BRAC Draft Scale Up Concept Note (August 2014), Pgs 1-2.
“Big partnerships are core to our DNA as LG started as a collaboration with BRAC in Uganda.” Living Goods Draft Replication Strategy (September 2014), Pg 1.
- 34
“Over the years of the BRAC-Living Goods partnership, Living Goods has provided support in a wide range of areas, including: business planning, procurement, health communications, inventory management, monitoring and evaluation, as well as over $2 million in funding for the partnership.” Living Goods BRAC Partnership.
- 35
Chuck Slaughter, conversation with GiveWell, July 29, 2014.
- 36
“During the first phase of the partnership BRAC and Living Goods experimented with differing variations in the operational model. For example BRAC invested more in staff time on ante-natal care, did more organized health talks, and kept costs lower. LG tested more new products, integrated use of mobile messaging and supported more agents per branch.” Living Goods-BRAC Draft Scale Up Concept Note (August 2014), Pg 3.
- 37
“PSI Myanmar recently won an $8 million three-year grant from the 3MDG fund. The 3MDG Fund is financed by seven major donors, committing over US$330 million from 2012 to 2016, with significant investment going to Maternal, Newborn and Child Health. Under this award PSI Myanmar asked Living Goods for help developing a cost effective network of community health entrepreneurs. PSI Myanmar currently operates the Sun Quality Health network of over 300 social franchised health clinics and the Sun Primary Health network of over 2,000 community health workers, supporting reproductive health,malaria, diarrhea and WASH activities. Living Goods is providing high-touch technical assistance to PSI to design and implement a replication of our Uganda model beginning in two townships in Myanmar. PSI sees near-term potential to test in additional sites and opportunity to rapidly scale thereafter. ” Living Goods Draft Replication Strategy (September 2014), Pg 7.
- 38
“Marie Stopes International (MSI), a leader in international family planning, operates networks of franchised and owned clinics in over 40 countries. Living Goods is working with MSI in Kenya to bolt on a system of community health entrepreneurs to its network of clinics. Along with health referrals and consultations, branded mobile Marie Stopes agents will use our business-in-a-bag strategy to sell essential products to their communities. These ‘Blue Star’ agents will be the first of their kind for MSI, and if successful, the model may scale across Marie Stopes’ global system.” Living Goods Partner Organizations.
- 39
“The Clinton Foundation’s Sustainable Growth Initiative received $200 million in funding to build sustainable enterprises in Latin America with the goal of creating incomes for thousands of entrepreneurs. The Clinton team called on Living Goods to help design their pilot in Peru, where agents are already branded, trained, and selling in their communities. Starting from scratch, Living Goods helped CGSGI choose their product mix, hire and train their agents, and set up an effective inventory control system.” Living Goods Partner Organizations.
- 40
Email from Chuck Slaughter, Founder and President, Brad Presner, Director of Analytics, and Lisa McCandless, Director of Development, Living Goods, October 6, 2014
- 41
All data in this section from Living Goods unaudited financials (2013) and Living Goods budget (2014), and summarized in GiveWell spending analysis for Living Goods.
- 42
Living Goods Org Chart (August 2014).
“In summary, we seek to… Expand Living Goods Uganda from seven to 18 branches.” Living Goods-BRAC Draft Scale Up Concept Note (August 2014), Pg 1.
- 43
- 44
- Details on ICCM at WHO/UNICEF Integrated Community Case Management.
- Email from Chuck Slaughter, Founder and President, Brad Presner, Director of Analytics, and Lisa McCandless, Director of Development, Living Goods, October 6, 2014.
- 45
“Approximately half (45%) of all child deaths occur in the first month of life. There is evidence that skilled birth attendance in a facility, exclusive and immediate breastfeeding, thermal care, and keeping the mother and baby in a clean, sanitary environment (and preventing infection of the cord site) can reduce neonatal mortality significantly." Email from Chuck Slaughter, Founder and President, Brad Presner, Director of Analytics, and Lisa McCandless, Director of Development, Living Goods, October 6, 2014
- 46
“While drugs are free in public facilities, the cost of transport often exceeds the price we charge, so because we deliver to the client’s doorstep the model technically ‘cheaper than free’.Customers are glad to pay for the convenience of home delivery. (That transport cost is often lost altogether as the public dispensaries suffer high stock out rates.) Customers also value LG and BRAC over many private providers where they know the risk of counterfeits is high.” Living Goods-BRAC Draft Scale Up Concept Note (August 2014), Pg 6.
- 47
- 48
“In treatment villages, Living Goods and BRAC Community Health Promoters conducting home visits, educating households on essential health behaviors and selling preventive and curative health products at 20-30% below prevailing retail prices were deployed over a three-year period (2011-2013).” Bjorkman-Nykvist et al. 2014 abstract.
- 49
Lisa McCandless, Living Goods Director of Business Development, email to GiveWell, July 24, 2014.
- 50
- 51
Living Goods Quarterly Dashboard covers January 2012 to March 2014. Living Goods Health Dashboard (June 2014) covers January 2013 to June 2014 for the directly-managed network only.
- 52
“It is your responsibility to hold your branch’s CHPs to these standards:
...
3. Properly report health data (pregnancy registrations, under 5 treatments, etc.) each month.
4. Registering pregnancies: 7 per month
5. Treating (children under 5):- a. Malaria: 13 per month
b. ORS + Zinc: 6 per month”Living Goods Draft Branch Management Handbook, Pg 9.
“LG and BRAC provide small financial incentives for each registration and for key pre and post-natal visits.” Living Goods-BRAC Draft Scale Up Concept Note (August 2014), Pg 5.
- 53
Chuck Slaughter, conversation with GiveWell, July 29, 2014.
- 54
Living Goods Treatment vs. Sales Summary (January to June 2014).
- 55
“Dosage levels vary by age of patient, so our mapping of sales to treatments, which is based on historical age of treatment data, is not expected to be completely accurate. Second, agents often stock-up on key treatments, and as such, it is typical to see month to month fluctuations in sales and reported treatments. Over time, we want the figures to be approximately even, but expect that in any given month, we maybe above or below 100%.” Living Goods GiveWell Document Request Guide.
- 56
- 57
- 58
- 59
"LG took time this year to better understand its impact on the lives of agents, with agent surveys in both Uganda and Kenya. Results were promising and rewarding: since joining LG, 97% of agents in Uganda report improved status in their communities. 95% of agents reported that LG has taught them new skills that will help them get another job or start a business in future. Over 90% said they would recommend Living Goods to a friend. In Kenya, 72% of agents are primary income earners. 32% of agents had an income of less than $2/day, and 85% support their children with their earnings. Kenya agents joined LG primarily to serve their community, followed closely by earning money, improving their status, learning business skills, and having access to high quality products." Living Goods Stakeholder Report (2013), Pgs 3-4.
- 60
- 61
Chuck Slaughter, conversation with GiveWell, July 29, 2014.
- 62
Living Goods Draft Cost per Life Saved Methodology. Further detail in Living Goods Draft Cost per Capita Served Methodology.
- 63
- 64
To understand what numbers Living Goods used in its model, we redid the calculations for 2015 and used this process to determine which inputs Living Goods used (some of which were explicit). From this we concluded that, for the total cost of the program, Living Goods used the figure for "Country Net Income" for Living Goods' Uganda program from Living Goods draft budget (2015-2018), rather than a figure for Living Goods' overall budget.
- 65
See GiveWell estimates of Living Goods cost effectiveness, Sheets “Jake’s assumptions” and “Natalie’s assumptions.”
- 66
- 67
Questions for Living Goods on cost effectiveness:
- What is the % of households with a child under 5 visited by a CHP in the treatment group vs. the control (in both Living Goods' and BRAC's networks)? Currently we only have the % of households visited overall for Living Goods network. If the coverage rates were similar for households with and without children under 5, then the effects found in the RCT seem implausibly large.
- Living Goods' estimate for number of children under 5 in the villages served by CHPs uses data from Living Goods' network only, derived from the RCT data. We would like to see the same data for the BRAC network: 1) number of households with a child under 5 per village in BRAC villages; 2) number of children under 5 per household in BRAC villages; 3) number of CHPs covering the BRAC villages in the treatment group.
- How has Living Goods modeled its future costs and number of CHPs in each year?
- Living Goods' estimates of number of children under 5 per CHP only use results from Living Goods' network, rather than incorporating results from BRAC's network. The scale-up that Living Goods is planning for 2015-2018 will add 1.6 BRAC-managed CHPs for every 1 Living Goods CHP, so understanding BRAC's costs and impact is important for understanding future cost effectiveness.
- 68
- See GiveWell estimates of Living Goods cost effectiveness, Sheets “Marginal cost (Jake)” and “Marginal cost (Natalie).”
- This marginal cost-effectiveness estimate only includes Living Goods’ funding needs for its “Living Goods Uganda” and “BRAC Uganda” programs (see Living Goods draft budget (2015-2018)).
- 69
“Living Goods is looking for a group of funders to scale up its program 5X over the next four years, starting January 1, 2015. It is seeking approximately $10M/year in funding across both its direct network and partner network, which is managed by BRAC. Living Goods is currently supporting 600 agents in 600 villages through BRAC and roughly 400 agents through its direct network. Living Goods is hoping to grow its direct network to about 2500 agents over the next few years.” GiveWell's non-verbatim summary of a conversation with Chuck Slaughter, May 5, 2014.
- 70
Living Goods draft budget (2015-2018). Summarized in GiveWell spending analysis for Living Goods.
- 71
Living Goods unaudited financials (2013).
- 72
Email from Chuck Slaughter, Founder and President, Brad Presner, Director of Analytics, and Lisa McCandless, Director of Development, Living Goods, October 6, 2014
- 73
“Living Goods believes there is a chance it will reach its funding target, but the money has not yet been secured. It is in deep discussions with several current and previous funders who have expressed interest in being part of a syndicate. Meanwhile, Living Goods is looking for new prospects and funders who can make commitments in the seven figures, annually.” GiveWell's non-verbatim summary of a conversation with Chuck Slaughter, May 5, 2014.
- 74
Living Goods draft budget (2015-2018). Summarized in GiveWell spending analysis for Living Goods.
- 75
“The product mix will remain largely the same as currently offered, covering health promotion, basic treatments, fortified foods, clean stoves, water filters and solar lights.” Living Goods-BRAC Draft Scale Up Concept Note (August 2014), Pg 5.
- 76
“To expand reach and improve activity levels we will increase the overall density of agents – at BRAC agents per branch will grow to 30-35 on average and at LG branches will expand support 100-120 agents.” Living Goods-BRAC Draft Scale Up Concept Note (August 2014), Pg 4.
- 77
“New attention to Nutrition: With the aim of driving meaningful reductions in micronutrient deficiency in young children we will test products like micro nutrient powders and fortified porridge, and augment education on balanced diet. We will increase education on exclusive breastfeeding and will offer de-worming treatments. We will provide education and products to improve maternal nutrition in child-bearing years and pre-natal periods. The program will leverage LG’s new fortified food product development, healthy foods from BRAC Uganda’s agriculture program, and some of our partners’ expert guidance on nutrition strategy. LG recently hired the former head of product development and sourcing for Sainsbury UK to help drive new products in this area.” Living Goods-BRAC Draft Scale Up Concept Note (August 2014), Pg 4.
- 78
“BRAC seeks to experiment on improving quality at local health facilities: Data show that obstetrical care at public facilities in Uganda is very weak, leading to high maternal mortality and risks to newborns. Once the core programmatic elements above have been effectively rolled out at the BRAC Uganda branches, BRAC will conduct tests to provide support at under-performing public Health Center 3 facilities near 10 BRAC branches in the form of training, check lists, and protocols around safe delivery.” Living Goods-BRAC Draft Scale Up Concept Note (August 2014), Pg 4.
- 79
"LG notes that needs have changed in the 3 years that they've been in Uganda. When they came, bednet coverage was low. Now bednet usages has gone up by a factor of 2 or 3. The street price for the WHO-approved malaria drug was $5-6 for a course when LG arrived and uptake was low. Since they've been there, the Affordable Medicines Facility (AMFm) has brought the price down." GiveWell's non-verbatim summary of a conversation with Chuck Slaughter, July 20, 2012.
- 80
- 81
Chuck Slaughter, conversation with GiveWell, July 29, 2014.
- 82
“We plan to help launch replications of our model in two to four countries in the next three years, with the aim of reaching three to five million people in each country, or a total of over 10 million served.” Living Goods Draft Replication Strategy (September 2014), Pg 1.
“We estimate it will cost approximately $10-15 million per country to fund initial implementation and scale up. We seek seed funding of $5 million of co-financing per country for up to three new country CHP platforms – a total commitment of $15 million.” Living Goods Draft Replication Strategy (September 2014), Pg 2.
- 83
“Securing commitment for such a fund up front will increase the odds of attracting the best partners and co-funders, and importantly, speed the process for approving and launching replication sites.” Living Goods Draft Replication Strategy (September 2014), Pg 2.
- 84
Living Goods Draft Replication Strategy (September 2014), Pgs 3-4.
- 85
“Based on the criteria above, countries emerging on our short list of possible priorities include Nigeria, India, Ghana, Zambia, Kenya and Myanmar.” Living Goods Draft Replication Strategy (September 2014), Pg 4.
- 86
- Living Goods Draft Replication Strategy (September 2014), Pgs 6-9.
- Email from Chuck Slaughter, Founder and President, Brad Presner, Director of Analytics, and Lisa McCandless, Director of Development, Living Goods, October 6, 2014
- 87
Living Goods sent us a study conducted at midline of its RCT (Bjorkman-Nykvist et al. 2013) that claims that both availability of counterfeit drugs and drug prices decreased at private retailers in areas where Living Goods worked. Additional results on these potential effects will be made available when the full RCT is published. We have not yet reviewed the midline study.
- 88
Living Goods “developed credit products for both consumers and agents, with an impressively high repayment rate of over 99%.” Living Goods Stakeholder Report (2013), Pg 3.