Our Report
A note on this page's publication date
The content we created for SEF in 2010 (and updated in March 2012) appears below. This content is likely to be no longer fully accurate, both with respect to what it says about SEF and with respect to what it implies about our own views and positions. With that said, we do feel that the takeaways from this examination are sufficient not to prioritize re-opening our investigation of this organization at this time.
In 2011, we declared SEF a "standout organization," which meant that we found it to be an outstanding opportunity to accomplish good but that we rated our top charities above it.
Published: 2010; Updated: March 2012
Summary
The Small Enterprise Foundation (SEF) is a microfinance institution operating primarily in the Limpopo province of South Africa.1 SEF is currently expanding into the Eastern Cape, Mpumalanga, and North-West provinces.2 (For more on microfinance, see our overview of microfinance.)
SEF shows a strong focus on collecting the information necessary to assess its social impact, including (a) data on how many clients are dropping out of the program; (b) data on whether SEF is succeeding in its attempt to target people with low incomes.
We believe that SEF stands above every other microfinance institution we have reviewed for its strong commitment to self-evaluation. Nevertheless, we have concerns about the overall impact of microlending on poverty. (For more on this general issue, see our blog post, "Is borrowing good for the borrowers?")
Our review process
We reviewed SEF in late 2009 as part of our process to distribute $250,000 in funds to an economic empowerment organization in Sub-Saharan Africa. In our investigations of microfinance, we had trouble finding an organization that could answer what we consider to be key questions about microfinance, and we conducted a search for non-U.S. organizations in order to find one.
The substance of the review below was initially written in early 2010, after a GiveWell site visit to SEF conducted in February 2010. The text was updated in March 2012 to reflect updates from the Small Enterprise Foundation.3 SEF reviewed an earlier draft of this update, and we made modifications after some back-and-forth. The older SEF review is available here. We have not investigated other microfinance organizations since our original research in 2009.
What do they do?
The Small Enterprise Foundation (SEF) is a microfinance institution (MFI) operating primarily in the Limpopo province of South Africa. SEF provides loans to groups of people.4 The majority of loans are for 6 months, with repayments due monthly. SEF also offers 4 and 10 month loans paid monthly, and 4 and 6 month loans for which repayments are due every 2 weeks.5
SEF does not provide savings services, but requires loan recipients to save in accounts administered by independent institutions.6 SEF stated to us that it does not provide savings services because of the high cost and difficulty of doing so, and noted that other institutions in the area provide "reasonable" access to savings services.7 It does not provide insurance services.8
Key questions about social impact
In evaluating SEF, we have used our key questions for evaluating microlending charities. The sections below cover its answers to our key questions (see the previous link for why we consider these questions important).
We feel that SEF is likely succeeding in targeting people with very low incomes, and is seeing genuinely high repayment rates from participants. We have some concerns about whether its clients are benefiting from the loans, but we feel that SEF stands above other microfinance institutions we've found in assessing and addressing these questions.
Is the organization focused on social impact?
We are not fully confident in SEF's social impact. However, SEF stands out from other microfinance institutions for its strong commitment to self-evaluation: not only does it provide loans with high repayment rates, but it is collecting the information necessary to assess whether these loans are helping clients (including information on dropout rates, which is often not provided by other microfinance institutions).
Some of the issues discussed below may sound discouraging, but in our view, it is highly encouraging that SEF is collecting and sharing the information necessary to discuss them. Other microfinance charities we have examined have not shared the information necessary to assess issues like clients' dropping out, harassment by officers, and overindebtedness.
In our view, an organization that consistently collects, assesses and shares important information is a better bet for a donor than one that does not.
Other examples of SEF's commitment to collecting, analyzing and learning from important information about social impact:
- SEF produces, and publicly posts on its website, an annual management report that assesses organizational growth, financial health and self-sufficiency, client dropout rates, human resource development, changes in client well-being, and future plans.9
- SEF paid for an evaluation by the independent microfinance evaluator M-CRIL, receiving its third highest rating (out of nine).10
- In mid-2009, SEF interviewed 30 clients "to investigate reasons for SEF’s increased arrears and dropout rate since January 2009."11 As of January 2012, SEF had not conducted more recent surveys.12
- In 2009, SEF commissioned a customized poverty scorecard for use with rural black households in South Africa. They have since conducted field tests to help ensure that the scorecard can be implemented under realistic conditions.13
How frequently do borrowers drop out of the program?
We have received dropout rate reports from SEF at two times. In the first report, covering the period between April 2008 and September 2009, SEF's drop out rate (calculated monthly) varied between 18% and 24%,14 and in the second report, covering the period between April 2010 and September 2011, SEF's dropout rate varied between 16% and 22%.15 SEF defines its dropout rate as the number of clients who completed a loan in the six months prior to a given date and did not take out a subsequent loan in that period or within one month following the end of the six month period divided by the total number of clients who completed a loan in the six months prior to the end of the period.16
SEF's dropout rate, especially recently, is well below the 28% average of dropout rates for microfinance institutions that report this data,17 but still seems substantial. It appears that clients are primarily dropping out due to dissatisfaction with the program, not just choosing not to borrow again because their needs have been met.18
SEF reports that it considers its dropout rate to be a key metric of how well it is doing. SEF's loan officers are rewarded for maintaining low dropout rates (as well as recruiting new clients and maintaining a low portfolio at risk ratio).19
For more information on microfinance dropout rates and how they are calculated, see our microfinance glossary.
Does SEF monitor why borrowers drop out?
We have seen two small surveys that SEF conducted on why clients dropped out of its program, the most recent of which is from 2009.
A 2007 survey of 79 dropouts gave the following reasons:20
- Group and centre conflicts (i.e. being required to repay loans for group members who fail to repay): 44%
- Family/husband conflicts: 27%
- Business failure: 24%
- Job/government grant: 20%
- SEF staff: 3%
- Relocation: 1%
- Taking a break: 1%
SEF interviewed 17 dropouts in 2009 to determine why dropout rates had increased.21 The main reason given for dropping out was distrust of staff members who used clients' savings to pay group loans without the clients' knowledge, required clients to attend long fortnightly meetings, and were even accused of committing fraud.22
In early 2012, Small Enterprise Foundation reported that they had not conducted any dropout surveys in the past two years. SEF said that they had not conducted further surveys because they found them redundant: "We found that the dropout surveys don't tell us anything new, because the results tend to be the same across the different surveys. Dropouts tend to be unhappy about having to bear other people's debt."23 SEF reports that they have taken steps to respond to the concerns raised in these surveys, including prohibiting field staff from using one client's savings to pay off other another's debts.24
Does SEF prevent client over-indebtedness?
SEF determines the size of a loan based on how much savings the client has and the capacity of her business as judged by the loan officer.25 The independent rating agency M-CRIL considers these "reasonable systems to assess client borrowing capacity."26 There are some questions, however, about whether staff consistently implement these systems as intended.27
In at least one area, however, access to other sources of credit has resulted in clients' taking out more loans than they are able to repay (see "Other issues" section below).
Are borrowers protected against harassment by loan officers and group members?
Only 3% of clients cited "issues with SEF staff" as the reason they dropped out of the program in the 2007 drop out study.28
SEF states that it keeps close track of repayment rates, savings and attendance at group meetings in order to be able to respond quickly to potential issues.29 M-CRIL states that client protection is "partially monitored."30
Loan officers are rewarded for maintaining a high repayment rate and disbursing new loans.31 It is possible that such incentives could lead to loan officers pressuring clients to repay or to take out loans they wouldn't otherwise have taken out. On the other hand, loan officers are also rewarded for maintaining a high client retention rate, which may lead to better treatment of clients.
SEF reports that their quality assurance procedures include regularly asking some clients about their treatment by staff members, and that that negative feedback is treated as a major issue.32
Other issues
SEF's impact may be diminished if the area in which it works has strong alternative sources of credit. A 2009 report by M-CRIL claimed that "none of the clients are a member of another MFI,"33 but a 2003 report stated that SEF faced competition from two other programs,34 and the M-CRIL report noted that SEF may be moving into areas where other microfinance services exist.35
A 2009 SEF report noted that some clients were becoming overindebted in "the North Zone" where clients have access to other sources of credit, including another MFI.36 SEF told us that they took remedial actions to try to limit client overindebtedness in the North Zone following the entrance of the other MFI, at substantial financial cost.37
In late 2011, SEF reported that it had not had recent issues with client over-indebtedness.38 At the same time, they reported that two new branches were in areas already served by other MFIs.39
What interest rates does SEF charge?
SEF appears to charge high interest rates on its loans, in the range of 6-8% per month (equivalent to 67-89% APR and 91-140% EIR).40
These interest rates appear to be high compared to other MFIs working in Sub-Saharan Africa.41 However, we do not regard these rates as particular cause for concern. SEF reports that they are making smaller loans than the average Sub-Saharan African MFI, which could help explain the relatively high rates.
For more information on microfinance interest rates and how we calculate the cost of a loan to borrowers, see our microfinance glossary.
What is SEF's repayment rate?
It appears that a very high percentage of SEF's loans are repaid. We calculated a conservative estimate of SEF's "collection rate" for January 2009 to December 2010 i.e., the percentage of money disbursed during this period that was repaid by the first two quarters of 2011. We estimate that this rate was 99.25% over this period.42 This lower-bound "collection rate" corresponds to approximately a 3.45% annual loan loss rate (i.e. percent of loan portfolio that is lost per year).43 Note that:
- This rate does not treat loans that were repaid late (by mid-2011) differently from loans that were repaid on time.
- SEF's reported loan loss rates on Mix Market for 2009 and 2010 are 1.13% and 0.70%, respectively.44 Though these figures may not capture the full picture (some bad debts may not have been written off), it suggests that our estimate is quite conservative and SEF's true repayment rate may be higher.
Though we have had to do a fair amount of estimating and approximating, our understanding of SEF's repayment rate is much clearer than our understanding of the average microfinance institution refers to as its "repayment rate." These rates often leave significant room for interpretation and can be very misleading.
For more information on collection rates and other forms of microfinance repayment rates, see our microfinance glossary.
What are SEF's clients' standards of living?
SEF aims to serve people with very low incomes, and there is some evidence that it is successfully doing so.
SEF works in one of the poorest provinces in South Africa.45 Within this area, SEF targets poor clients through "participatory wealth ranking" (PWR) where "members of a village define conditions of poverty in their village and rank community members according to these conditions...Those ranked poorest by the participants are eligible for membership" in SEF loan groups.46 In 2000, independent evaluators did an assessment of whether this targeting method was resulting in SEF's serving the poor.47 They compared "poverty scores" from random samples of new clients and non-clients and found that clients in the targeted program were poorer on average than non-clients.48 Poverty scores were based on a such indicators as condition of house, quality and quantity of food, education of household members, and assets owned.49
SEF also runs a non-targeted program, which they said accounts for 18% of loans.50 Clients in this program were found to be less poor on average than non-clients.51 SEF has said that this program is not being expanded.52
A representative survey53 done by SEF in 2007 on 625 clients54 in the poverty-targeted program estimated that 64.4% of clients lived on less than the equivalent of about $1.64 per day and 89.5% lived on less than the equivalent $3.28 per day.55 These percentages were estimated by asking clients simple questions such as "what type of fuel do you use?" and "what is your main source of income?" and using an independent conversion methodology to convert this data into income data.56 The survey also found that 87% of clients in the program targeted at the poor had electricity, 47% had piped water, and 3% had a flush toilet.57
In late 2011, SEF reported that it continues to use participatory wealth ranking to target poor clients, and that client demographics are largely unchanged since 2009.58
For more information on standard of living surveys of microfinance clients, see our microfinance glossary.
Possible negative/offsetting impact
We believe that borrowing is bad for at least some borrowers;59 the above section addresses what we know about this concern in SEF's case.
We also have general concerns about charities' potential diversion of skilled labor and/or interference with government responsibilities. The latter concern seems minor in this case, as SEF's functions don't seem to overlap with (or involve funding) government functions. The former is a potential concern, although SEF has provided what we consider a reasonably strong argument that its personnel come from backgrounds of unemployment and underemployment.
What do you get for your dollar?
We have not completed a cost-effectiveness analysis for the Small Enterprise Foundation.
On a per-person-served basis, the Small Enterprise Foundation's activities are more costly than the health interventions we recommend most strongly. According to Mix Market, SEF's cost per borrower in 2010, the most recent year available, was $128.60 For the Against Malaria Foundation (AMF), purchasing and distributing a single long-lasting insecticide-treated bed net costs approximately $5.50. Therefore, for SEF's cost of serving one borrower, AMF could provide 22 bednets covering approximately 40 people with nets for a little over 2 years.61 It is plausible that each person receiving a loan from SEF benefits much more than they would from a bed net, but we doubt that they benefit proportionally to the higher cost.
Note that this cost-per-borrower figure is for the average client, not the marginal client. We are uncertain about how additional contributions to SEF would translate into more clients served: charitable contributions may be leveraged in a way that leads to a cost of either much more or much less than $128 per additional client served.
Room for more funds
SEF estimates that it could productively use approximately $931,000 in additional donations in 2012, including:62
- $750,000 to borrow against to make more loans63
- $71,000 to increase social performance monitoring64
- $30,000 for a feasibility study on providing direct saving services65
- $80,00 for a program to prepare internal candidates for future management positions66
Small Enterprise Foundation has shared a document showing how they would allocate funding across these priorities at different fundraising levels.67
SEF received half of GiveWell's 2009 economic empowerment grant, the majority of which was used to fund a client skills training program through Freedom from Hunger.68
Financials/other
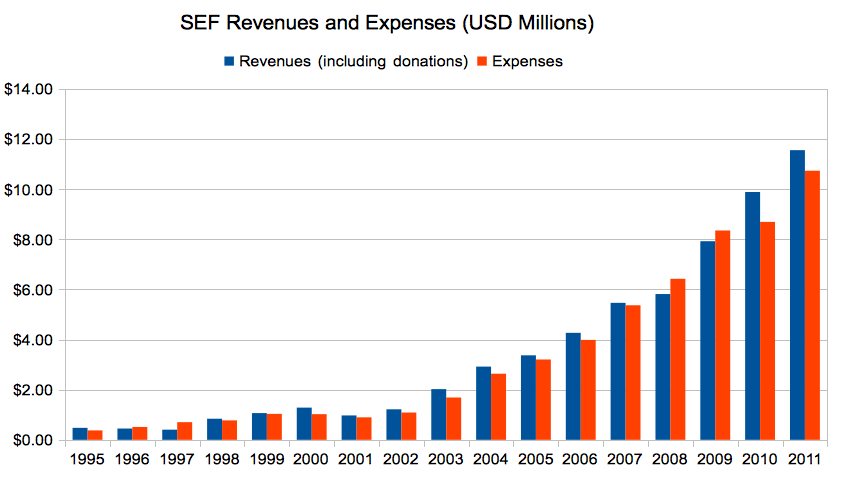
Data for 1995-2009 comes from Mix Market; data for 2010 and 2011 comes from SEF's audited financial statements.69
Revenue and expense growth (about this metric): SEF's revenues and expenses have grown gradually over time.
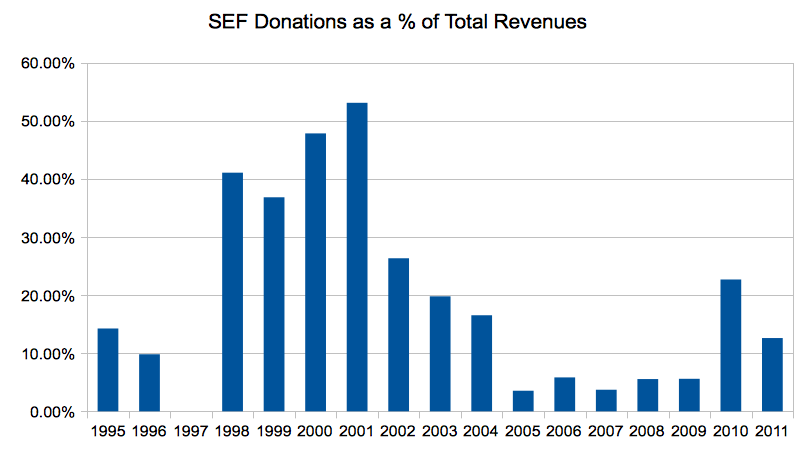
Donations as a % of revenues: We consider this metric for microfinance institutions to check the degree to which they still require donations to meet their obligations.
Expenses by program area (about this metric): The Small Enterprise Foundation currently runs only one program.
Expenses by IRS-reported category (about this metric): The Small Enterprise Foundation operates in South Africa and is not a IRS-registered charity.
Unresolved issues
We believe that SEF is a standout microfinance organization for its commitment to self-evaluation. We are uncertain, however, about the overall impact of providing microloans on poverty in the developing world.
In addition, we have not yet fully answered the following questions:
- Counterfactual. Would some other for-profit MFI have expanded into the areas SEF serves if they had not?70 Would some other MFI have created products serving low-income borrowers in the areas SEF serves if SEF had not entered?
- Negative and offsetting impact. What would the SEF staff be doing if they were not working for SEF? Are SEF's policies for avoiding harassment and overindebtedness adequately enforced?
- Cost-effectiveness. How cost-effective are SEF's average and marginal activities? How much does it cost (in donations) to provide a single additional client with loan services? How does a donation used for loan capital compare to a donation used for client skill training or improved social performance monitoring?
Sources
- Baumann, Ted. 2003. Small Enterprise Foundation: South Africa’s premiere pro-poor microlender (DOC). Monograph No. 1. South Africa: Community Microfinance Network.
- Chen, Shiyuan, Mark Schreiner, and Gary Woller. 2009. A simple poverty scorecard for South Africa (PDF).
- de Wit, John. Executive Director of SEF. Email to GiveWell (DOC), December 7, 2009.
- de Wit, John. Executive Director of SEF. Email to GiveWell, March 3, 2010.
- de Wit, John. Executive Director of SEF. Email to GiveWell (DOC), July 13, 2010.
- de Wit, John. Executive Director of SEF. Email to GiveWell (DOC), August 16, 2010.
- de Wit, John. Executive Director of SEF. Email to GiveWell (DOC), November 25, 2011.
- de Wit, John. Executive Director of SEF. Email to GiveWell (DOC), November 30, 2011.
- de Wit, John. Executive Director of SEF. Email to GiveWell (DOC), December 27, 2011.
- de Wit, John. Executive Director of SEF. Email to GiveWell (DOC), January 29, 2012.
- de Wit, John. Executive Director of SEF. Email to GiveWell, March 6, 2012.
- de Wit, John. Executive Director of SEF. Phone conversation with GiveWell (DOC), January 19, 2012.
- Duke, Sara. M-CRIL Senior Researcher. Phone conversation with GiveWell, November 18, 2009.
- GiveWell. Is borrowing good for the borrowers?
- GiveWell. Questions for microfinance charities.
- GiveWell. Site visits: February 2010.
- Imp-Act Consortium. SPM in practice: The Small Enterprise Foundation (South Africa) (PDF).
- Karlan, Dean, and Martin Valdivia. 2009. Teaching entrepreneurship: Impact of business training on microfinance clients and institutions (PDF). New Haven: Innovations for Poverty Action.
- Langeman, Tim. Calculating interest rates with excel (accessed June 18, 2010). MFTransparency blog, February 24, 2010. Archived by WebCite® at http://www.webcitation.org/5qa6Fx3WS.
- M-CRIL. Social rating of SEF (2008) (PDF).
- Mix Market. Small Enterprise Foundation data (1995-2009) (XLS).
- Mix Market. Small Enterprise Foundation MFI Report. http://www.mixmarket.org/mfi/sef-zaf/report?rid=rxvRLbjA (accessed February 20, 2012). Archived by WebCite® at http://www.webcitation.org/65bOHB8hv.
- Roodman, David. 2011. Interest Rates by Region. http://blogs.cgdev.org/open_book/2011/03/interest-rates-by-region.php (accessed January 5, 2012). Archived by WebCite® at http://www.webcitation.org/64TptYZse.
- Rosenberg, Richard. 1999. Measuring Microcredit Deliquency: Ratios Can Be Harmful to Your Health (PDF). Occasional Paper 3. Washington DC: Consultative Group to Assist the Poorest.
- Small Enterprise Foundation. Analysis of % of loans per loan type for all active clients (XLS).
- Small Enterprise Foundation. Annual financial statements. http://www.sef.co.za/annual-financial-statements (accessed June 18, 2010). Archived by WebCite® at http://www.webcitation.org/5qa6D4x3y.
- Small Enterprise Foundation. Audited financial statements (2007) (PDF).
- Small Enterprise Foundation. Audited financial statements (2008) (PDF).
- Small Enterprise Foundation. Background. http://www.sef.co.za/backgound (accessed June 18, 2010). Archived by WebCite® at http://www.webcitation.org/5qa6AwZFM.
- Small Enterprise Foundation. Breakdown of loans by loan type (XLSX).
- Small Enterprise Foundation. Client feedback system (DOC).
- Small Enterprise Foundation. Client savings (XLSX).
- Small Enterprise Foundation. Client service evaluation (DOC).
- Small Enterprise Foundation. Drop out report (2009) (XLS).
- Small Enterprise Foundation. Drop out report (2011) (XLS).
- Small Enterprise Foundation. Drop-out study (PPT).
- Small Enterprise Foundation. Executive summary: Dropout/arrears study research (DOC).
- Small Enterprise Foundation. Extract from draft PPI pilot survey (DOC).
- Small Enterprise Foundation. Financial projections - income statement (XLS).
- Small Enterprise Foundation. Financial projections (2011) (XLSX).
- Small Enterprise Foundation. Management review (2009) (PDF).
- Small Enterprise Foundation. Management review (2011) (PDF).
- Small Enterprise Foundation. Midterm Evaluation – Technical Learning Conversations (DOCX).
- Small Enterprise Foundation. Need for grants (July 2010-June 2011) (XLS).
- Small Enterprise Foundation. PPI poverty score card (PPT).
- Small Enterprise Foundation. Prioritized need for funds (2012) (XLSX).
- Small Enterprise Foundation. Projections – 2 scenarios (2012) (XLSX).
- Small Enterprise Foundation. Social performance standards report (2008) (XLS).
- Small Enterprise Foundation. Quality assurance rating system (DOC).
- Small Enterprise Foundation. Some program data - true arrears (2009) (XLS).
- Small Enterprise Foundation. Some program data (2011) (XLS).
- Small Enterprise Foundation. Summary including APR and EIR (XLSX).
- Small Enterprise Foundation. Tables at 33.2% interest rate (XLS).
- Small Enterprise Foundation. TLC project (DOC).
- van de Ruit, Catherine, Julian May, and Benjamin Roberts. 2001. A poverty assessment of the Small Enterprise Foundation on behalf of the Consultative Group to Assist the Poorest (PDF). South Africa: University of Natal.
- World Bank. 2005. International Comparison Program tables of results (PDF).
- 1
Small Enterprise Foundation, "Background."
- 2
- "This year SEF continued its focus on expansion with operations starting in the Eastern Cape, Mpumalanga and North-West Provinces. SEF now operates seven branches in the Eastern Cape in rural villages between Butterworth and Mthatha. In the North-West operations are located in the villages around Hammanskraal, Maubane, Winterveld, Moses Kotane Municipality, Marbieskraal and Sun City. Operations have also started in villages around Acornhoek in Mpumalanga. In all 12 new branches were opened in the financial year, six in the Eastern Cape Province, five in the North-West Province and one in Mpumalanga. SEF now has 38 branches." Small Enterprise Foundation, "Management Review (2009)," Pg 4.
- “Expansion into the Eastern Cape, Mpumalanga, and North-West provinces – This is continuing successfully. We now have seven branches in the Eastern Cape (12,800 active clients), six branches in Mpumalanga (7,500 active clients) and eight branches in the North-West province (8,500 active clients). This expansion is far from complete and we expect to be adding additional branches and thousands more clients in the coming years.
We now have 51,800 active clients in the Limpopo Province but as we now serve almost all rural communities in that province we will see only modest further growth there.” Email from John de Wit, November 25, 2011.
- 3
- John de Wit, email to GiveWell, November 25, 2011.
- John de Wit, email to GiveWell, November 30, 2011.
- John de Wit, email to GiveWell, December 27, 2011.
- John de Wit, email to GiveWell, January 29, 2012.
- John de Wit, email to GiveWell, March 6, 2012.
- John de Wit, phone conversation with GiveWell, January 19, 2012.
- Small Enterprise Foundation, “Breakdown of Loans by Loan Type.”
- Small Enterprise Foundation, "Client Feedback System."
- Small Enterprise Foundation, “Client Savings.”
- Small Enterprise Foundation, "Client Service Evaluation."
- Small Enterprise Foundation, “Drop Out Report (2011).”
- Small Enterprise Foundation, “Financial Projections (2011).”
- Small Enterprise Foundation, “Management Review (2011).”
- Small Enterprise Foundation, “Midterm Evaluation – Technical Learning Conversations.”
- Small Enterprise Foundation, “Prioritized Need for Funds (2012).”
- Small Enterprise Foundation, “Projections – 2 Scenarios (2012).”
- Small Enterprise Foundation, "Quality Assurance Rating System."
- Small Enterprise Foundation, “Some Program Data.”
- Small Enterprise Foundation, “Summary Including APR and EIR.”
- 4
Small Enterprise Foundation, "Social Performance Standards Report (2008)."
- 5
Length of loan How often are repayments due? % of SEF loans 4 months Every 2 weeks 11% 4 months Monthly 28% 6 months Every 2 weeks 7% 6 months Monthly 53% 10 months Monthly 0.4% Data from Small Enterprise Foundation, "Breakdown of loans by loan type."
- 6
- "It is compulsory for every client to save at every fortnightly meeting but clients may withdraw whenever they wish. The minimum amount that must be saved is set at a low R10 per person per fortnight. After the first loan, 10% of the subsequent loan is required as up-front savings." M-CRIL, "Social Rating of SEF (2008)," Pg 5.
- "Financial transactions are through branches of the banking system – mainly the Post Savings Bank which has a wide network, or Nedbank...SEF does not collect savings deposits but encourages clients to save in their Bank group account." M-CRIL, "Social Rating of SEF (2008)," Pg 4.
- “While clients are encouraged to save at each of their fortnightly meetings they may also withdraw their savings whenever they wish.” Data from Small Enterprise Foundation, "Client Savings."
- “Does SEF continue to require loan recipients to save money in accounts in independent institutions?
We do still require clients to save in accounts in independent institutions. In fact there have been significant improvements in client savings since 2009. See the attached file “Client Savings”.
In each year client savings peak in October or November. Clients then make large withdrawals for spending over the Christmas period and also for expenditure for the new school year which starts in January. The Savings per Client for October 2009, October 2010 and October 2011 in Rand was respectively R272, R348 and R377. There was thus a very healthy 28% increase in savings from October 2009 to October 2010 and a satisfactory increase of 8% between the same months in 2010 and 2011.” John de Wit, email to GiveWell, December 27, 2011.
- 7
"Why doesn't SEF offer savings services? – Two main reasons (1) Regulation – we would have to obtain a banking license. These are not easy to come by and also require a really large amount of capital. (2) Because of South Africa’s relatively very high labour costs and high rate of violent crime it is very expensive to collect small savings deposits or to allow small savings withdrawals, especially in rural areas. It may also be noted that the Post Bank and commercial banks do offer reasonable (“reasonable” not “good”) access to savings facilities for the poor." John de Wit, email to GiveWell, December 7, 2009.
- 8
- "SEF has tried testing a life insurance product, with a pilot during 2006-7 but uptake was very low and the product was not continued." M-CRIL, "Social Rating of SEF (2008)," Pg 5.
- “Have we started offering any other services besides loans (e.g. savings, insurance)?
As noted above we facilitate clients’ saving in other formal banking institutions.
When microfinance institutions talk of offering micro-insurance then it appears that the most common form of insurance that they offer is actually credit-life insurance. This is insurance where any outstanding amount owed on a loan by a client will be written off should the client die. SEF has always contracted to write-off the outstanding amount on its loans to its clients should they die. So in effect SEF does offer the most common form of micro-insurance, although it does not call it by that name and does not sell it as a separate product.
In partnership with a health NGO we also offer HIV/AIDs and gender empowerment training to our clients. Due to the costs associated with such training it is not possible to offer this training to all clients every year. To date 15,065 SEF clients have completed this training and a further 5,810 are currently receiving this training.
During 2011 approximately 3,500 clients received six sessions of business skills education as part of the pilot of delivering this type of training to clients. This initiative is now being scaled up.” John de Wit, email to GiveWell, December 27, 2011.
- 9
Small Enterprise Foundation, "Annual Financial Statements."
- 10
Sara Duke, phone conversation with GiveWell, November 18, 2009. She told us that M-CRIL sends evaluators to meet with representatives of the organization and gather data for their report. She was not able to share other reports with us due to confidentiality restrictions.
- 11Small Enterprise Foundation, "Executive Summary: Dropout/Arrears Study Research," Pg 1.
"SEF’s management systems were unable to support the growth of the previous financial year, leaving key aspects of the methodology – support to client businesses and well-functioning groups and centres – to be poorly managed. A lack of experienced staff due to recruitment for expansion and due to dismissals also meant that many staff were not equipped to deal with the problems they encountered." Small Enterprise Foundation, "Executive Summary: Dropout/Arrears Study Research," Pg 3.
- 12
“GiveWell: At one point in the past, you conducted surveys to see why clients have dropped our. Have you done any more of that?
SEF: Not in the last 2 years. We found that the dropout surveys don't tell us anything new, because the results tend to be the same across the different surveys. Dropouts tend to be unhappy about having to bear other people's debt.” John de Wit, phone conversation with GiveWell, January 19, 2012. - 13
"In 2009 SEF paid for the design of a specific poverty scorecard (identical to a PPI, Progress Out of Poverty Index) for rural, black households in South Africa. (See the attached invoice from Microfinance Risk Management.) Such a tool had already been developed for all of South Africa but the indicators in this tool were not appropriate for trying to measure change in poverty status over time. We, therefore, commissioned the more focused tool.
Unlike almost all MFIs worldwide SEF has not just accepted the PPI but has carried out extensive field tests to try to verify that (1) the PPI gives reliable results and (2) can be implemented by staff who do not have the highest levels of education. (A quick example of this work is attached as “2012-03-05 Field trip to BBR for PMTs”.)"
John de Wit, email to GiveWell, March 6, 2012.
- 14
Small Enterprise Foundation, "Drop Out Report (2009)."
- 15
Small Enterprise Foundation, “Drop Out Report (2011).”
- 16
For instance, drop out rate as of June 30 is calculated on July 31 as:
(Number of clients who completed a loan between January 1 and June 30 and after completion, did not take out a second loan before July 31) divided by (Number of clients who completed a loan between January 1 and June 30). John de Wit, email to GiveWell, July 13, 2010. - 17
GiveWell, "Is borrowing good for the borrowers?"
- 18 Small Enterprise Foundation, "Drop-Out Study."
- 19
"SEF has a detailed incentive system in place which has been adapted over time and is still evolving. It applies primarily to DFs [Development Facilitators] and to BMs [Branch Managers]. The incentive can contribute up to 70% of the basic monthly salary – and is assessed for DFs every month. Branch Managers have one component that is paid monthly and another which is paid fortnightly. The system is based primarily on growth (number of groups, deliberately not portfolio) and maintaining portfolio quality (low number of groups with arrears). During 2007/8 SEF has piloted a revised system to include a weighting for dropouts. SEF is able to do this because of its close monitoring of the dropout rate (see below) and is concerned to include this alongside growth and quality parameters, so as to support client retention." M-CRIL, "Social Rating of SEF (2008)," Pg 6.
- 20
Small Enterprise Foundation, "Drop-Out Study."
- 21
"Research Objective: To investigate reasons for SEF’s increased arrears and dropout rate since January 2009." Small Enterprise Foundation, "Executive Summary: Dropout/Arrears Study Research," Pg 1.
- 22
"'Dropouts complained of the lack of recording of patching and their savings being used, sometimes without their knowledge, to patch other members...Complaints of having to attend fortnightly meetings and the use of the centre savings fund for patching all pointed to a breakdown of discipline and poor problem-solving at the centre level. Conflicts were addressed by keeping the entire centre in a meeting for 3 to 4 hours...In areas that had particularly high exit rates, issues with staff honesty were cited by current clients as reasons they were thinking of dropping out or why others had already dropped out. Where fraud had occurred with the previous DF, centres in the area were undisciplined and faced the problems with patching mentioned above." Small Enterprise Foundation, "Executive Summary: Dropout/Arrears Study Research," Pg 3.
- 23
“GiveWell: At one point in the past, you conducted surveys to see why clients have dropped our. Have you done any more of that?
SEF: Not in the last 2 years. We found that the dropout surveys don't tell us anything new, because the results tend to be the same across the different surveys. Dropouts tend to be unhappy about having to bear other people's debt.” John de Wit, phone conversation with GiveWell, January 19, 2012.
- 24
"We have instituted steps to address such issues. Firstly, field staff may not require clients to use their savings to pay other clients’ debt. Secondly, where clients lend money to others to assist them to repay their loans then their field worker is required to keep a record of this and to ensure that the clients who assisted others are repaid.
Where we see individual field worker areas with high drop-outs their managers are instructed to return to check their adherence to the above." John de Wit, email to GiveWell, March 6, 2012. - 25
"Loan size is linked to two features – level of savings and the business evaluation undertaken by the DF. The business evaluation estimates value of the business, stock/materials, accounts receivable and cash on hand of the clients, and is undertaken in detail." M-CRIL, "Social Rating of SEF (2008)," Pg 7.
- 26
M-CRIL, "Social Rating of SEF (2008)," Pg 7.
- 27
"Centre leadership complained of staff undermining decisions taken in the centre about loan sizes and allowing clients to have larger loans even after the centre had agreed otherwise." Small Enterprise Foundation, "Executive Summary: Dropout/Arrears Study Research," Pg 3.
- 28
Small Enterprise Foundation, "Drop-Out Study."
- 29
"Centre savings, attendance and repayment rates are monitored. Any centre which falls below a certain ‘trigger value’ for any one of these is defined as ‘vulnerable’, and so is targeted for corrective action. In this way, SEF has designed an ‘early warning system’ to detect problems before they become systemic and harmful to the MFI as well as its clients." Imp-Act Consortium, "SPM in Practice: The Small Enterprise Foundation (South Africa)," Pgs 3-4.
- 30
"Client protection: Strong values of social responsibility, reflecting principle of ‘respect for all’. These values are integrated into operations; and partially monitored as part of Quality Assurance." M-CRIL, "Social Rating of SEF (2008)," Pg 2.
- 31
"SEF has a detailed incentive system in place which has been adapted over time and is still evolving. It applies primarily to DFs and to BMs. The incentive can contribute up to 70% of the basic monthly salary – and is assessed for DFs every month. Branch Managers have one component that is paid monthly and another which is paid fortnightly. The system is based primarily on growth (number of groups, deliberately not portfolio) and maintaining portfolio quality (low number of groups with arrears). During 2007/8 SEF has piloted a revised system to include a weighting for dropouts. SEF is able to do this because of its close monitoring of the dropout rate (see below) and is concerned to include this alongside growth and quality parameters, so as to support client retention." M-CRIL, "Social Rating of SEF (2008)," Pg 6.
- 32
"How does SEF guard against harassment? We have a Quality Assurance department which conducts audits of ever branch once or twice per year. As part of these audits clients are interviewed about their experience with SEF. I have attached here three documents used in these audits.
1. “Client Service” ["Client Service Evaluation"] – this format was introduced many, many years ago. Probably more than ten years ago.
2. “QUALITY AUDITS RATING SYSTEM4 - June2008” ["Quality Assurance Rating System"] – question 13 in this document shows that checking on client service is part of our branch rating system that was introduced in 2008.
3. “Client Feedback System Evaluation Form_4” ["Client Feedback System"] – this is a new form that has been tested and will be implemented by Quality Assurance in the next month or so, in addition to the Quality Audit Rating System.
I asked the head of Quality Assurance as to how often issues of unsatisfactory treatment of clients by staff were raised by clients. He said this happened very seldom and whenever these were found such cases were treated as a “Major Audit finding”. He added that this is an area in which he had no doubt that managers took immediate and appropriate action.
In addition, while the world knows of terrible incidents of harassment of microfinance clients in India SEF operates in an entirely different cultural context. SEF’s clients and the communities in which they live would not tolerate the kinds of harassment that are reported having occurred in India." John de Wit, email to GiveWell, March 6, 2012. - 33
M-CRIL, "Social Rating of SEF (2008)," Pg 13.
- 34
"Current competitors include the parastatal Land Bank’s Step-Up Programme and Marang Financial Services. SEF expects some disruption from the Step-Up Programme. This programme provides individual loans at less than half SEF’s interest rate. Moreover, Step-Up appears to be ‘pushing’ loans without regard to sustainability, and appears unconcerned about defaults. Marang currently serves the same market as MCP and offers similar products. This is currently SEF’s most serious competitor." Baumann 2003, Pg 27.
- 35
"In future it will need to try to review other household liabilities, as it expands into areas with other MFIs." M-CRIL, "Social Rating of SEF (2008)," Pg 7. "[C]ompetition is beginning in Limpopo and as SEF expands to the Eastern Cape." M-CRIL, "Social Rating of SEF (2008)," Pg 13.
- 36
"A previously mentioned, the North Zone is particularly affected by the presence of Marang, WDB and money lenders. While only 3 out of 8 clients in arrears interviewed admitted to having to take loans from sources other than SEF, though centre leaders implied that more clients than this were taking out “double” loans...This research did not find evidence of clients dropping out because of other’s over-indebtedness though the clients who did admit to being members of both SEF and WDB were in arrears, which implies that they had become over-indebted." Small Enterprise Foundation, "Executive Summary: Dropout/Arrears Study Research," Pg 1.
- 37
"It may be noted that when staff detected that clients may be borrowing from not only SEF but also from the other MFI that had recently moved into the North Zone then they took firm action to ensure that repeat loans were strictly based on clients demonstrating their ability to utilize loans well. They applied a cautious, conservative approach. This protected clients from taking on too much debt but at a severe cost to SEF. From June 2009 to June 2010 instead of increasing by 10% as would have been expected, the average loan size in this zone fell by 12%. This led to a loss of income of about $380,000. This surely is evidence that SEF is prepared to take active steps to protect its clients from overindebtedness.
While the entry of the new MFI into the new Zone saw the client exit rate in this Zone reach 25% in June 2009 the corrective action saw client retention strongly improve. By June 2011 client exit in this Zone stood at 17% (and 13% in December 2011)." John de Wit, email to GiveWell, March 6, 2012.
- 38
“Do we have any new indication about whether SEF’s clients may also be clients of other MFIs?
This is something which we try to keep an eye on as we are always concerned that our clients may become over-indebted by borrowing not only from ourselves but also from other MFIs. It is, however, difficult to firmly establish whether clients are borrowing from other sources as they will seldom openly reveal this information. We thus rely on our field staff to look out for indications of such problems as they may detect this when clients have difficulties in making loan repayments. In the past year we have not received reports of clients struggling to repay loans because of becoming over-indebted. Again, our record high repayments rates and client retention rates give us some ease that this is not a significant factor at this time.Have new MFIs entered Limpopo?
No, as far as we are aware no new MFIs have entered Limpopo.” John de Wit, email to GiveWell, December 27, 2011.
- 39
“Are the new areas SEF entered already served by other MFIs?
Yes, two of SEF’s new branches were already served by other MFIs. As SEF specifically targets poorer clients it may be, however, that in general our client target group is not the same as that of other MFIs.
The quality of our performance in those branches has been very good so whether they were former clients of another MFI, are still clients or another MFI or where never clients of another MFI, this is a strong indication that our clients in those branches appreciate what SEF is offering them.” John de Wit, email to GiveWell, December 27, 2011. - 40
Data and calculations are in Small Enterprise Foundation, "Summary including APR and EIR." Data on '% of SEF loans' is from Small Enterprise Foundation, "Breakdown of loans by loan type."
Annual percentage rate (APR), effective interest rate (EIR) and monthly rate were calculated by GiveWell. Note that the APR is equal to 12 times the monthly interest rate, while the EIR fully incorporates "compounding," whose relevance to microloans is debatable. For more information on calculating interest rates for microfinance banks, see Langeman 2010.
Length of loan Repayment schedule % of SEF loans Monthly rate Annual Percentage Rate (APR) Effective Interest Rate (EIR) 6 months Monthly 53% 7.0% 82-84% (depends on loan size) 121-126% (depends on loan size) 4 months Monthly 28% 7.0% 84% 124% 4 months Every 2 weeks 11% 7.4% 89% 140% 6 months Every 2 weeks 7% 6.3% 76% 111% 10 months Monthly 0.4% 5.5-7.4% (depends on loan size) 67-89% (depends on loan size) 91-135% (depends on loan size) - 41
Roodman, “Interest Rates by Region.” Note that the interest rates reported by Roodman are adjusted for inflation (while SEF's are not, which would make SEF's appear higher), and that interest rates are typically higher for MFIs, like SEF, working with poorer customers.
SEF argues that it faces different constraints than other Sub-Saharan African MFIs: "SEF operates in an entirely different economy from other Sub-Saharan African countries. Its labour costs, which make up 68% of all costs, are far higher than those of other Sub-Saharan African countries. The GDP per capita for Sub-Saharan Africa in 2010 was $1286 whereas for South Africa it was $7275.
Not only are SEF’s costs much higher than those experienced in other Sub-Saharan African countries but SEF’s average outstanding loan (the basis for earning income) at $242 is substantially lower than that for Sub-Saharan African MFIs where the number is $359. (These figures were obtained from the MIX for 2010.)" John de Wit, email to GiveWell, March 6, 2012. - 42
In 2009 and 2010, SEF disbursed a total of R 541,298,000. To be conservative, we assume a 6-month loan term (only 1% of loans have a longer term than this). Between January 2009 and June 2011 (the end of the period plus the length of one loan term), there was R 3,592,961 in death write-offs and other write-offs (which SEF calls bad debts). The sum of the stock of rescheduled loans and arrears in June 2011 (i.e. all loans that were neither repaid nor rewritten of as of that date) was R 483,076. Under the assumption that all debt disbursed in 2009-2010 was either repaid, written off or entered into arrears/rescheduled loans by 6 months into 2011:
Lower bound collection rate = (R 541,298,000 – R 3,592,961 – R 483,076) / R 541,298,000 = 99.25%Data is from Small Enterprise Foundation, "Some Program Data." Loan term data is from Small Enterprise Foundation, "Breakdown of Loans by Loan Type."
- 43
We used the estimation method given by Rosenberg 1999, Pg 20:
Annual loss rate (ALR) = [(1 - collection rate) / (loan term)] * 2
SEF's average loan term is 0.435 years. Small Enterprise Foundation, "Breakdown of Loans by Loan Type."
- 44
Mix Market, "Small Enterprise Foundation MFI Report."
- 45
"[T]he Northern Province emerges as one of the poorest provinces in South Africa. Moreover, two of the three communities in which the CGAP/SEF study was undertaken are among the poorest in that province." van de Ruit, May, and Roberts 2001, Pg 39.
See also van de Ruit, May, and Roberts 2001, Pg 38, Table 14.
- 46
van de Ruit, May, and Roberts 2001, Pg 13.
- 47
van de Ruit, May, and Roberts 2001.
- 48
"The results for the poverty targeted scheme, TCP, show that clients are consistently poorer than non-clients." van de Ruit, May, and Roberts 2001, Pg 23.
- 49
See list in van de Ruit, May, and Roberts 2001, Pgs 17-18.
- 50
It was 32% in 2008 according to M-CRIL "Social Rating of SEF (2008)," Pg 5. However, John de Wit reported that it had fallen to 18% in an email to GiveWell on March 6, 2012.
- 51
"MCP [the non-targeted program] clients are better off than the non-clients." van de Ruit, May, and Roberts 2001, Pg 23.
- 52
"The current strategy is to expand only with TCP, and no new MCP branches have been established for a number of years." M-CRIL, "Social Rating of SEF (2008)," Pg 5.
- 53
"At the outset of the PPI pilot, three key methodological decisions were made to select clients for the pilot’s sample:
1) The PPI pilot would only apply to TCP branches.
2) PPI interviews would be conducted in all 16 TCP branches.
3) Each member of the Survey Team would be given a list of twice as many TCP clients as they would be required to interview, randomised by PWR score and client age.
The third decision was made in recognition of the fact that reliable addresses, or directions, for finding clients do not exist in most of SEF’s areas of operation...As Figures 3 and 4 demonstrate, this modus operandi yielded a representative sample of TCP clients by PWR score and client age, when compared with the underlying TCP population as of June 2007...By providing members of the Survey Team with lists of twice as many clients as needed, their reliance on SEF’s loan officers skewed the pilot’s sample towards TCP clients in loan cycle 1 – also referred to as ‘entering clients’ – as Figure 5 confirms." Small Enterprise Foundation, "Extract from Draft PPI Pilot Survey," Pgs 5-6. - 54
Small Enterprise Foundation, "Extract from Draft PPI Pilot Survey," Pgs 4.
- 55
"[T]he PPI tool estimated 89.5% of all TCP clients as ‘poor’, using a $2/day poverty line... [and] 64.4% of all TCP clients as ‘very poor’, using a $1/day poverty line." Small Enterprise Foundation, "Extract from Draft PPI Pilot Survey," Pg 8.
South Africa has price level index (i.e. the ratio of PPP (US$=1) to official exchange rate (US$=1) multiplied by 100) of 61, according to World Bank 2005, Pg 23. $1 divided by 0.61 to adjust for the differences in price levels between South Africa and the U.S. is $1.64. $2 divided by 0.61 to adjust for the differences in price levels between South Africa and the U.S. is $3.28.
- 56
"In contrast, the indirect approach via poverty scoring is simple, quick, and inexpensive. It uses ten verifiable indicators (such as “What is the main source of cooking energy/fuel for this household?” or “Does the household own a refrigerator or freezer?”) to get a score that is highly correlated with poverty status as measured by the exhaustive survey." Chen 2009, Pg 1.
- 57
M-CRIL, "Social Rating of SEF (2008)," Pg 12.
- 58
“Does SEF continue to collect data on whether it is succeeding in its attempt to target people with low-incomes? Have client demographics changed since our last report?
Yes, we are still fully committed to serving those who live in poverty and continue to use our poverty targeting methodology, participatory wealth ranking (or PWR) to ensure this.Client demographics are very much the same as in 2009.” John de Wit, email to GiveWell, December 27, 2011.
- 59
GiveWell, "Is borrowing good for the borrowers?"
- 60
"Cost per borrower: 128 (USD)" Cost per borrower = (Operating Expense / Average Number of Active Borrowers). Mix Market, "Small Enterprise Foundation MFI Report."
- 61
- $121/$5.50/bednet = 22 bednets distributed
- 22 bednets cover 40 people because each bednet typically covers 1.8 people. World Health Organization, "World Malaria Report (2011)," Pg 28.
- Although long-lasting insecticide-treated bed nets are manufactured to last five years, they tend to decay under use and are expected to last an average of 2.22 years.
- 62
Small Enterprise Foundation, “Prioritized Need for Funds (2012).”
- 63
“Right now SEF’s growth is limited by the amount of capital we have on our balance sheet or to put it another way, by the “Net Worth” on our balance sheet. (If we were a for-profit then one might say our growth is limited by the amount of equity we have.)
In order to expand we have to be able to borrow the loan capital which we on-lend to our clients. Due to our strong performance we are able to access such borrowings, however, the amount which our lenders will permit us to borrow is limited by our Net Worth. Several of our lenders have covenants in place in which we are required to maintain a Solvency of 20%. Solvency is the ratio of Net Worth to Assets. Over 85% of our Assets are made up of our lending to our clients so if we expand these borrowings but the Net Worth does not increase then the solvency would slip below 20%. We are now in exactly this situation and have to carefully manage our expansion to ensure our growth does not cause our solvency to slip below 20%.
At this time we have the internal capacity in terms of management, human resources and systems to increase the number of people we serve at a rate of around 20% to 25% per annum. Due to the above capital constraint, however, we have to restrict our grow to 12% to 15% per annum. See the attached summary of our financial projections “Summary projections 5 year vs5”. From this you will see the client growth rate in row 95 and the solvency in row 90. From 2004 to 2008 we were able to grow with confidence at an average of at least 20% per annum. In 2009 we actually over-stretched ourselves and grew too fast. This led to some deterioration in our performance numbers for that year and 2010. As we pushed all focus on regaining the quality of our work growth dipped to 14% for 2009 and 11% for 2010.
The corrective action really bore fruit in 2011 with the excellent performance which we have reported. By 2011 we had in place the management systems, human resources and other systems needed to support stronger growth but could not carry on with this as it would have led to a solvency of less than 20%. This situation continues.
Where we receive grants for loan capital then due to the solvency relationship we are then able to borrow $4 for every $1 which we receive in loan capital. This is a leverage of 4 to 1. In fact for every dollar received for loan capital we are able to lend out $5 – the original dollar received plus an additional $4 which we raise in borrowings. (GiveWell recently wrote a blog on charities and leverage. I think you will agree that this is true leverage.)
At this time if we received grant funding of $750,000 we would be able increase our rate of growth to between 20% and 23%. This would mean that by June 2015 we would be reaching 14,000 more clients than where we do not receive this funding. By June 2016 this will grow to 21,000 additional clients.” John de Wit, email to GiveWell, December 27, 2011.
- 64
- Small Enterprise Foundation, “Prioritized Need for Funds (2012).”
- “GiveWell: Your email about room for more funding mentioned that increased funding for social performance monitoring was one of your priorities. What would increasing that consist of?
SEF: In the last two years, we've found that when we ask staff to collect social performance data, they deemphasize this in favor for the things they are rewarded for (arrears, dropout). We get data, but we're not sure of the quality of the reporting; the staff take shortcuts in collecting the social performance data.
The answer is to strengthen our quality assurance team by creating special “social auditor” positions, probably 4 total, and then do a lot more auditing of the social performance data, like size of business. We've also been experimenting with the progress out of poverty index (PPI) and participatory wealth ranking (PWR), and we want to be able to audit both of those.
The cost I mentioned in my email is the cost for four social auditors for one year.” John de Wit, phone conversation with GiveWell, January 19, 2012.
- 65
- Small Enterprise Foundation, “Prioritized Need for Funds (2012).” Note that this is a slight upward revision of a previous estimate that John de Wit supplied of $24,000. See John de Wit, email to GiveWell, December 27, 2011 and John de Wit, email to GiveWell, January 29, 2012.
- “GiveWell: You also mentioned a feasibility study of SEF taking savings. Can you tell us more about that?
SEF: We currently facilitate savings with banks, but don't take them ourselves. In many places, our clients have to travel quite far to deposit their savings, and the banks tend to charge fees to make withdrawals or deposits. Fees could be $.50 or so, discouraging small savings.
So we want to know if SEF should start offering savings directly. We'd study the market for savings, look into the policy framework, and see if there's a good way for us to become a legal deposit-taker. We'd also look for a creative way to collect savings to reduce cost; right now the costs appear prohibitive.” John de Wit, phone conversation with GiveWell, January 19, 2012.
- 66
- Small Enterprise Foundation, “Prioritized Need for Funds (2012).”
- “GiveWell: And you also mentioned a program for preparing internal candidates for management positions?
SEF: We've tried to us psychometric tests to determine people who have high potential. Our employees usually have a really weak educational background, but some are extremely strong employees. Our idea is to identify six people like that, take them out of their current jobs, and put them in some kind of management exposure program where they can develop more general skills.
We tend to have to hire from outside the organization for skilled posts, but we'd rather hire from inside.” John de Wit, phone conversation with GiveWell, January 19, 2012.
- 67
Small Enterprise Foundation, “Prioritized Need for Funds (2012).”
- 68
- “Let me also mention here that we have had most encouraging results with the clients skills development pilot which we funded with part of the original grant from GiveWell. A month back the first formal review of this pilot was conducted. During this I was very pleased with the very positive feedback on the pilot which was received from a whole range of our managers who had observed these skills development sessions taking place with clients. I have attached here an internal report on this pilot...
The conclusion of our midterm evaluation of the client skills development pilot was that we would now expand it from two branches to seven or eight branches. Our main focus for the coming months of the pilot will be on improving the management systems for this work.
So at this point it looks like we are achieving most positive results with this initiative and there is a good chance that this will have a significant impact on our organisation – moving us to an organisation that now formally provides skills training to clients along with our existing work.
And by the way, in case it all sounds too easy – “grant given, success achieved” – let me mention here that in the past we have launched other initiatives that have not worked out. Amongst these were a micro-insurance scheme which had to be called off and a first attempt at bringing HIV/AIDs education to clients. (A later very different initiative on HIV/AIDs and gender empowerment education, the IMAGE project, worked extremely well and is still being rolled out to our clients).” John de Wit, email to GiveWell, November 25, 2011. - Small Enterprise Foundation, “Midterm Evaluation - Technical Learning Conversation.”
- “Let me also mention here that we have had most encouraging results with the clients skills development pilot which we funded with part of the original grant from GiveWell. A month back the first formal review of this pilot was conducted. During this I was very pleased with the very positive feedback on the pilot which was received from a whole range of our managers who had observed these skills development sessions taking place with clients. I have attached here an internal report on this pilot...
- 69
- Mix Market, "Small Enterprise Foundation Data (1995-2009)."
- Small Enterprise Foundation, “Management Review (2011).”
- 70
In response to this question, SEF told us, "there are no for-profit lenders in South Africa that lend to people who cannot prove employment income from a formal employer. SEF does not lend to formally employed people." John de Wit, email to GiveWell, March 6, 2012.
Charity Response
Response from the Small Enterprise Foundation:
The most rigorous research done on SEF's social impact was the IMAGE randomized control trial. While that study mainly compared the combination of microfinance + HIV/AIDs and gender empowerment training versus a control group the researchers also carried out additional research to compare microfinance alone versus a control group. This was reported in the Bulletin of the World Health Organization http://www.who.int/bulletin/volumes/87/11/08-056580/en/index.html
This paper may also be found on SEF's website at http://www.sef.co.za/files/03%20-http://www.sef.co.za/files/03%20-%20Ki…
Quoting from this paper: “Evaluation of the effects of the MF-only intervention against the control group revealed a clear pattern of improvement across all nine indicators of economic well-being, including household asset value, ability to repay debts and ability to meet basic household needs.”
A full collection of papers from the IMAGE randomized control trial may be found at http://www.sef.co.za/image-study